
Share your thoughts
placeholder
Article
#BTC 📈
Something like this for $BTC wouldn't surprise me.
If we spent more days above 80k and take out 83k high, people will get more bullish, so a bit of clean of late longs is on the table 🐂
post-image
BTC-1.61%
I’m watching $XPL /USDT closely here 👀 the 4H chart is showing a strong recovery from the 0.07948 area, and momentum has clearly picked up with rising volume.
Price is now around 0.09316, sitting near an important resistance zone. If buyers reclaim this area with a solid 4H close, the next move could get interesting. 🔥
📌 $XPL/USDT LONG SETUP
🟢 Entry Zone: 0.0910 – 0.0935
🎯 TP1: 0.0970
🎯 TP2: 0.1025
🎯 TP3: 0.1120
🛑 Stop Loss: 0.0870
The key level I’m watching is 0.0954. A clean breakout and hold above it could open the door toward the higher targets. If price loses the entry structure,
XPL-1.44%
August unemployment rate at +4.1% vs. +4.1% est. & +4.1% in prior month
post-image
$TNSR Bottom ✅
$Tnsr will now pump to 0.040$ from Here
Easy 20% coming
post-image
TNSR-1.39%
This NFP move was laid out long ago; the data was merely the spark.
When autumn comes on September 8, once my flowers bloom, all other flowers will be slain.
Those who position early feast, while those who chase cinnabar afterward eat dirt.$BTC
post-image
BTC-1.62%
This move doesn’t even require me to think—the account is partying all by itself. A few days ago, I checked $RAVE before bed. It was just short of pushing higher, with selling pressure firmly capping it—a textbook weak rebound. I placed a short at 0.5243, and when I woke up, the answer was right there: current price 0.2475, position +1294.14%. Feels good, guys—getting the timing right really is that simple. Close 80% first, leave the remaining position at +1294.20%, and move the stop loss to breakeven. If it keeps selling off, let the profits run; if it rebounds, don’t give those profits back.
post-image
RAVE-1.32%
ADA-2.09%
LAB+2.18%
$PEPE broke its short-term downtrend — but the breakout still needs confirmation.
After the recent ~15% move, price faced resistance and pulled back. Now the retest matters more than the initial breakout.
What I’m watching:
• Hold the breakout zone → bullish structure remains valid.
• Reclaim resistance with volume → stronger confirmation.
• Lose the zone → higher risk of a fakeout.
The key lesson:
A breakout gives you a signal. The retest tells you if buyers can defend it.
Would you wait for confirmation, or trust the breakout?
$PEPE #PEPE #GateSquare #Crypto
post-image
PEPE-5.38%
Is this real chat?
Robinhood SEC & FBI?
HOOD-1.82%
$SOL is holding its bullish structure after a strong breakout, with price consolidating around $100–$104. As long as the $100 support holds, another push toward the $108–$110 resistance zone remains possible.
post-image
SOL-2.77%
Sandisk at 1641 is a level to short! Use a light position, with 1580 as the initial target! If it breaks down, then look to 1520! Short-term traders, manage your risk! #非农就业报告即将揭晓
post-image
🚨BREAKING: Tech Stocks are up, Meanwhile the whole market is bleeding.
This is a bad news, those who know, will understand.
post-image
Is this really a rebound? It’s CPR for my empty account, isn’t it? I was just about to curse it a couple of times, but then I saw that the current price had already reached 95.13, with unrealized gains at +338.3%—this move gave us the answer! The trend was clean and decisive; everyone on board should be waking up laughing.
Looking back at the repeated intraday fluctuations, $INTC hovered around 90.88. I watched it for half an hour and noticed that funds quietly entered every time it dipped, while the key levels on the sell side became increasingly thin. Details like these don’t lie. I said at
post-image
INTC+5.29%
LAB+2.18%
SOL-2.97%
$BEAT has always been there; I still think it’s a shakeout!
BEAT+1.46%
  • 1
edgeX. It surged 74% from around 0.66 yesterday; today it is continuing at high levels, with the gain already narrowing. Volume remains, but this is second-day momentum.
$EDGEX
post-image
EDGEX+4.37%
Both trades played out perfectly again! Just stay precise!
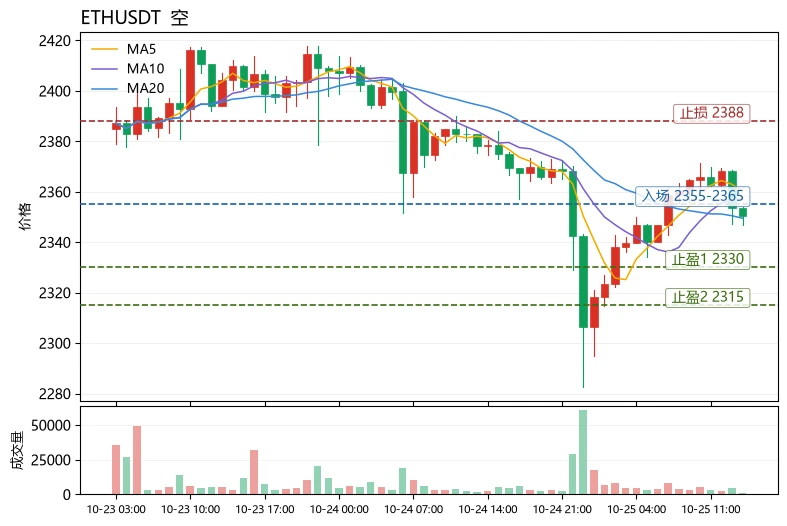
ETH delivered nearly 60 points of room
XAU easily made a 30-point rebound into the target range
Only with direction amid market movements can one gain a foothold
Instead of standing still, take a different path
Action is the answer to reaching the shore
$ETH $XAU
ETH-1.55%
XAU-1.23%
I’m watching $ZIG /USDT closely here 👀🔥
The 4H chart is starting to look interesting after that sharp bounce from 0.03407. Buyers have stepped back in with strong volume, and price is now holding above the short-term moving averages.
📌 ZIG/USDT — Bullish Setup
🟢 Entry Zone: 0.04000 – 0.04130
🎯 TP1: 0.04380
🎯 TP2: 0.04650
🎯 TP3: 0.04950
🛑 Stop Loss: 0.03820
The key area I’m watching is 0.0438. A clean 4H breakout and hold above that resistance could give ZIG the momentum needed for the next push higher. 🚀
I wouldn’t chase a sudden green candle though ideally, let price come into the e
post-image
ZIG+2.61%
#AugustNFPReportComing – The US Jobs Report That Shook the Markets
The August 2026 Nonfarm Payrolls (NFP) report has officially landed, and it delivered a surprise that sent shockwaves through financial markets worldwide. Released on Friday, September 4, at 8:30 AM ET by the U.S. Bureau of Labor Statistics (BLS), the report painted a picture of a U.S. labor market that is far more resilient than many had anticipated.
---
The Headline Numbers
Total nonfarm payroll employment increased by 162,000 in August. This figure significantly exceeded consensus forecasts, which had projected a modest rebo
post-image
NFP-2.75%
EURUSD-0.04%
USDJPY+0.15%
SPX500+0.37%
ARB at $0.13—are you buying the dip?
Look at the surface first: a barrage of positive news, but the price surged and then retreated.
Over the past week, it violently rallied from $0.07-$0.09 to $0.146, gaining over 70%. Intraday, it pulled back to $0.13 after being hit by macro data. Robinhood Chain launched its mainnet, with daily fees surging to several million dollars. Under the protocol's 10% net revenue share, this directly brings real money to the Arbitrum ecosystem.
First: Is Robinhood Chain an “ATM” for ARB?
Robinhood Chain is based on Arbitrum Orbit technology, with daily on-chain fee
post-image
BTC-1.61%
ETH-1.46%
ARB-1.46%
$TRIA Signal】1H pullback buying, 4H momentum intact
$TRIA 1H-level pullback, MACD bearish crossover, RSI 57.7 holding above the midpoint. The 4H MACD histogram remains positive, with the price hugging the upper Bollinger Band at 0.0049. Volume is declining, OI is flat, and the long defense remains intact.
🎯Direction: Long
⚡Entry/limit order: 0.00477065 - 0.00478500
🛑Stop-loss: 0.00454575
🚀Target 1: 0.00514388
🚀Target 2: 0.00532331
🛡️Trade management:
- After reaching Target 1, reduce the position by 50% and move the stop-loss to breakeven. If the price falls back to the entry level, exit
post-image
TRIA+33.07%
BTC-1.61%
ETH-1.46%
SOL-2.77%
Load More

Join 40 M users in our growing community

⚡️ Join 40 M users in the crypto craze discussion

💬 Engage with your favorite top creators

👍 See what interests you

View More