Share crypto content and earn up to 60% commissions through content mining.
placeholder
gatefun
the cat on base?
post-image
  • Reward
  • Comment
  • Repost
  • Share
GM! A new week begins!
Passing by a small park, I saw a pond full of lotus flowers 🪷
Suddenly, I felt a little sense of happiness
Sometimes, simple beauty is right beside us
We rush toward our goals for the beauty we imagine, hurrying along
And miss what’s beside us, which was beautiful all along~
View Original
post-image
post-image
  • Reward
  • Comment
  • Repost
  • Share
8.17 SOL Analysis
Analysis: Short near the rebound at 75.4‑75.9, with a stop at 76.3; first target 74.6, second target 74.1
On the SOL1H timeframe, the price fluctuated downward after surging to the stage high of 75.70, dipping to a low of 74.00, and is currently making a slight rebound from the lows. The MA7 and MA30 moving averages are both trending downward, creating pressure on the market. The 75.4‑75.9 range above faces selling pressure from the previous decline, and this recovery is a short-term rebound after a sharp drop. MACD is below the zero line, with weak rebound momentum. The hour
SOL-0.27%
View Original
post-image
  • Reward
  • Comment
  • Repost
  • Share
JUST IN: Serenity argues general-purpose robots must adapt to human-built environments, with Tesla Optimus expected to converge to the "correct form".
If borne out, this reshapes how we think about robotics adoption and infrastructure compatibility. $TSLA?
TSLA0.65%
post-image
  • Reward
  • Comment
  • Repost
  • Share
$ZEREBRO Signal】Long + 1H Bollinger upper band/4H MACD expansion
$ZEREBRO Buy/sell depth ratio 2.13, trading along the 1H Bollinger upper band, with strong bid support in the order book. The 4H MACD histogram is expanding. Funding rate 0.0254%, OI stable, with no long liquidation cascade.
🎯Direction: 【Long】
⚡Entry/limit order: 0.04400559 - 0.04413800
🛑Stop-loss: 0.04369662
🚀Target 1: 0.04480007
🚀Target 2: 0.04513110
🛡️Trade management:
- Execution strategy: After reaching Target 1, reduce the position by 50% and move the stop-loss up to breakeven. If the price falls back to the entry lev
ZEREBRO12.36%
DOS-15.59%
View Original
post-image
  • Reward
  • Comment
  • Repost
  • Share
#股票交易分享挑战 U.S. Stocks Weekly: Range-Bound Trading
🌍Macroeconomic Indicators
· U.S. stocks rose for two consecutive weeks in early August, with the S&P 500 gaining 3.95% month-to-date, breaking the seasonal pattern of usually consolidating or deleveraging in the first half of August.
· The exception stemmed from the fact that the market had already declined once in July, with the technology sector undergoing severe deleveraging and a deep sell-off. Upward revisions to corporate earnings expectations and the retreat in U.S. Treasury yields from their highs jointly drove the violent recovery in
NVDA-0.08%
View Original
post-image
ThisIsTranslateContent:
#股票交易分享挑战 US Stocks Weekly: Range-Bound Trading
🌍Macro Indicators
· U.S. stocks rose consecutively during the first two weeks of August, with the S&P 500 up 3.95% month-to-date, breaking the seasonal pattern of usually consolidating or deleveraging in the first half of August.
· The exception stems from the sell-off that had already occurred in July: the technology sector underwent intense deleveraging and a deep decline, while upward revisions to corporate earnings expectations and the retreat of U.S. Treasury yields from their highs jointly drove the sharp recovery in early August.
· After both CPI and PPI came in soft and July nonfarm payroll growth cooled, Treasury yields fell, and money markets have fully priced out the possibility of a September rate hike.
· The 2-year yield has fallen faster than the long end: persistent fiscal deficits, increasing bond supply, including corporate bonds issued for AI infrastructure, and uncertainty surrounding Fed policy and White House policies ahead of the midterm elections have led traders to demand higher compensation for longer duration.
· The 10-year yield may therefore remain elevated, putting pressure on U.S. equity valuations and limiting the index’s upside.
💰Fund Flows
· The August rebound was led by institutional capital, with positions highly concentrated in leading names with the greatest earnings certainty; this was structural rotation rather than a broad-based rally.
· Compared with April through July, liquidity was extremely abundant at the time, and capital engaged in indiscriminate, beta-driven buying. Leading and mid-tier names surged in tandem, while leveraged funds deployed broadly.
· After the severe deleveraging in July, investors were badly weakened: retail investors suffered losses to their principal and had less deployable capital, while South Korean regulators tightened overseas high-leverage and derivatives channels. The AI supply chain objectively lost its previous most aggressive retail and leveraged drivers.
· Although the market has begun to add leverage again, risk appetite and the position structure have narrowed sharply, with market participants clearly more cautious and selective.
· The strong momentum in the first half of August relied to a considerable extent on buildup and front-running ahead of Nvidia’s earnings report.
📈Sector Performance
· The Philadelphia Semiconductor Index will likely face resistance in the 12400 to 12600 range in the short term and trade sideways at elevated levels.
· Before Nvidia’s earnings report on August 26, institutional capital appears unwilling to recklessly add leverage and forcefully break through this resistance zone.
· Sector sentiment has improved significantly since the August rebound. Investors are once again willing to pay for AI infrastructure and have also begun adding leverage again.
· However, compared with the broad-based, leverage-driven rally before July, the market since August has shown clear position divergence and rotational gains.
· The fundamental logic of AI infrastructure and commercial monetization has not been disproven; a consolidation pullback is not a reason to turn bearish on the core theme.
⭐Key Stocks
· Nvidia (NVDA) will release its earnings report on August 26, the biggest variable for the remainder of this month.
· The stock price began falling after each of the previous earnings reports, and the market fears a repeat of that pattern. This is the main source of selling pressure ahead of the report.
· If the stock continues rising one-way before the earnings report without pulling back early to digest fear, fully pricing in the positive expectations, it may face extremely strong profit-taking pressure afterward regardless of whether the earnings are good or bad.
📰Earnings Season
· Nvidia (NVDA)’s earnings report on August 26 is the endpoint of this round of pre-earnings buildup and a watershed moment for the direction.
· The risk window for the semiconductor sector’s second wave of deleveraging: as early as immediately after the earnings report and as late as around the September Labor Day holiday.
🎯Weekly Summary
· The index still has room to extend before the end of August. The 7900 to 7950 range above is a dense zone for Call sell orders, both attracting the index upward and serving as a ceiling; once the rubber band reaches this level, upward momentum will be largely exhausted.
· The 7650 to 7700 range below is an accumulation zone for put options, providing relatively strong downside support. The probability of breaking through 7900 and opening a one-way major uptrend, or falling below 7600 and triggering a sharp crash, is extremely low.
· Route one is to surge first and then pull back—buy the expectation, sell the fact: pre-earnings buildup and short-seller hesitation push the index toward 7900, funds front-run the move to lock in profits, and the index then pulls back after the earnings report.
· Route two is to pull back first and then rise: the market fears a repeat of the post-earnings decline, sells first to digest fear, and after positions are surrendered around 7700, funds use the earnings release to bottom-fish and drive the market higher again.
· The probabilities of the two paths are similar. In practice, do not bet on the path: near 7900, decisively reduce positions or add a trailing take-profit, and do not chase higher; near 7700 on a pullback, tactically trade for a rebound with a small position; treat all movement in between as noise.
· Strategically bullish on AI, tactically facing high volatility: keep core positions unchanged, lock in some profits at highs, accumulate in batches on golden dips, and concentrate on leading names with the highest certainty, while allocating correspondingly less to second- and third-tier names.$NVDA ‌.
repost-content-media
  • Reward
  • 2
  • Repost
  • Share
LittleGodOfWealthPlutus:
Wishing you prosperity and good luck! 😘
View More
$HSK Daily Post 68: Small Buy
HSK0.33%
View Original
post-image
  • Reward
  • Comment
  • Repost
  • Share
Bull-coming effect: Jinniu Chemical nears limit-up, as expected.
View Original
post-image
  • Reward
  • Comment
  • Repost
  • Share
8.17 ETH 1910-1920, open a light short position, targets 1880/1850
On the ETH 1H chart, after a rapid drop to 1852 earlier, clear buying support emerged, and the price has now moved back above 1880.
The short-term moving averages are beginning to turn upward, and the market has entered a recovery phase after the release of bearish pressure.
Pay close attention to the 1920-1930 resistance zone above. A breakout could create an opportunity to continue testing the 1950 area.
On the news front, the market continues to digest U.S. economic data and changes in interest rate cut expectations.
At the
ETH0.57%
View Original
post-image
  • Reward
  • 1
  • Repost
  • Share
AirTicket:
After ranging for so long, the next move up should break through. Still short?
$BTC Signal】1H bearish momentum expansion + depth imbalance, short-term shorting
$BTC 1H MACD histogram -25.73, with bearish momentum accelerating. RSI 1H 35.38, bid-depth imbalance -21.31%, with selling pressure dominant. Price is trading below EMA20, while the 4H Bollinger Bands have narrowed to 63204-62753, compressing the window for a trend change. OI is stable, the funding rate is 0.0040%, and there are no signs of a short squeeze. Order-book liquidity is thin, with limited support.
🎯@Direction: Short (short)
⚡@Entry/Limit order: 62806.185 - 62859.600
🛑@Stop-loss: 63488.196
🚀@Target
BTC0.26%
DOS-15.59%
SPYX0.09%
View Original
post-image
  • Reward
  • Comment
  • Repost
  • Share
Rising from Humble Beginnings: One of the “16-Character” Maxims: Don’t Take Every Path You See
#中国历史文化 #The Path for Ordinary People to Turn Their Lives Around
View Original
  • Reward
  • Comment
  • Repost
  • Share
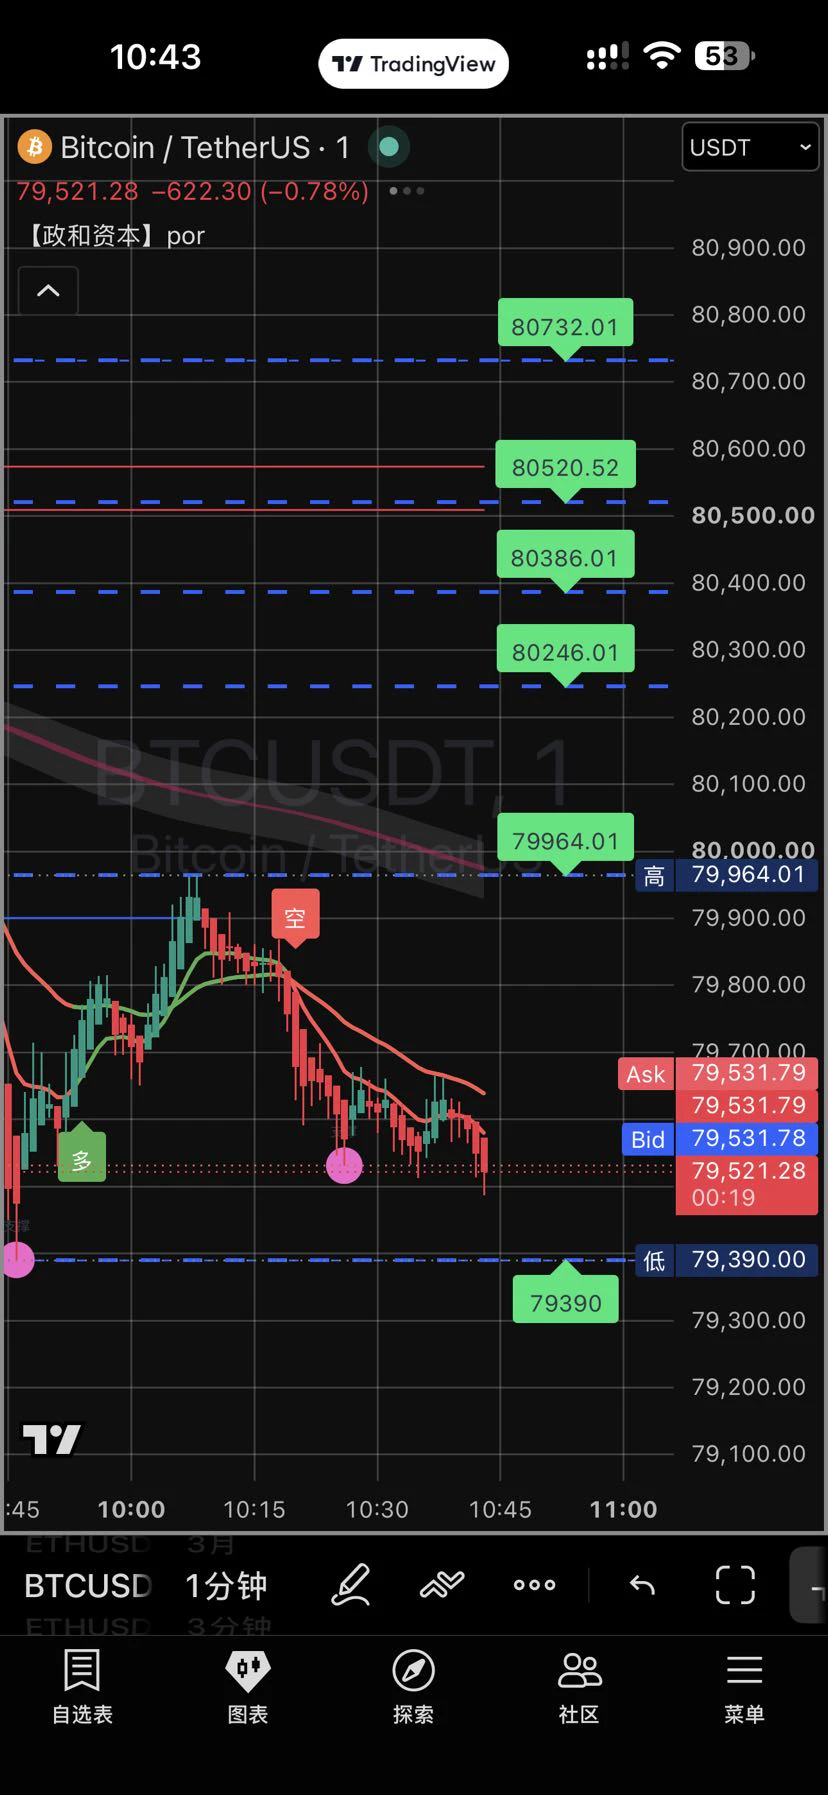
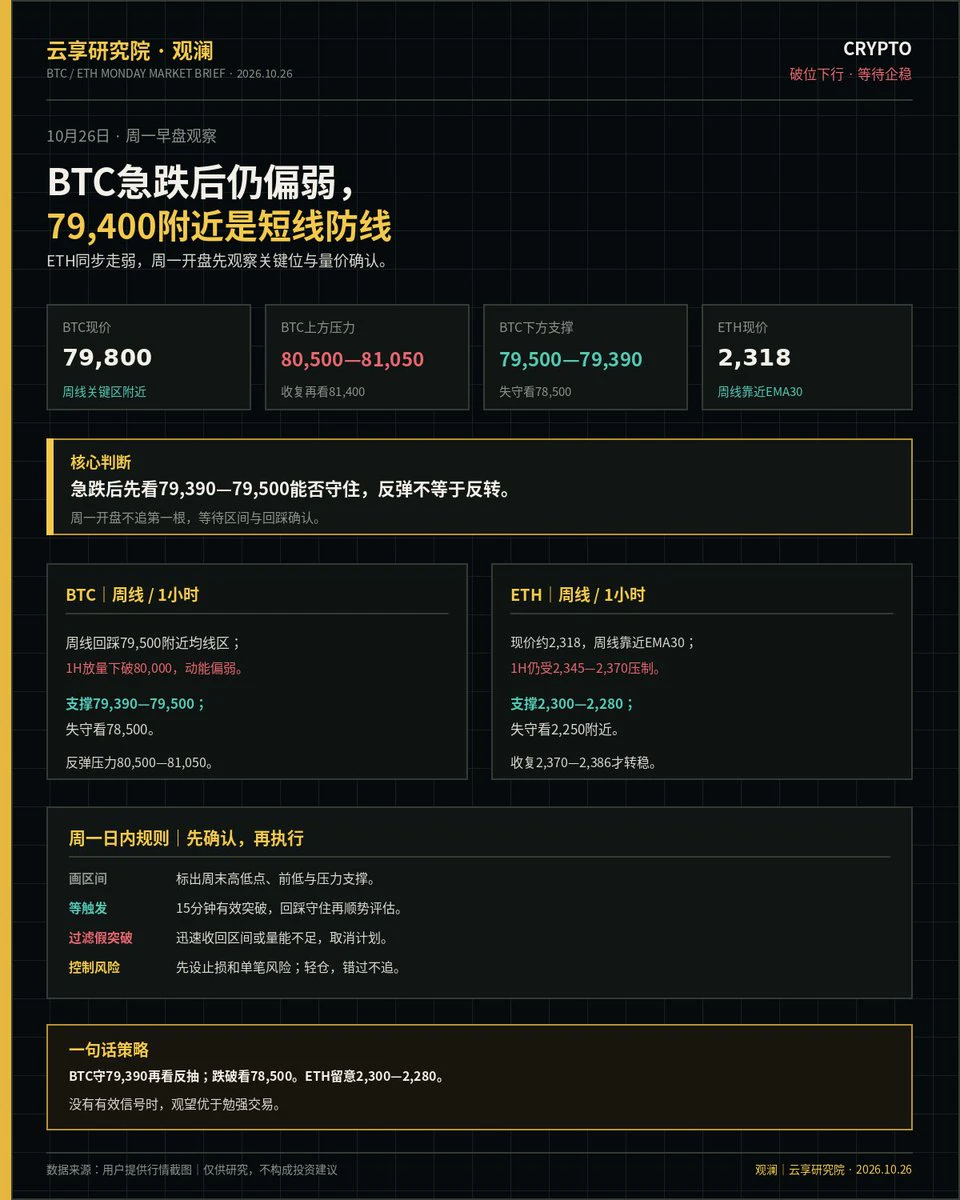
Bitcoin is showing a narrow-range, slightly weak consolidation pattern overall. After opening around 62,988 early this morning, it remained range-bound, then came under pressure and declined step by step during the Asian session, dipping to the 62,823 support area before making a slight rebound and recovery. It is currently trading around 63,050, with the day's volatility narrowing and bulls and bears in a short-term balance. Ethereum is highly correlated with Bitcoin's movement, also fluctuating under pressure below the short-term moving averages. Overall, it is consolidating within a narrow
BTC0.26%
ETH0.57%
View Original
post-image
  • Reward
  • Comment
  • Repost
  • Share
1.2 million views is worth $100,000 to me
1 View = $0.07 Profit
Now how can I scale to 10-20 million views?
post-image
  • Reward
  • Comment
  • Repost
  • Share
It’s Monday again—a fresh start to the week and a brand-new day, beginning with a KFC breakfast.
Following each other back on Blue V and making friends always attracts like-minded people. Let’s get ready for the new week and work hard together.
X creators simply keep repeating the process every day. Let’s keep going together.
View Original
post-image
  • Reward
  • Comment
  • Repost
  • Share
new market update
gate liveLIVE
1,062
  • Reward
  • Comment
  • Repost
  • Share
solana:9sfCHMLWSVy6MD6zr7pR1gD3qbT7C6K1E3dMf2ZBpump scam coin literally went 3x again
9sfCHMLWSVy6MD6zr7pR1gD3qbT7C6K1E3dMf2ZBpump
This thing is unstoppable
#crypto
SOL-0.27%
post-image
  • Reward
  • 1
  • Repost
  • Share
VANYA:
watching clossing
Gold Special: Trading Strategy
GLDX-0.19%
PAXG0.32%
XAU0.30%
View Original
post-image
post-image
  • Reward
  • Comment
  • Repost
  • Share
#股票交易分享挑战
Nvidia Takes Emergency Action! $250 Billion → Under $120 Billion—Is the AI Narrative Changing?
According to The Wall Street Journal, to ease investor concerns about the company’s risk exposure, AI chip giant Nvidia has significantly reduced the amount of its guarantees for OpenAI’s data centers. The revised financial guarantee has been cut from the original $250 billion to less than $120 billion.
  In addition, tech media outlet The Information reported that Nvidia plans to invest $3 billion in SB Energy, an energy company owned by SoftBank, to support the latter’s construction of a
NVDA-0.08%
View Original
post-image
  • Reward
  • 2
  • Repost
  • Share
HighAmbition:
Diamond Hands 💎
View More
Gold wins two straight intraday
Short at 4408, closed at 4400, 8 points, 1221🔪$XAUT
XAUT0.32%
View Original
post-image
  • Reward
  • Comment
  • Repost
  • Share
Load More

Join 40 M users in our growing community

⚡️ Join 40 M users in the crypto craze discussion
💬 Engage with your favorite top creators
👍 See what interests you
  • Pinned