Square
Following
Hot
News
Profile

SatoshiBro

vip
Active for: 0.3y
Peak Tier 0
No content yet
20
Following
553
Followers
1.8k
Liked
🔴 BTC MARKET UPDATE — LIVE AT 16:10
Bitcoin market analysis is going LIVE at 16:10.
Join me for a focused BTC Market Update where we’ll look at the current market structure, key support and resistance levels, price action, momentum, and the important zones traders should be watching next.
📊 Topic: BTC Market Update
⏰ Live Time: 16:10
🎥 Live Session: Blackout Hawk CryptoBoy
I’ll be sharing the latest BTC setup and discussing what the current price action could mean for the next market move.
🔗 Join the LIVE:
https://gate.com/live/video/e85d9480386845d8a01f7cce667e394b?type=live&stream_id=e85
BlackoutHawkCryptoBoy
🔴 BTC MARKET UPDATE — LIVE AT 16:10
Bitcoin market analysis is going LIVE at 16:10.
Join me for a focused BTC Market Update where we’ll look at the current market structure, key support and resistance levels, price action, momentum, and the important zones traders should be watching next.
📊 Topic: BTC Market Update
⏰ Live Time: 16:10
🎥 Live Session: Blackout Hawk CryptoBoy
I’ll be sharing the latest BTC setup and discussing what the current price action could mean for the next market move.
🔗 Join the LIVE:
https://gate.com/live/video/e85d9480386845d8a01f7cce667e394b?type=live&stream_id=e85d9480386845d8a01f7cce667e394b&session_id=e85d9480386845d8a01f7cce667e394b-1790679911&ref=VFBHUV8LVQ&ref_type=104
16:10 — See you LIVE. 🚀
repost-content-media
BTC+1.35%
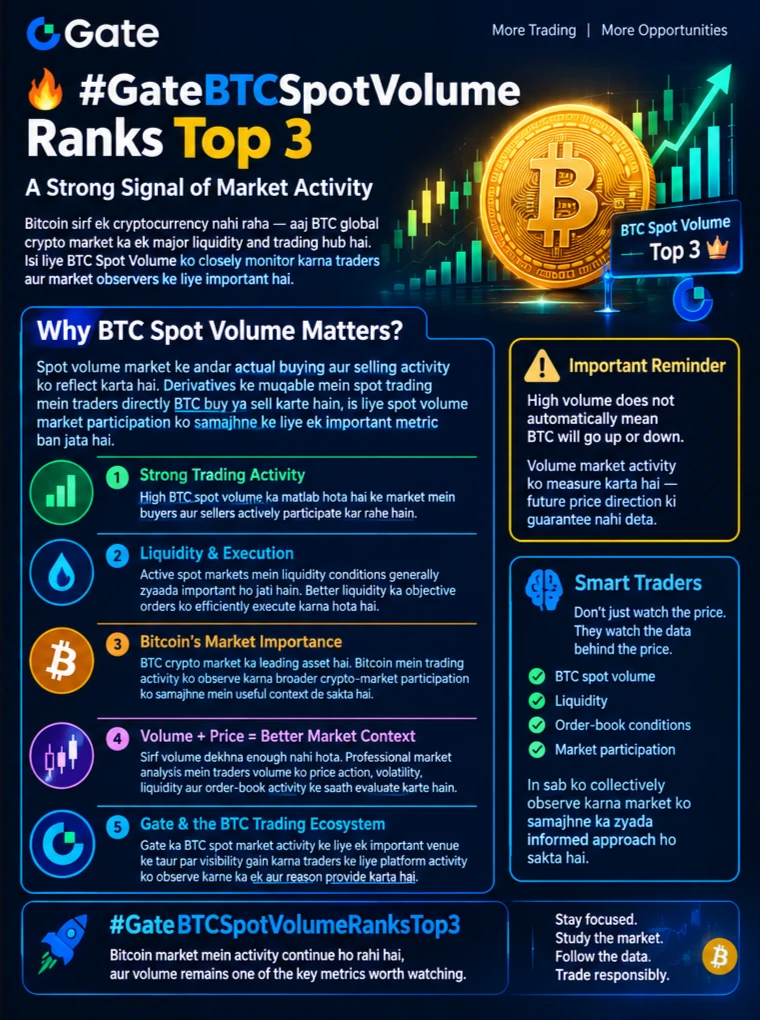
#GateBTCSpotVolumeRanksTop3 🔥 — A Strong Signal of Market Activity
Bitcoin is no longer just another cryptocurrency — BTC has evolved into one of the most important assets in the global crypto market, serving as a major center of liquidity, trading activity, and market participation.
That is why BTC Spot Volume is an important metric for traders and market observers to monitor.
When spot-market activity increases, it can provide valuable insight into market participation, liquidity, trading interest, and overall market activity. Gate’s BTC spot trading volume ranking in the Top 3 highlights
ZioX
#GateBTCSpotVolumeRanksTop3 🔥 — A Strong Signal of Market Activity
Bitcoin is no longer just another cryptocurrency — BTC has evolved into one of the most important assets in the global crypto market, serving as a major center of liquidity, trading activity, and market participation.
That is why BTC Spot Volume is an important metric for traders and market observers to monitor.
When spot-market activity increases, it can provide valuable insight into market participation, liquidity, trading interest, and overall market activity. Gate’s BTC spot trading volume ranking in the Top 3 highlights the significant level of attention and activity surrounding Bitcoin trading on the platform.
📊 Why Does BTC Spot Volume Matter?
Spot volume reflects actual buying and selling activity in the spot market. Unlike derivatives trading, spot trading involves the direct purchase and sale of the underlying asset. This makes spot-volume data an important piece of information when analyzing market participation.
💎 1. Strong Trading Activity
Higher BTC spot volume indicates that buyers and sellers are actively participating in the market.
Increased activity can provide traders with useful information about how much attention Bitcoin is receiving and how actively the market is being traded.
⚡ 2. Liquidity & Execution
Liquidity is another important factor in any active trading market.
A market with stronger trading activity can offer more opportunities for efficient order execution, although actual execution depends on factors such as order-book depth, volatility, market conditions, and order size.
🌐 3. Bitcoin’s Importance in the Crypto Market
BTC remains a central asset within the broader cryptocurrency ecosystem.
Monitoring Bitcoin’s trading activity can therefore provide useful context when analyzing overall crypto-market participation and changes in trader interest.
📈 4. Volume + Price = Better Market Context
Volume should never be analyzed in isolation.
Experienced market participants often look at volume alongside:
• Price action
• Volatility
• Liquidity
• Order-book activity
• Market participation
• Short-term momentum
When trading activity changes significantly alongside price movements, it can provide additional context for understanding how market participants are behaving.
🔥 5. Gate & the BTC Trading Ecosystem
Gate’s position among the leading venues for BTC spot trading activity puts additional attention on the platform’s Bitcoin market.
A strong spot-volume ranking can highlight active participation and growing market attention, while also giving traders another data point to monitor when studying BTC market conditions.
However, one principle remains important:
High trading volume does NOT automatically mean that BTC will move higher or lower.
Volume measures market activity — it does not guarantee future price direction.
🧠 Smart traders don’t just watch the price. They watch the data behind the price.
BTC spot volume, liquidity, order-book conditions, price action, and market participation can collectively provide a more complete picture of current market activity.
And with , BTC spot trading activity on Gate is certainly a metric worth watching.
Bitcoin remains at the center of the crypto market.
Volume shows where the activity is.
Price shows where the market is moving.
Data helps put both into context.
🔥 Stay focused.
📊 Study the data.
📈 Follow the market activity.
₿ Trade responsibly.
#GateBTCSpotVolumeRanksTop3 #BTCShortTermPullback
repost-content-media
BTC+1.35%
  • 1
#GateIdleEarnAddsUSD1UpTo8.16APR
Gate has officially expanded Idle Earn by adding support for USD1, giving holders a flexible way to earn on idle balances without locking funds.
Starting September 23, 2026 at 06:00 UTC, eligible USD1 held in your Trading Account (Spot) or Futures Account can generate yield automatically after a one-click enable. The current base APR stands at 6.8%, with the potential to reach up to 8.16% for users who qualify for the boost.
How the Yield Is Structured
The 6.8% base APR is not paid entirely in USD1. It breaks down as:
1.5% base APR paid in USD1
5.3% bonus APR
ZioX
#GateIdleEarnAddsUSD1UpTo8.16APR
Gate has officially expanded Idle Earn by adding support for USD1, giving holders a flexible way to earn on idle balances without locking funds.
Starting September 23, 2026 at 06:00 UTC, eligible USD1 held in your Trading Account (Spot) or Futures Account can generate yield automatically after a one-click enable. The current base APR stands at 6.8%, with the potential to reach up to 8.16% for users who qualify for the boost.
How the Yield Is Structured
The 6.8% base APR is not paid entirely in USD1. It breaks down as:
1.5% base APR paid in USD1
5.3% bonus APR paid in WLFI
This campaign is co-launched by Gate and World Liberty Financial (WLFI). The actual APR is dynamic and adjusts daily according to the remaining monthly reward pool and the total platform-wide eligible USD1 holdings. Always check the live rate on the product page.
Unlock the Higher Rate with Futures Activity
Users who achieve at least 150,000 USD1 in futures trading volume over the past 30 days unlock a 1.2x APR boost. This can push the maximum advertised APR to 8.16%.
Key limits on the boost:
Applies to eligible USD1 holdings in the Futures Account
Maximum of 500,000 USD1 per user receives the boosted rate
Any amount above 500,000 USD1 continues to earn the standard 6.8% APR
Boosted rewards are distributed in WLFI
Futures trading volume, eligibility, and holding limits are determined by official platform calculations.
Flexibility Is the Core Advantage
Idle Earn does not require you to lock your USD1 or move it into a separate product. Your funds remain in the Trading or Futures Account and stay available for trading at any time. The system uses a daily average snapshot of eligible balances. Rewards are calculated based on that snapshot and automatically credited to your Spot Account on a T+1 basis — no manual claiming needed.
Important notes:
USD1 borrowed through lending pools is treated as non-owned and does not count toward eligible balance
Institutional/corporate verified accounts are currently not supported
If you have other earn products active on the same balance, the rules may prioritize Idle Earn for eligible amounts
Why This Matters for USD1 Holders
Many traders keep stablecoin balances idle while waiting for the next opportunity. Idle Earn turns that waiting capital into a productive position without sacrificing liquidity. You keep the ability to trade, while eligible balances generate daily yield under the campaign terms.
The combination of a competitive base rate, a clear path to a higher boosted rate through futures activity, and true no-lock flexibility makes this one of the more practical yield options currently available for USD1 on the platform.
Enable Idle Earn in one click under Earn → Idle Earn, hold eligible USD1 in your Spot or Futures Account, and let the system handle the rest. Review the official announcement and product terms for the latest rates, eligibility details, and any updates before participating.
Put your idle USD1 to work — without locking it away.#GateIdleEarnAddsUSD1UpTo8.16APR
repost-content-media
USD1+0.01%
WLFI-1.78%
#GateSquareMidAutumnReunion
#Arc生态热门代币波动加剧 #Gate广场中秋团圆局
The Arc ecosystem has seen a clear surge in attention since the mainnet launch, but the recent price action shows just how intense the volatility has become.
On September 17 we witnessed sharp corrections:
- ARGUS dropped over 40% within 12 hours
- LONG fell more than 70%
- COOL declined over 75%
These moves highlight a familiar pattern in newly hyped ecosystems — strong initial interest followed by aggressive profit-taking and speculative swings.
My take:
Arc’s long-term potential looks interesting because the mainnet launch success
ZioX
#GateSquareMidAutumnReunion
#Arc生态热门代币波动加剧 #Gate广场中秋团圆局
The Arc ecosystem has seen a clear surge in attention since the mainnet launch, but the recent price action shows just how intense the volatility has become.
On September 17 we witnessed sharp corrections:
- ARGUS dropped over 40% within 12 hours
- LONG fell more than 70%
- COOL declined over 75%
These moves highlight a familiar pattern in newly hyped ecosystems — strong initial interest followed by aggressive profit-taking and speculative swings.
My take:
Arc’s long-term potential looks interesting because the mainnet launch successfully drew attention and early activity. However, the current phase is still highly speculative. Tokens that rise this fast often correct just as sharply, especially when liquidity is still developing and real usage is limited.
I’m not rushing to “buy the dip” blindly. Before adding size, I want to see:
1. Whether real developer activity and user adoption continue after the hype
2. Clearer tokenomics and unlock schedules
3. Whether volume remains organic or stays purely speculative
In the short term, volatility is likely to continue. Those comfortable with high risk may find opportunities with carefully sized positions. For those focused on capital preservation, staying on the sidelines for now seems the more prudent approach.
The true test for Arc will be whether the ecosystem can maintain momentum and attract sustained usage after this wave of volatility settles.
What’s your view right now?
Are you looking to accumulate on dips, or are you waiting for clearer signs of stability?
Would love to hear different perspectives.
#ArcEcosystemHotTokensSeeIncreasedVolatility
repost-content-media
ARC-0.96%
ARGUS-6.04%
#USSeptemberCompositePMISurgesTo58.4
US September Composite PMI Surges to 58.4 — Fastest Growth in Over Five Years
S&P Global’s flash US Composite PMI jumped to 58.4 in September, up from 56.0 in August and well above expectations. This marks the strongest expansion in private-sector activity since July 2021 and the fourth consecutive month of accelerating growth.
Key details behind the number:
- Services PMI rose to 58.7 — the steepest increase in over five years
- Manufacturing PMI climbed to 57.0 — the strongest reading since 2022
- New orders accelerated sharply, driven mainly by dome
ZioX
#USSeptemberCompositePMISurgesTo58.4
US September Composite PMI Surges to 58.4 — Fastest Growth in Over Five Years
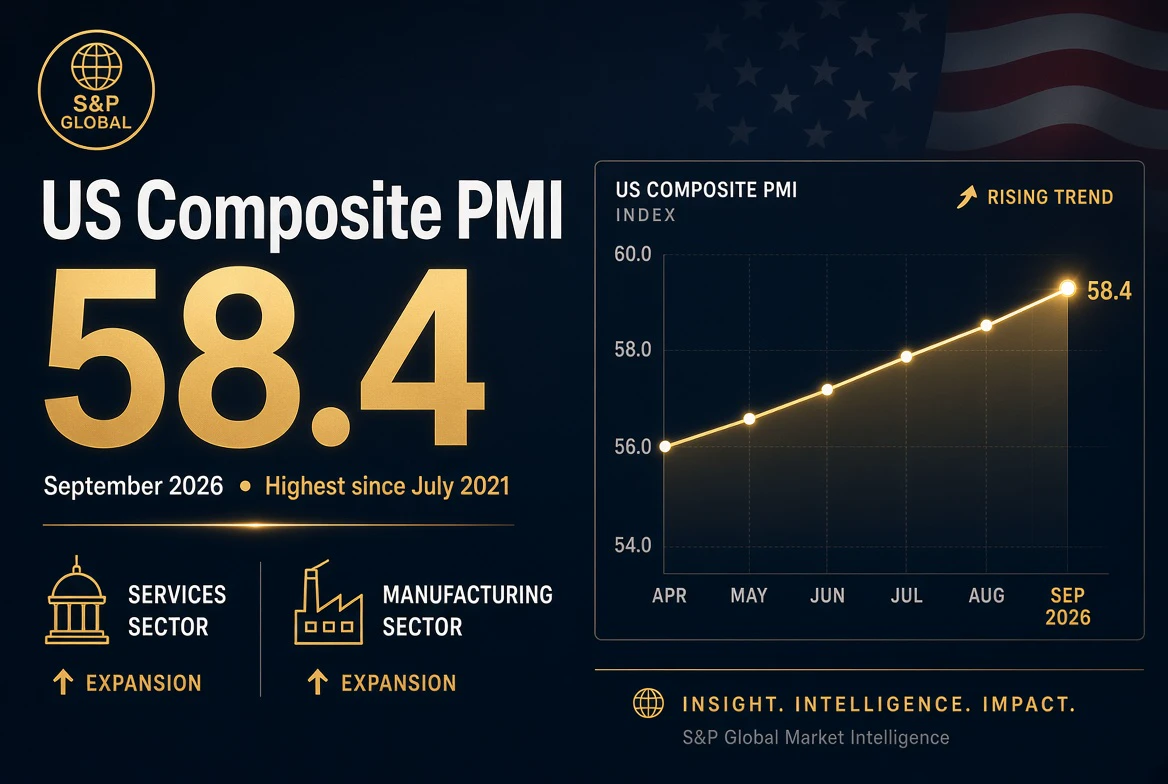
S&P Global’s flash US Composite PMI jumped to 58.4 in September, up from 56.0 in August and well above expectations. This marks the strongest expansion in private-sector activity since July 2021 and the fourth consecutive month of accelerating growth.
Key details behind the number:
- Services PMI rose to 58.7 — the steepest increase in over five years
- Manufacturing PMI climbed to 57.0 — the strongest reading since 2022
- New orders accelerated sharply, driven mainly by domestic demand
- Employment grew at the fastest pace in more than four years as companies hired to meet rising demand
On the surface, this is a clear signal of economic strength. Business activity is expanding at a pace consistent with around 5% annualized GDP growth.
However, the report also carries an important warning. Input costs surged to their highest level since October 2022, largely due to higher energy and transport prices. Backlogs of work increased at the sharpest rate in years, and supply-chain delays intensified. These factors point to growing capacity constraints and rising inflationary pressure.
In short: the US economy is running hot. Strong demand is supporting growth and job creation, but it is also feeding cost pressures that could complicate the Federal Reserve’s path.
Markets have already reacted — Treasury yields moved higher, the dollar strengthened, and gold came under pressure. The data reinforces the view that the economy remains resilient, but it also keeps the inflation risk firmly on the table.
Strong growth is welcome. Sustained price pressure is not. The coming months will show whether this momentum can continue without pushing inflation higher again.
What’s your read on this data? Growth story still intact, or early signs of overheating?#USSeptemberCompositePMISurgesTo58.4 #BTCShortTermPullback #GateBTCSpotVolumeRanksTop3
repost-content-media
#AltcoinsSeeSharpPullback
Altcoins are seeing sharp pullbacks, but calling this a full market crash misses the real story.
Bitcoin is holding near the mid-$80,000s and remains solidly higher on the week, while many speculative and meme tokens are facing much heavier selling pressure. This is less about broad risk-off and more about capital rotation and liquidity concentration.
What’s Actually Happening
Bitcoin continues to attract the majority of institutional and high-quality capital. Recent U.S. spot Bitcoin ETF inflows have been strong, with a multi-day streak adding billions, including on
ZioX
#AltcoinsSeeSharpPullback
Altcoins are seeing sharp pullbacks, but calling this a full market crash misses the real story.
Bitcoin is holding near the mid-$80,000s and remains solidly higher on the week, while many speculative and meme tokens are facing much heavier selling pressure. This is less about broad risk-off and more about capital rotation and liquidity concentration.
What’s Actually Happening
Bitcoin continues to attract the majority of institutional and high-quality capital. Recent U.S. spot Bitcoin ETF inflows have been strong, with a multi-day streak adding billions, including one of the largest single-day hauls of the year. That kind of sustained demand gives BTC a structural advantage most altcoins simply do not have.
At the same time, Bitcoin dominance remains elevated (high 50s), and the Altcoin Season Index has not yet reached the levels typically associated with broad altcoin leadership. Sentiment is still in greed territory, but participation is selective rather than widespread.
The result is a clear divergence:
BTC, and to a lesser extent ETH, SOL, and XRP, are showing relative strength.
Highly speculative and low-liquidity tokens are absorbing the majority of the selling.
Why This Matters
Institutional capital is concentrated
Spot Bitcoin ETFs and large funds have clear, regulated vehicles for BTC (and increasingly ETH). Thousands of smaller tokens compete for a much thinner pool of liquidity. When capital prefers safety and depth, altcoins feel it first.
Opportunity cost is real
Holding a sideways or declining altcoin while Bitcoin gains several percent in a week creates natural selling pressure. Traders rotate. Dominance rises. Alt/BTC pairs weaken.
Leverage + thin order books amplify moves
Speculative tokens often have shallower liquidity. When leveraged longs get forced out, the moves become exaggerated — 10-20% daily swings become common even if the broader market is only consolidating.
Supply events still matter
Token unlocks, vesting schedules, and rising circulating supply can add extra pressure exactly when demand is already selective.
Practical Takeaway
This is not automatically the end of the cycle. Markets frequently rotate: Bitcoin leads, then large caps follow, and only later do speculative assets fully participate. But traders who treat every altcoin the same as Bitcoin are taking on very different risk profiles.
Focus on:
Whether BTC holds key support zones
Continued ETF demand
Market breadth (how many assets are actually rising with BTC)
Funding rates and open interest for signs of crowded leverage
Liquidity and upcoming unlocks on individual tokens
Strong Bitcoin does not guarantee strong altcoins in the short term. Liquidity flows first to depth and institutional access. Everything else is secondary until breadth improves.
The question is no longer just “Is crypto going up?”
It is “Where is the capital actually going?”
Right now, the answer is still heavily skewed toward Bitcoin and a handful of stronger large-cap names.
What’s your read — pure rotation, or early signs of broader weakness?
#GateSquareMidAutumnReunion
repost-content-media
BTC+1.35%
ETH+2.06%
SOL+1.05%
XRP+0.91%
MEME+0.83%
#CryptoStocksSlipBMNRDownOver4%
Crypto-related equities are showing clear pressure today, with BitMine Immersion Technologies (BMNR) standing out as one of the weaker performers.
BMNR shares are trading lower, with recent sessions showing declines in the 1.6%–4.5% range depending on the exact timeframe. The stock closed near the $27.50–$27.55 area after failing to hold higher levels, reflecting renewed sensitivity to Ethereum price action and broader risk sentiment in crypto equities.
Quick Market Snapshot
BMNR (BitMine Immersion Technologies): Down approximately 1.64%–1.7% in the latest sess
ZioX
#CryptoStocksSlipBMNRDownOver4%
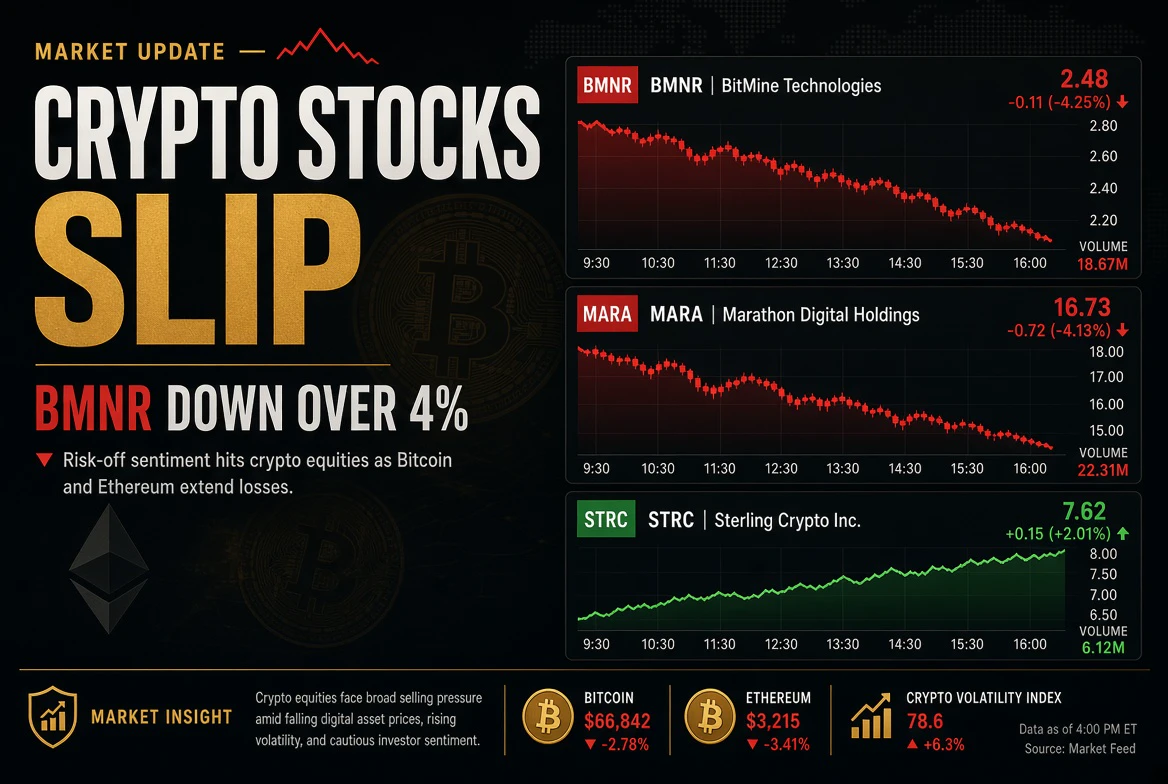
Crypto-related equities are showing clear pressure today, with BitMine Immersion Technologies (BMNR) standing out as one of the weaker performers.
BMNR shares are trading lower, with recent sessions showing declines in the 1.6%–4.5% range depending on the exact timeframe. The stock closed near the $27.50–$27.55 area after failing to hold higher levels, reflecting renewed sensitivity to Ethereum price action and broader risk sentiment in crypto equities.
Quick Market Snapshot
BMNR (BitMine Immersion Technologies): Down approximately 1.64%–1.7% in the latest session, with sharper intraday and previous-session moves exceeding 4% at times.
MARA (MARA Holdings): Down around 2.82%.
STRC (Strategy preferred): Relatively resilient, posting a modest +0.39%.
While Bitcoin has been holding relatively firm in the mid-$80,000s, crypto stocks — particularly those with heavy digital-asset treasury exposure — are experiencing a more pronounced pullback.
Why BMNR Is in Focus
BitMine Immersion Technologies has evolved into one of the purest large-scale Ethereum treasury vehicles in the public markets. Under Chairman Tom Lee, the company has aggressively accumulated ETH as part of its “Alchemy of 5%” strategy.
Latest reported holdings (as of mid-to-late September 2026):
Approximately 5.98 million ETH
Representing roughly 4.9% of Ethereum’s circulating supply
Total crypto + cash + “moonshot” investments valued around $17.1 billion
Majority of the ETH position is staked, generating meaningful yield
Because BMNR’s balance sheet is so heavily concentrated in Ethereum, the stock functions as a high-beta proxy for ETH. When Ethereum consolidates or faces selling pressure, BMNR typically amplifies the move — both to the upside and the downside. Recent sessions have reflected exactly that dynamic.
Broader Context for Crypto Stocks
The current softness in names like BMNR and MARA is not occurring in isolation. Crypto equities often decouple from spot Bitcoin in the short term for several reasons:
Treasury leverage effect — Companies holding large crypto balances on their balance sheets trade with higher volatility than the underlying assets.
Equity market risk appetite — When broader equity sentiment cools or yields rise, high-beta crypto stocks are often sold first.
Relative performance rotation — Capital has been selective. Bitcoin has attracted stronger institutional flows via ETFs, while some pure-play treasury and mining names have lagged.
Profit-taking after strong runs — Several crypto stocks delivered sharp gains earlier in the quarter; short-term digestion is common.
MARA, as a major Bitcoin miner, remains sensitive to both BTC price and hash-rate/energy cost dynamics. Its decline fits the pattern of miners underperforming during periods of consolidation. Meanwhile, Strategy’s preferred shares (STRC) have shown comparatively greater stability, highlighting how different capital structures within the same ecosystem can behave differently.
What Traders Should Watch Next
Ethereum’s ability to hold key support levels — this remains the primary driver for BMNR.
Continued Bitcoin ETF flow data and overall market breadth.
Whether crypto stocks begin to re-correlate more tightly with spot prices or continue diverging.
Broader equity market tone and Treasury yield movements, which influence risk appetite for high-volatility names.
Bottom Line
The current pullback in BMNR and other crypto stocks is a reminder that public-market vehicles tied to digital assets carry equity-market beta on top of crypto beta. Even when Bitcoin remains relatively stable, these stocks can experience sharper swings due to positioning, profit-taking, and shifts in risk sentiment.
BMNR’s large and growing Ethereum treasury gives it significant long-term leverage to any sustained ETH upside. In the near term, however, that same concentration means the stock will likely remain highly sensitive to every meaningful move in Ethereum and overall crypto risk appetite.
This is classic high-beta crypto equity behavior — opportunity and volatility arriving in the same package.
What’s your read on BMNR and the broader crypto stock complex right now? Buying the dip in treasury names, or waiting for clearer confirmation from ETH and market breadth?
#CryptoStocksSlipBMNRDownOver4% #GateSquareMidAutumnReunion
repost-content-media
BMNR-1.17%
MARA-5.75%
STRC+0.25%
ETH+2.06%
BTC+1.35%
#SanDiskJumps7.7%ToHighestSinceJuly
🚀 $SNDK Jumps +7.7%: Is NAND Flash Being Repriced as Critical AI Infrastructure?
The memory semiconductor sector is undergoing a profound structural evolution. SanDisk ($SNDK) is no longer viewed by institutional capital as a cyclical commodity manufacturer. Instead, Wall Street is increasingly pricing the company as a system-critical layer within the global AI infrastructure stack.
This paradigm shift recently propelled $SNDK up over 7% to its highest level since July, pushing its market capitalization to $276 Billion.
📊 3 Core Catalyst Drivers Behind th
ZioX
#SanDiskJumps7.7%ToHighestSinceJuly
🚀 $SNDK Jumps +7.7%: Is NAND Flash Being Repriced as Critical AI Infrastructure?
The memory semiconductor sector is undergoing a profound structural evolution. SanDisk ($SNDK) is no longer viewed by institutional capital as a cyclical commodity manufacturer. Instead, Wall Street is increasingly pricing the company as a system-critical layer within the global AI infrastructure stack.
This paradigm shift recently propelled $SNDK up over 7% to its highest level since July, pushing its market capitalization to $276 Billion.
📊 3 Core Catalyst Drivers Behind the Surge:
1️⃣ Trillion-Dollar AI Endorsement & $2,400 Price Target:
Rosenblatt Securities initiated coverage with a conviction "Buy" rating and a street-high $2,400 price target (~36% upside from prior close). Analyst Kevin Cassidy argues that data-heavy AI workloads have fundamentally shifted NAND flash from a boom-and-bust commodity into an indispensable layer of enterprise compute.
2️⃣ Unprecedented Financial & Margin Expansion:
* Q4 Fiscal 2026 Revenue: $8.97 Billion — a massive 372% YoY surge and 51% sequential growth.
* Gross Margins: Expanded to an astonishing 84.6% (up from 26.2% a year prior), reflecting pricing power typically reserved for monopolistic software platforms rather than hardware suppliers.
* Data Center Pivot: For the first time in history, enterprise data centers absorb over 50% of SanDisk’s total NAND output.
3️⃣ Contracted Order Book Locked Through 2027:
SanDisk has already pre-sold 50% of its current-year output and 66% of next year's capacity under multi-year agreements. These binding contracts establish explicit pricing floors and de-risk revenue projections well into 2027.
🛡️ Structural Moats: Supply Dominance & Capital Allocation:
🤝 $31 Billion Manufacturing Expansion with Kioxia:
SanDisk extended its long-standing flash memory joint venture with Kioxia through December 2034. Together, the partners committed $31 Billion in long-term capital expenditure toward Japanese manufacturing infrastructure to secure high-density 3D NAND wafer supply amid global lead-time tightening.
💰 $15.5 Billion Active Buyback Plan:
The board approved an additional $14 Billion share repurchase authorization, bringing remaining buyback funds to $15.5 Billion (~8.6% of outstanding float). Financed entirely by surging operating cash flows, this reduction in tradable shares tightens supply right as institutional index demand peaks.
🏛️ S&P 100 Index Inclusion Advantage:
SanDisk officially joined the S&P 100 Index on September 21 (replacing legacy industrials and consumer staples). This mechanical catalyst forces passive index-tracking funds to absorb large blocks of shares, reinforcing structural upward momentum.
📈 Key Variable & Technical Metrics to Monitor:
* NAND Contract Price Trends: Continued tightness supports 80%+ gross margins; any premature pricing softness remains the primary risk factor.
* Valuation Baseline: A trailing P/E of 25.6x demands flawless operational execution and sustained earnings momentum to justify continued multiple expansion.
* Macro Headwinds: Federal Reserve rate hikes continue to pose broad valuation gravity across tech equities, though $SNDK’s robust cash generation offers a strong buffer.
🎯 Market Outlook & Discussion:
* Do you believe the structural AI NAND shortage will persist past 2026, or will incoming manufacturing capacity normalize margins?
* Will $SNDK reach the $2,400 institutional target before the end of the fiscal year?
Drop your deep analysis, position plans, and price targets in the comments below! 👇
#SanDiskJumps7.7%ToHighestSinceJuly $SNDK $MU ‌
#AIInfrastructure #NANDFlash #GateSquare
SNDK+0.58%
SPX+7.94%
MU+0.19%
#GateEuropeAchievesPCIDSSLevel1Certification 🚀 Gate Europe Achieves the Highest Standard in Payment Security: PCI DSS Level 1 Certification
In an industry where trust is everything, Gate Europe has just raised the bar.
On September 15, 2026, Gate Europe successfully passed the PCI DSS v4.0.1 Level 1 compliance assessment — the highest and most rigorous level of payment card data security certification available. This independent, third-party validation covers Gate Connect, Gate Card, and all related systems, delivering a powerful confirmation of institutional-grade protection for every paymen
ZioX
#GateEuropeAchievesPCIDSSLevel1Certification 🚀 Gate Europe Achieves the Highest Standard in Payment Security: PCI DSS Level 1 Certification
In an industry where trust is everything, Gate Europe has just raised the bar.
On September 15, 2026, Gate Europe successfully passed the PCI DSS v4.0.1 Level 1 compliance assessment — the highest and most rigorous level of payment card data security certification available. This independent, third-party validation covers Gate Connect, Gate Card, and all related systems, delivering a powerful confirmation of institutional-grade protection for every payment transaction across Europe.
Why This Matters
PCI DSS Level 1 is not a basic checklist. It is the gold standard required of the largest and most security-conscious payment processors in the world. Achieving it means Gate Europe has proven, under strict external audit, that it meets the most demanding requirements for:
Advanced encryption and data protection
Continuous monitoring and threat detection
Strict access controls and vulnerability management
Full compliance with the latest PCI DSS v4.0.1 framework
This certification is a clear statement: user payment data is protected at the highest possible level.
What It Means for You
✅ Stronger protection for every card transaction through Gate Connect and Gate Card
✅ Independent third-party validation — not just internal claims
✅ Enhanced trust for European users and partners who demand real security
✅ Future-ready infrastructure built to the strictest global payment standards
In a market full of noise, real security is measured by independent certification — not marketing slogans. Gate Europe has now formally joined the ranks of institutions that meet the absolute highest bar for payment card data protection.
This is more than a compliance milestone.
It is a commitment to safety, transparency, and long-term user trust.
Your turn:
How important is independent security certification when you choose a platform for payments and card services?
Does Level 1 PCI DSS compliance influence your confidence in using Gate Card or Gate Connect?
Drop your thoughts below. 👇
#GateEurope #Level1Certification #GateCard #GateConnect @GateSquare
#ZECBreaks1650ToNewHigh 🚀 Zcash ($ZEC ) Shatters $1,650 — Is This the Defining Privacy Coin Revival of the Decade?
Zcash has just done what few large-cap assets manage in a single cycle: it has broken decisively above $1,650, printed a fresh all-time high, and forced the market to reprice an entire narrative.
What started as a clean technical breakout from multi-year consolidation has rapidly evolved into a full structural re-rating. ZEC has moved from the periphery of the top 100 straight into the conversation of the top 10 global crypto assets by market capitalization in 2026 — a shift drive
ZioX
#ZECBreaks1650ToNewHigh 🚀 Zcash ($ZEC ) Shatters $1,650 — Is This the Defining Privacy Coin Revival of the Decade?
Zcash has just done what few large-cap assets manage in a single cycle: it has broken decisively above $1,650, printed a fresh all-time high, and forced the market to reprice an entire narrative.
What started as a clean technical breakout from multi-year consolidation has rapidly evolved into a full structural re-rating. ZEC has moved from the periphery of the top 100 straight into the conversation of the top 10 global crypto assets by market capitalization in 2026 — a shift driven by institutional capital, regulatory clarity, and genuine on-chain demand.
This is no longer a speculative bounce.
This is a fundamental repricing of privacy as an investable asset class.
🔥 The Core Drivers Behind the $1,650+ Expansion
1. Institutional Capital Is Now Fully Unlocked
The launch of Grayscale’s Spot Zcash ETF ($ZCSH) on NYSE Arca opened the floodgates for regulated U.S. capital. Hundreds of millions in cumulative net inflows followed. Shortly after, 21Shares listed the first physically backed Zcash ETP (ticker: ZCASH) on Euronext — giving European institutions direct, custody-free exposure. Traditional funds no longer need to navigate private wallets or OTC desks. Compliant access is live, and the capital is flowing.
2. The Regulatory Overhang Has Been Removed
For years Zcash carried a persistent “privacy discount.” That cloud has lifted. The formal conclusion of long-standing regulatory inquiries without enforcement action earlier this year acted as a powerful de-risking event. Institutional allocators who previously sat on the sidelines now have the green light to build meaningful, long-term positions.
3. Real Supply Shock Meets Record Shielded Adoption
Zero-knowledge technology is no longer theoretical. Shielded transactions now represent over 58% of total network activity. A growing share of circulating supply is being permanently absorbed into z-addresses, steadily reducing liquid float at the exact moment spot demand is hitting all-time highs. This is a classic supply-side squeeze — and it is accelerating.
4. Derivatives Forced the Acceleration
Elevated open interest and heavy short positioning created the perfect conditions for cascading liquidations. As price punched through $1,600 and then $1,650, forced short covering fed directly into aggressive spot buying, turning a breakout into a vertical expansion.
📈 Key Levels to Watch Right Now
Immediate Support Zone: $1,570 – $1,600 (former resistance now turning into structural demand)
Critical Macro Floor: $1,500 (the level bulls must defend for the larger trend to remain intact)
Upside Expansion Targets:
– $1,800 (next logical measured move)
– $2,100+ (macro Fibonacci extension if institutional inflows continue)
🎯 The Bigger Picture
Zcash is no longer just “another privacy coin.”
It is becoming the first privacy-focused large-cap asset to receive genuine institutional infrastructure, regulatory clarity, and measurable on-chain adoption at the same time.
The market is starting to price privacy not as a niche feature, but as a core monetary property.
Your move:
Do you expect ZEC to drive straight toward the $1,800–$2,000 zone, or will we see a healthy retest of the $1,570 support first?
Are you riding the breakout momentum or waiting to accumulate on pullbacks?
Drop your targets, setups, and position plans below. Let’s discuss. 👇
#ZECBreaks1650ToNewHigh #Zcash $ZEC ‌ @GateSquare
ZEC+3.58%
#GateRanks6thAmongGlobalCEX 🏆 Gate Climbs to 6th Among Global CEXs — But the Real Story Goes Far Beyond Rankings
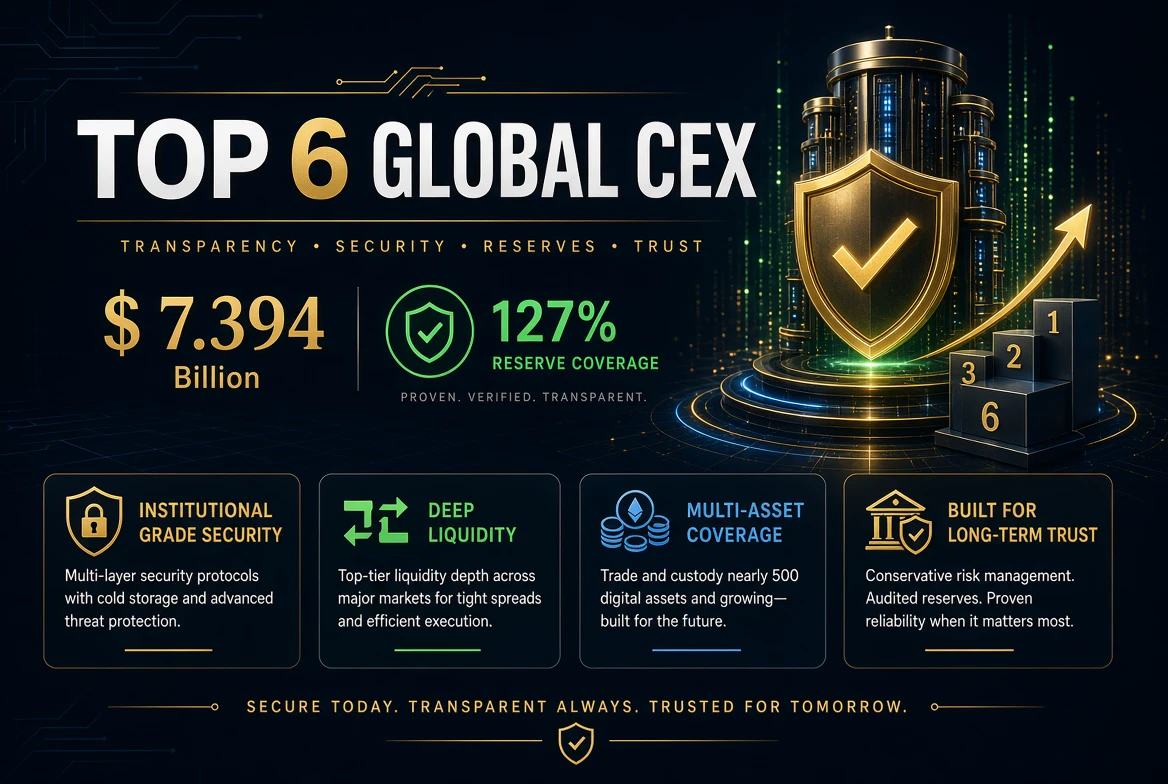
According to the latest DefiLlama data, Gate’s platform assets have surpassed $7.394 billion, officially placing it among the top 6 centralized exchanges worldwide by asset scale.
That number is impressive.
But what matters far more is what sits underneath it.
Gate is currently maintaining a 127% reserve coverage ratio — significantly above the 100% safety threshold — while protecting nearly 500 different user assets. In an industry where trust is earned slowly and lost instantly,
ZioX
#GateRanks6thAmongGlobalCEX 🏆 Gate Climbs to 6th Among Global CEXs — But the Real Story Goes Far Beyond Rankings
According to the latest DefiLlama data, Gate’s platform assets have surpassed $7.394 billion, officially placing it among the top 6 centralized exchanges worldwide by asset scale.
That number is impressive.
But what matters far more is what sits underneath it.
Gate is currently maintaining a 127% reserve coverage ratio — significantly above the 100% safety threshold — while protecting nearly 500 different user assets. In an industry where trust is earned slowly and lost instantly, this combination of size, over-collateralization, and broad asset coverage sends a clear signal: the platform is built for durability, not just temporary ranking climbs.
Why This Moment Matters
Rankings fluctuate. Market conditions shift. New competitors appear.
What remains constant for serious traders and long-term users is a short list of non-negotiable factors:
Asset security & transparent reserves
Deep liquidity that can handle real volume
A wide selection of tradeable assets and opportunities
The platform’s ability to stay strong through multiple market cycles
Gate’s latest figures address all four.
A 127% reserve ratio is not a marketing claim — it is a measurable buffer. Coverage across nearly 500 assets demonstrates operational breadth. And a top-6 global ranking by asset scale confirms that user capital is already voting with size.
Scale is the visible result.
Long-term trust is the actual product.
The Deeper Question for Every Trader
When you choose an exchange, what actually decides it for you?
🛡️ Asset security and proof of reserves
💧 Liquidity depth and execution quality
🔥 Token selection and trading opportunities
👀 Long-term platform strength and resilience
There is no single correct answer — but the platforms that win over time are the ones that refuse to compromise on any of them.
Gate’s current position is not just about climbing a leaderboard.
It is about building the kind of foundation that keeps users confident when markets get noisy.
Your turn:
Which of the four factors above carries the most weight in your decision?
Is reserve strength more important than liquidity, or do you prioritize opportunity and long-term stability?
Share your ranking and the metrics you watch most closely. Let’s discuss. 👇
#Gate资产规模全球CEX第六 #TradingPlatform @GateSquare
repost-content-media
#USIranMeetToDiscussHormuzReopening🔥 Talks in New York Mark the First Real Test of the Hormuz Standoff
There is a rare kind of signal that appears when two adversaries who have spent months exchanging military pressure across one of the world’s most critical energy chokepoints finally sit in the same room. That signal arrived on Tuesday in New York.
On the sidelines of the United Nations General Assembly, US special envoy Steve Witkoff and Iranian Foreign Minister Abbas Araghchi held their first publicly acknowledged meeting since June. The three-hour discussion was described by President Tru
ZioX
#USIranMeetToDiscussHormuzReopening🔥 Talks in New York Mark the First Real Test of the Hormuz Standoff
There is a rare kind of signal that appears when two adversaries who have spent months exchanging military pressure across one of the world’s most critical energy chokepoints finally sit in the same room. That signal arrived on Tuesday in New York.
On the sidelines of the United Nations General Assembly, US special envoy Steve Witkoff and Iranian Foreign Minister Abbas Araghchi held their first publicly acknowledged meeting since June. The three-hour discussion was described by President Trump as “very good and productive.” No final agreement was reached — but the mere fact that the two sides transmitted positions face-to-face has already begun to reshape market pricing across oil and digital assets.
What Was Actually Said
According to Iranian state media and a senior official who spoke to Reuters, Tehran delivered a clear set of “decisive positions” for any reopening of the Strait of Hormuz:
Immediate lifting of the US naval blockade
Unfreezing of Iranian assets held abroad
An end to hostilities across the region
The same official stated that Iran could reopen the maritime route within seven days if Washington scaled back military action and lifted the blockade on Iranian ports. The conditions are substantial. They would require the United States to reverse several of the pressure tools it has deployed this year. Washington, for its part, continues to demand that Tehran abandon its nuclear ambitions and cease support for regional militant groups. The gap remains wide — but the conversation has begun.
The Scale of the Disruption
The Strait of Hormuz normally carries roughly one-fifth of global oil supply. Since the US naval blockade was imposed, the waterway has been effectively closed to commercial traffic. As of September 10, US Central Command reported that its forces had redirected 96 commercial vessels attempting to transit the strait. Iran responded by declaring a no-go zone extending from the blockade line into the Persian Gulf, and Revolutionary Guard units attacked multiple ships that tried to pass. Daily vessel transits collapsed from approximately 130 before the conflict to around 20.
The economic cost has been immediate and measurable.
Market Reaction: Oil and Bitcoin Diverge
Brent crude, which had been elevated by the geopolitical risk premium, settled near $99 a barrel on Tuesday and extended losses into Wednesday, sliding toward $98.45. West Texas Intermediate dropped below $90 after losing more than 10% over the previous five sessions. Two forces are driving the decline simultaneously:
1. The diplomatic signal itself has begun to reduce the risk premium that markets had priced into oil since the blockade began.
2. Alternative supply routes are already being activated. Saudi Arabia is offering crude loadings through ship-to-ship transfers off Oman’s Sohar port — a route that completely bypasses Hormuz — and the kingdom’s East-West pipeline to the Red Sea is expected to see partial restoration.
Bitcoin’s reaction has been more measured and, in many ways, more revealing. The asset climbed approximately 6% in the days leading into the talks, touching a high near $87,000 before consolidating around $86,200 as the meeting concluded. That consolidation is informative. Bitcoin has traded increasingly as a geopolitical safe-haven in recent months, with its correlation to gold strengthening as tensions escalated. The reduction in immediate conflict risk has lowered the urgency of that hedge — yet price has held its gains rather than reversing. This suggests the broader institutional bid remains intact and is not solely dependent on the Hormuz premium.
What Comes Next
The talks are expected to resume in the near future. A second meeting that produces further progress would likely allow the oil market to price out a larger portion of the remaining risk premium. Conversely, any breakdown would quickly re-inject volatility into energy markets and could re-ignite Bitcoin’s safe-haven bid.
Three variables now matter most:
Confirmation and substance of the next round of talks
The speed and scale of Saudi alternative supply via Sohar transfers and the East-West pipeline
Bitcoin’s ability to defend the $85,000 support zone — a level that, if held, would reinforce the view that the institutional bid is structural rather than purely conflict-driven
The diplomatic window is open.
Whether it widens into a durable de-escalation or closes under the weight of unresolved demands will shape the trajectory of both oil and digital assets in the weeks ahead.
#USIranMeetToDiscussHormuzReopening #Geopolitics @GateSquare
DYOR 🔎
repost-content-media
BTC+1.35%
#UNIBreaks10ToNewHigh
🚀 $UNI , NEAR, andBTC Push Into Key Supply Zones After Squeeze
Following a massive short squeeze across top-tier liquid assets, the market is presenting a textbook structural test. Uniswap ($UNI) has officially breached the $10 threshold to print a new local high, while NEAR Protocol ($NEAR) and Bitcoin ($BTC ) are simultaneously pressing into major overhead resistance.
While superficial market sentiment appears overwhelmingly bullish, smart money is focused on one question: Is this the beginning of a sustained trend continuation, or an engineered liquidity sweep into sup
ZioX
#UNIBreaks10ToNewHigh
🚀 $UNI , NEAR, andBTC Push Into Key Supply Zones After Squeeze
Following a massive short squeeze across top-tier liquid assets, the market is presenting a textbook structural test. Uniswap ($UNI) has officially breached the $10 threshold to print a new local high, while NEAR Protocol ($NEAR) and Bitcoin ($BTC ) are simultaneously pressing into major overhead resistance.
While superficial market sentiment appears overwhelmingly bullish, smart money is focused on one question: Is this the beginning of a sustained trend continuation, or an engineered liquidity sweep into supply?
📊 Deep Dive into the Trio: Structural Analysis & Key Levels
1️⃣ Uniswap ($UNI) — The $10 Breakout & DeFi Revival:
* Macro Driver: UNI’s surge past $10 comes amid accelerating protocol revenue parameters, Unichain ecosystem adoption, and rising DEX volume market share relative to centralized venues.
* Key Supply Zone: $10.20 – $10.80 (Historical distribution zone and previous macro swing high).
* Support Floor: $9.30 – $9.50 (Former resistance now flipping into critical demand).
2️⃣ NEAR Protocol ($NEAR) — AI & Chain Abstraction Momentum:
* Macro Driver: Strong relative performance driven by expanding user metrics in Chain Abstraction and AI-integrated smart contract activity.
* Key Supply Zone: $5.40 – $5.70 (Heavy multi-touch supply shelf that previously triggered multi-week corrections).
* Support Floor: $4.65 – $4.80 (Structural breakout base).
3️⃣ Bitcoin ($BTC) — The Market Anchor:
* Macro Driver: Institutional ETF inflows and short liquidations pushed BTC into major overhead supply, setting the tone for the entire altcoin market.
* Key Supply Zone: Major psychological and technical resistance zone where previous breakout attempts faced sharp rejections.
* Support Floor: Previous breakout consolidation range acting as the primary line of defense for macro bulls.
⚠️ Why Coordinated Resistance Testing Escalates Systemic Risk
When high-beta market leaders ($UNI, $NEAR) and the benchmark asset ($BTC) retest major supply zones simultaneously, market correlation spikes.
* The Risk of Coordinated Liquidation: A failed breakout on BTC rarely leaves altcoins unharmed. If Bitcoin encounters a high-volume rejection at resistance, leveraged long positions in UNI andNEAR risk rapid, cascading unwinds as liquidity drains across the board.
* Volume Exhaustion vs. True Absorption: Continued higher high closes backed by expanding spot volume signal true supply absorption. Conversely, long upper wicks or declining volume on new highs indicate buyer exhaustion and an impending bull trap.
💡 Execution Framework: How to Play This Setup
* Rule 1: Confirmation Over Anticipation: Avoid front-running breakouts. Wait for a daily close above resistance with solid volume before positioning for continuation.
* Rule 2: Monitor SFP (Swing Failure Patterns): Look out for wicks above $10 on UNI or key levels on BTC/NEAR that quickly close back inside the prior range. SFPs are prime signals for mean-reversion trades.
* Rule 3: Manage Risk & Position Sizing: In high-volatility, post-squeeze environments, leverage must be strictly controlled to withstand liquidity sweeps.
🎯 Join the Discussion:
* Do you expect $UNI to hold above $10 and target the $12+ zone, or are we due for a market-wide cooldown first?
* Which asset in this trio exhibits the strongest relative strength on your charts?
Share your price targets, chart setups, and risk management strategies in the comments below! 👇
#UNIBreaks10ToNewHigh #Uniswap #NEAR #Bitcoin @GateSquare
UNI+2.31%
BTC+1.35%
#UNIBreaks10ToNewHigh $UNI , $NEAR, $BTC — Running Into Resistance After the Squeeze
Three names that just delivered sharp rebounds are now pressing into clear supply zones: Uniswap ($UNI), NEAR Protocol ($NEAR), and Bitcoin ($BTC).
This is classic post-squeeze behavior. Price looks strong on the surface, volume expands, short liquidations fuel the move — and then the market meets the next meaningful resistance. What happens next usually separates temporary relief rallies from genuine trend continuation.
Why This Setup Matters Right Now
After a squeeze, the path of least resistance is higher un
ZioX
#UNIBreaks10ToNewHigh $UNI , $NEAR, $BTC — Running Into Resistance After the Squeeze
Three names that just delivered sharp rebounds are now pressing into clear supply zones: Uniswap ($UNI), NEAR Protocol ($NEAR), and Bitcoin ($BTC).
This is classic post-squeeze behavior. Price looks strong on the surface, volume expands, short liquidations fuel the move — and then the market meets the next meaningful resistance. What happens next usually separates temporary relief rallies from genuine trend continuation.
Why This Setup Matters Right Now
After a squeeze, the path of least resistance is higher until price hits a zone where larger sellers are waiting. That is exactly where these three sit:
Bitcoin is testing a well-defined resistance area after its recent push. Historically, failed attempts at this level have led to multi-day pullbacks that drag the entire market lower.
UNI has reclaimed short-term structure but is now pressing into a zone that previously capped multiple advances. Volume behavior here will be critical.
NEAR followed a similar trajectory — sharp recovery, strong relative performance, and now approaching a supply shelf that has rejected price before.
When multiple large-cap names hit resistance at the same time, the risk of a coordinated unwind rises. Liquidity often rotates out of the group together rather than in isolation.
What to Watch Closely
1. Volume at the highs
Rising volume that holds or expands on new highs supports continuation. Declining volume or high-volume rejection candles at resistance is an early warning of exhaustion.
2. Failed breakout characteristics
A clean break and close above resistance with follow-through is constructive. A wick above resistance followed by a close back inside the range is the classic failed-breakout signal. These failures tend to travel as a group when correlation is elevated.
3. Relative strength within the trio
If one name starts underperforming while the others hold, it can act as an early tell for rotation or broader weakness.
4. Broader market context
Bitcoin still sets the tone. A decisive rejection on BTC often cascades into alts faster than most expect. Conversely, a clean breakout on BTC can give the others the fuel they need to clear their own levels.
The Practical Framework
This is not a call to short or long. It is a reminder of market structure:
Sharp rebounds after squeezes frequently run into the next supply zone.
Volume and candle behavior at those zones decide the next leg.
When several correlated names test resistance simultaneously, failed breakouts have a higher probability of unwinding together.
Position size accordingly. Keep risk defined. And remember that the strongest moves often begin only after the market has thoroughly tested the willingness of sellers at these levels.
Watch the reaction, not the narrative.
DYOR. Manage risk. The chart will tell you what the next move is — not the timeline.
#Uniswap #NEAR #Bitcoin
UNI+2.31%
BTC+1.35%
#CLARITYActKeyVoteAhead
The CLARITY Act has reached the point where the headline is no longer the interesting part. The 60-vote threshold is.
The U.S. Senate is preparing for a critical procedural vote on September 15, with the vote scheduled for 2:15 PM ET, which is September 16 at 02:15 UTC+8. The bill needs 60 votes to advance, and that is exactly why I think this could become a meaningful short-term catalyst for the crypto market.
Republicans hold 53 Senate seats, so even if every Republican supports the motion, the bill still needs support from at least seven Democrats or independents to
MrFlower_XingChen
#CLARITYActKeyVoteAhead
The CLARITY Act has reached the point where the headline is no longer the interesting part. The 60-vote threshold is.
The U.S. Senate is preparing for a critical procedural vote on September 15, with the vote scheduled for 2:15 PM ET, which is September 16 at 02:15 UTC+8. The bill needs 60 votes to advance, and that is exactly why I think this could become a meaningful short-term catalyst for the crypto market.
Republicans hold 53 Senate seats, so even if every Republican supports the motion, the bill still needs support from at least seven Democrats or independents to clear the procedural hurdle. That makes this much more than a simple party-line vote. The real question is whether the latest negotiations have created enough bipartisan support to get the bill over 60.
And honestly, I would not call a smooth vote guaranteed.
The latest version of the CLARITY Act has gone through major changes. Senate Republicans say the revised text includes 126 substantive changes requested by Democrats, including stronger ethics restrictions and additional enforcement provisions. Those changes show how much pressure there has been to make the bill more acceptable across the political divide.
But there are still disagreements.
Stablecoin rules remain one of the important pressure points because banks are concerned that certain stablecoin-related rewards could create stronger competition with traditional deposits. There are also continuing disagreements around ethics provisions and how much authority should sit with federal versus state regulators.
That is why I think traders should be careful with the headline saying the vote is “bullish for crypto.”
A successful procedural vote would not mean the CLARITY Act has become law.
It would mean the Senate has cleared an important obstacle and can continue moving the legislation through the process. For the crypto market, though, that distinction may not prevent an immediate reaction.
Markets trade expectations first.
If the Senate manages to reach 60 votes, I would expect the initial reaction to be positive because regulatory uncertainty has been one of the biggest obstacles surrounding the U.S. digital-asset market. A successful vote would tell investors that lawmakers are getting closer to creating a clearer framework for digital assets, rather than leaving the industry in the same regulatory grey area.
Bitcoin would probably be my first chart to watch.
But I would not chase the first green candle.
Bitcoin was already trading under pressure ahead of the vote, with reports showing it around the $77,000–$78,000 area as traders balanced the CLARITY Act against broader macro risks and the upcoming Federal Reserve decision. That tells me the market is not trading the bill in isolation.
For me, the more important signal would be what BTC does after the headline.
If the vote succeeds and Bitcoin breaks resistance with strong volume, holds the breakout and survives the first retest, that would make the bullish case much more interesting.
If BTC spikes immediately and then gives the entire move back, I would read that differently.
That could simply be a classic buy-the-news reaction.
Ethereum could also benefit from a successful vote because clearer rules for digital assets could reduce uncertainty across a much wider part of the crypto ecosystem. Then I would look at major altcoins, especially assets where regulatory expectations are already part of the investment narrative.
But I think the bearish scenario deserves just as much attention.
If the Senate cannot reach 60 votes, the market could interpret that as a major setback for near-term U.S. crypto regulation. The reaction could be particularly sharp in altcoins and crypto-related equities because they generally carry more sensitivity to changes in risk appetite and regulatory expectations.
We have already seen how quickly sentiment can change. Bitcoin and crypto-related stocks have been under pressure as expectations around the legislation weakened, showing that traders are already positioning around the political outcome.
Still, I would not turn a failed vote into an automatic long-term bearish thesis.
That is another point I think traders sometimes miss.
The CLARITY Act is important, but it is not the only thing driving Bitcoin.
Liquidity, interest rates, the dollar, Treasury yields, institutional flows and the Federal Reserve can easily overpower a single regulatory headline. Right now, the market also has a major Fed event approaching, which means crypto could become extremely sensitive to both political and monetary-policy headlines at the same time.
So my view is that this is a volatility event first and a directional trade second.
If the 60 votes are secured, I become more constructive, but I still want confirmation from price and volume.
If the vote fails, I become more defensive, but I would wait for BTC to actually lose important support before assuming the market is entering a deeper selloff.
And there is one more reason I am paying attention to the timing.
The legislative calendar is getting tighter. Reuters reports that the vote is particularly important because there is limited time for another attempt if the bill fails to advance now. That makes this procedural vote more significant than a normal step in the legislative process.
For me, the real CLARITY Act trade is therefore not simply “pass = buy” or “fail = sell.”
I want to see whether the political result actually changes market structure.
A successful vote followed by sustained BTC strength would tell me that traders are treating regulatory progress as a genuine catalyst.
A successful vote followed by a quick reversal would tell me expectations were already priced in.
And a failed vote followed by BTC holding support would also be interesting, because it would show that the market has other drivers strong enough to absorb the regulatory disappointment.
That is what I will be watching.
The 60 votes matter.
But what happens to price after those 60 votes may matter even more.
My take is simple: the CLARITY Act can change the regulatory narrative, but Bitcoin still has to prove the market believes it.
Tonight is about the Senate.
After that, the chart gets the final word.
#GateSquareMidAutumnReunion
@Gate_Square @GateSquare
repost-content-media
  • 1
#Trading Cheat Sheet: Read the Market Before You Trade
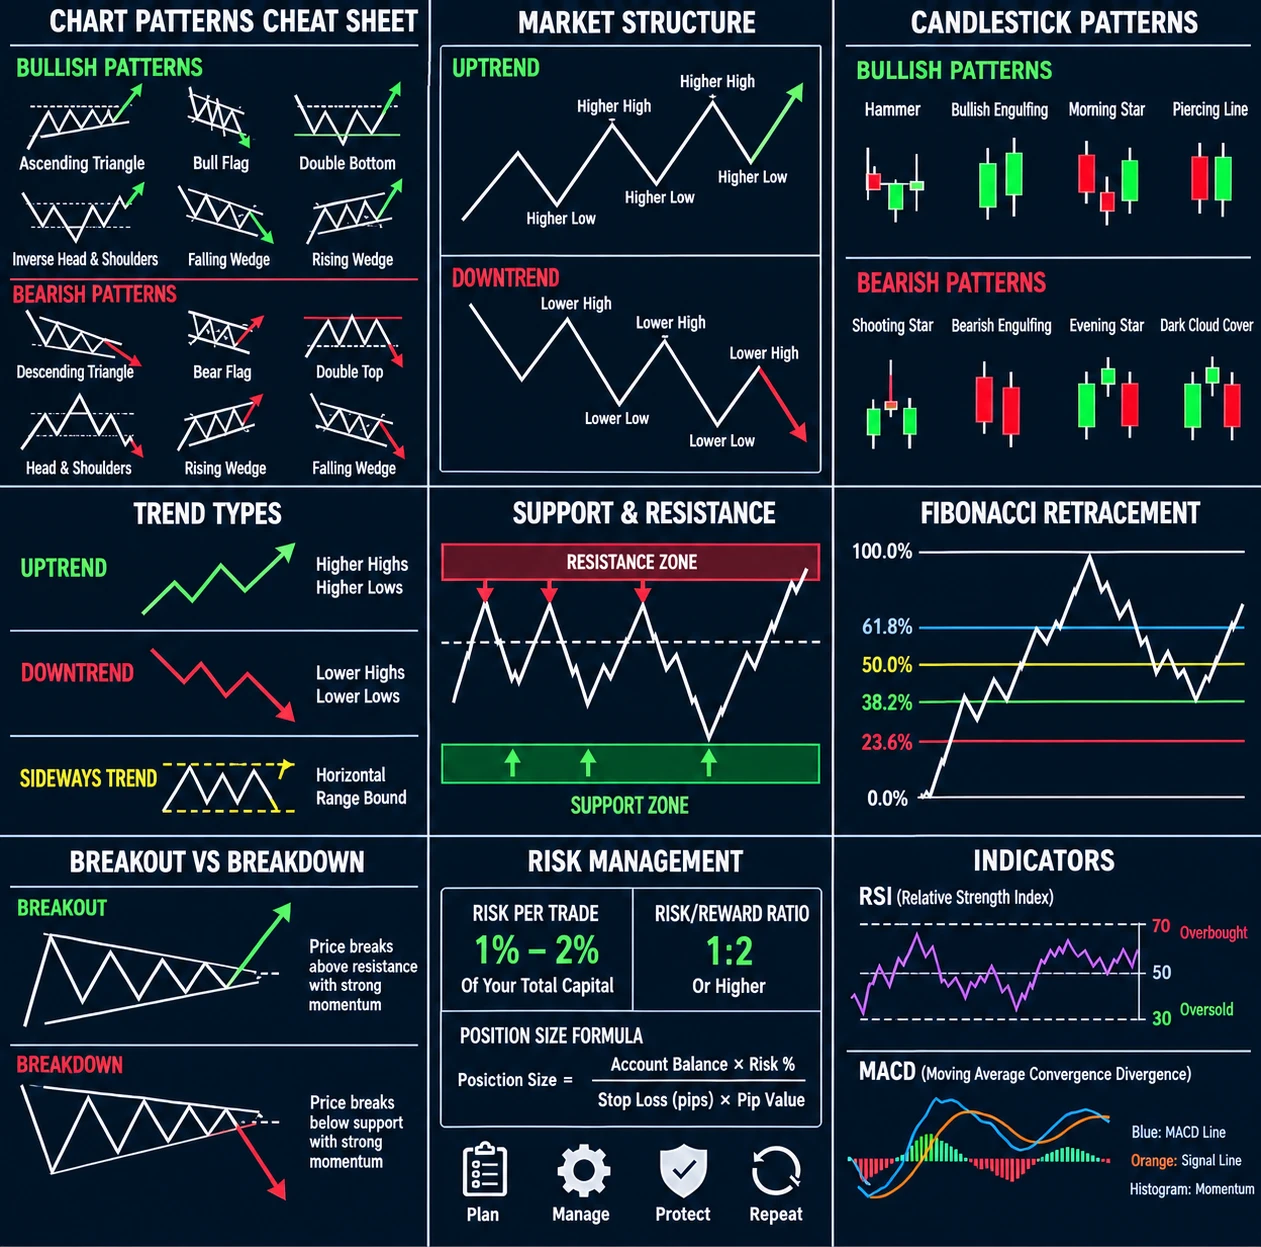
Trading mein sirf price dekhna enough nahi hota. Market structure, chart patterns, candlesticks, support & resistance, Fibonacci aur risk management ko ek saath read karna zyada important hai.
This cheat sheet covers some of the most useful concepts every trader should understand before entering a position.
Start with Market Structure.
An uptrend is generally built through Higher Highs and Higher Lows, showing that buyers are maintaining control. A downtrend is characterized by Lower Highs and Lower Lows, indicating continued selling press
BlackoutHawkCryptoBoy
#Trading Cheat Sheet: Read the Market Before You Trade
Trading mein sirf price dekhna enough nahi hota. Market structure, chart patterns, candlesticks, support & resistance, Fibonacci aur risk management ko ek saath read karna zyada important hai.
This cheat sheet covers some of the most useful concepts every trader should understand before entering a position.
Start with Market Structure.
An uptrend is generally built through Higher Highs and Higher Lows, showing that buyers are maintaining control. A downtrend is characterized by Lower Highs and Lower Lows, indicating continued selling pressure.
Before trading a pattern, first ask yourself: What is the overall market structure?
Chart Patterns Matter.
Bullish setups can include Ascending Triangles, Bull Flags, Double Bottoms, Inverse Head & Shoulders and Falling Wedges. These patterns can signal the possibility of upside continuation or reversal, but confirmation through price action and volume remains important.
Bearish setups can include Descending Triangles, Bear Flags, Double Tops, Head & Shoulders and Rising Wedges. A pattern alone is not a guarantee of a breakdown. The key is how price reacts around important levels.
Candlestick Patterns Give Extra Confirmation.
Bullish formations such as Hammer, Bullish Engulfing, Morning Star and Piercing Line can indicate potential buying pressure.
Bearish formations such as Shooting Star, Bearish Engulfing, Evening Star and Dark Cloud Cover can signal potential selling pressure.
But remember: a single candle should not be treated as a trade signal by itself. Context matters.
Support and Resistance Are Key Zones.
Support is where buyers may step in, while resistance is where selling pressure may appear. When price breaks these zones with strong momentum and confirmation, the market structure can change.
Fibonacci Retracement can also help traders identify potential reaction areas, especially the 38.2%, 50% and 61.8% levels. These levels work best when they align with existing support, resistance or market structure.
Risk Management Comes First.
The cheat sheet highlights 1%–2% risk per trade and a minimum 1:2 risk-to-reward ratio as a basic framework.
The goal is not to win every trade. The goal is to make sure that one losing trade does not destroy your account.
A good setup without proper risk management can still become a bad trade.
RSI and MACD can provide additional confirmation.
RSI can help identify momentum conditions, with 70 often viewed as overbought and 30 as oversold. MACD can help traders evaluate momentum and potential trend changes through the MACD line, signal line and histogram.
The real skill is not memorizing every pattern.
It is learning how to combine Market Structure + Pattern + Key Levels + Momentum + Risk Management before making a decision.
Plan → Manage → Protect → Repeat.
Save this cheat sheet and keep revising these concepts. The market will always offer another opportunity, but capital protection comes first.
Which setup do you trust the most: Double Bottom, Bull Flag, Head & Shoulders, or Falling Wedge?#GateMeme
repost-content-media
  • 3
#AugustCoreCPIBeatsExpectationsAugust CPI Holds Steady at 3.4% — What It Means for the Fed and Markets
The latest U.S. CPI data shows consumer prices rose 0.4% month-over-month in August, the strongest monthly gain since June. The annual rate remained unchanged at 3.4%, matching expectations. Core inflation (excluding food and energy) also stayed relatively contained.
This reading keeps inflation above the Federal Reserve’s 2% target but does not deliver a clear surprise in either direction. The market now faces a familiar question: does sticky inflation delay the start of rate cuts, or does t
BlackoutHawkCryptoBoy
#AugustCoreCPIBeatsExpectationsAugust CPI Holds Steady at 3.4% — What It Means for the Fed and Markets
The latest U.S. CPI data shows consumer prices rose 0.4% month-over-month in August, the strongest monthly gain since June. The annual rate remained unchanged at 3.4%, matching expectations. Core inflation (excluding food and energy) also stayed relatively contained.
This reading keeps inflation above the Federal Reserve’s 2% target but does not deliver a clear surprise in either direction. The market now faces a familiar question: does sticky inflation delay the start of rate cuts, or does the lack of acceleration still leave the door open for a gradual easing cycle later this year?
1. Impact on Fed rate-cut expectations
A 0.4% monthly increase prevents the Fed from claiming rapid progress toward its target. However, because the figure landed exactly in line with forecasts, it is unlikely to force an immediate hawkish shift. Traders will watch the next few data prints closely. If subsequent reports continue to show moderate monthly gains without a sharp re-acceleration, the case for a cautious first cut in late 2026 remains intact. Persistent energy and shelter contributions remain the key risks that could push the timeline further out.
2. Short-term reaction in crypto and equities
In risk assets, an in-line print typically reduces the chance of a sharp “higher-for-longer” shock. Crypto and growth stocks often respond positively when the data removes extreme hawkish scenarios. At the same time, the still-elevated annual rate limits aggressive risk-on positioning. Expect continued two-way volatility: relief rallies on soft components, followed by profit-taking if traders interpret the monthly rise as evidence that disinflation has stalled.
3. Trading opportunities under current conditions
- Prefer selective exposure in assets that benefit from a delayed-but-still-possible easing path, including quality large-cap tech, selective AI-related names, and major cryptocurrencies with strong liquidity.
- Watch energy-sensitive and high-beta names for short-term swings driven by the monthly CPI composition.
- Maintain disciplined risk management. Elevated real yields and uncertainty around the exact timing of rate cuts favor positions with clear invalidation levels rather than aggressive leverage.
The data keeps the Fed in a data-dependent stance. Markets will now focus on the next employment and inflation releases for clearer direction. Sharing a measured, data-driven view is the most valuable contribution right now.
#每周来晒 #8月CPI数据出炉
repost-content-media
  • 3
#GateMeme 🔥 Robinhood Chain Memes Are Pulling Back — Shakeout or the Start of a Bigger Cooldown?
The Robinhood Chain meme market is getting hit with a broad pullback, and this is exactly where the real test begins.
$PONS and $CASHCAT have both retraced significantly from their highs. After a strong meme rally, a correction is normal — but the important question is whether buyers are using this weakness to accumulate or simply stepping away from the hype.
My view: don’t blindly buy the dip just because prices are lower. A healthy pullback should eventually show stronger volume, improving momen
BlackoutHawkCryptoBoy
#GateMeme 🔥 Robinhood Chain Memes Are Pulling Back — Shakeout or the Start of a Bigger Cooldown?
The Robinhood Chain meme market is getting hit with a broad pullback, and this is exactly where the real test begins.
$PONS and $CASHCAT have both retraced significantly from their highs. After a strong meme rally, a correction is normal — but the important question is whether buyers are using this weakness to accumulate or simply stepping away from the hype.
My view: don’t blindly buy the dip just because prices are lower. A healthy pullback should eventually show stronger volume, improving momentum and buyers defending key levels. If volume keeps fading while sellers remain in control, the market may need more time to reset.
But if these memes start reclaiming important levels with strong volume, the current weakness could turn into a classic shakeout before another speculative move.
That’s where the opportunity — and the risk — becomes interesting.
What would you do here?
🟢 Buy the dip
🔴 Wait for confirmation
⚠️ Avoid memes until momentum returns
Drop your view below and explain why you picked your side.
#GateMeme
repost-content-media
PONS+1.88%
CASHCAT-1.26%
  • 2
#GateMeme
Me checking my portfolio after last night’s PPI dump:
“It’s just a healthy correction…
It’s just a healthy correction…
It’s just a healthy correction…”
BTC: drops another 2%
Me:
“Okay… maybe not that healthy.”
Meanwhile the group chat:
One guy: “This is the bottom, I’m all in”
Another guy: “This is the top, I’m out”
Third guy: already liquidated
Fourth guy: still asking “kya hua?”
And then there’s that one friend who bought the dip at 76,400 and is already flexing screenshots.
Tonight’s CPI is coming…
Either we pump like never before
or we go lower faster than my willpower on a diet
BlackoutHawkCryptoBoy
#GateMeme
Me checking my portfolio after last night’s PPI dump:
“It’s just a healthy correction…
It’s just a healthy correction…
It’s just a healthy correction…”
BTC: drops another 2%
Me:
“Okay… maybe not that healthy.”
Meanwhile the group chat:
One guy: “This is the bottom, I’m all in”
Another guy: “This is the top, I’m out”
Third guy: already liquidated
Fourth guy: still asking “kya hua?”
And then there’s that one friend who bought the dip at 76,400 and is already flexing screenshots.
Tonight’s CPI is coming…
Either we pump like never before
or we go lower faster than my willpower on a diet.
Either way,
I’m just here for the memes and the emotional damage.
Who else is watching CPI with one eye open and one hand on the sell button?
Drop your current emotional status below:
Diamond hands
Paper hands warming up
Already liquidated and watching for entertainment
Just here for the
Let’s see who survives the night.
#GateMeme #BTC #CPI #GateMeme
repost-content-media
BTC+1.35%
  • 3
#GateTop4MainstreamCEX
Gate’s position in the global exchange market is becoming harder to ignore.
The August 2026 numbers tell a bigger story than a simple ranking.
Gate recorded roughly $40 billion in spot trading volume and around $285 billion in futures volume during August, putting its combined trading activity at approximately $325 billion for the month.
But the more interesting part is not the headline volume. It is where that volume is coming from.
Gate’s spot market continues to represent a meaningful part of its activity, while derivatives have become the dominant engine of overall
MrFlower_XingChen
#GateTop4MainstreamCEX
Gate’s position in the global exchange market is becoming harder to ignore.
The August 2026 numbers tell a bigger story than a simple ranking.
Gate recorded roughly $40 billion in spot trading volume and around $285 billion in futures volume during August, putting its combined trading activity at approximately $325 billion for the month.
But the more interesting part is not the headline volume. It is where that volume is coming from.
Gate’s spot market continues to represent a meaningful part of its activity, while derivatives have become the dominant engine of overall trading volume. That tells me the platform is increasingly being used not only by users looking to buy and sell assets, but also by traders actively managing leverage, hedging positions and trading short-term market moves.
This matters because exchange growth is no longer just about listing more tokens.
The real competition between major CEXs is increasingly about liquidity, execution, derivatives depth, product variety, risk controls and the ability to retain traders across different market conditions.
And this is where Gate’s recent trajectory becomes interesting.
A large futures number by itself does not automatically mean an exchange has achieved mainstream status. Sustainable growth requires enough liquidity to support that volume, particularly around major assets where traders care about spreads, slippage and execution quality.
That is why I would pay closer attention to the relationship between volume and liquidity, rather than looking at volume alone.
Another important point is market composition.
Crypto trading has increasingly moved toward derivatives, but spot remains the foundation of the market. An exchange that can maintain substantial activity across both markets has a more diversified trading ecosystem than one relying almost entirely on a single product category.
Gate’s August figures suggest that derivatives are doing the heavy lifting, while spot remains a significant part of the platform’s overall activity.
For traders, this creates an interesting feedback loop.
More trading activity can attract more market makers. Better liquidity can improve execution. Better execution can attract more active traders. And a deeper trading community can support further growth across spot, futures and other products.
But there is also a second side to this equation: scale brings greater responsibility.
As an exchange becomes larger, users will naturally expect stronger infrastructure, reliable execution during volatile markets, transparent risk management, competitive fees and greater confidence in the platform’s ability to handle high-volume periods.
So I don't think the real question is simply:
“Can Gate move from one ranking to another?”
The more important question is whether Gate can turn this level of trading activity into long-term market depth and user retention.
If the August numbers are sustained, Gate is moving beyond the conversation of being simply another crypto exchange. It is increasingly competing for a place among the major global CEX platforms.
And that changes the standard.
At this stage, the next milestone should not just be another volume record.
It should be stronger spot liquidity, deeper derivatives markets, consistent execution and sustainable growth through both bull and bear conditions.
That is what separates a temporary volume spike from a genuinely established exchange.
**August showed the scale.
The next few months will show whether Gate can sustain it.**
#GateMeme #GateTrenchesZeroGas #GateLaunchesTrenchesWith0GasFee #AppleEvent @GateSquare @Gate_Square
repost-content-media