🚀 TT/USDT Explodes +108% in 24 Hours! A Tale of Two Timeframes 📈
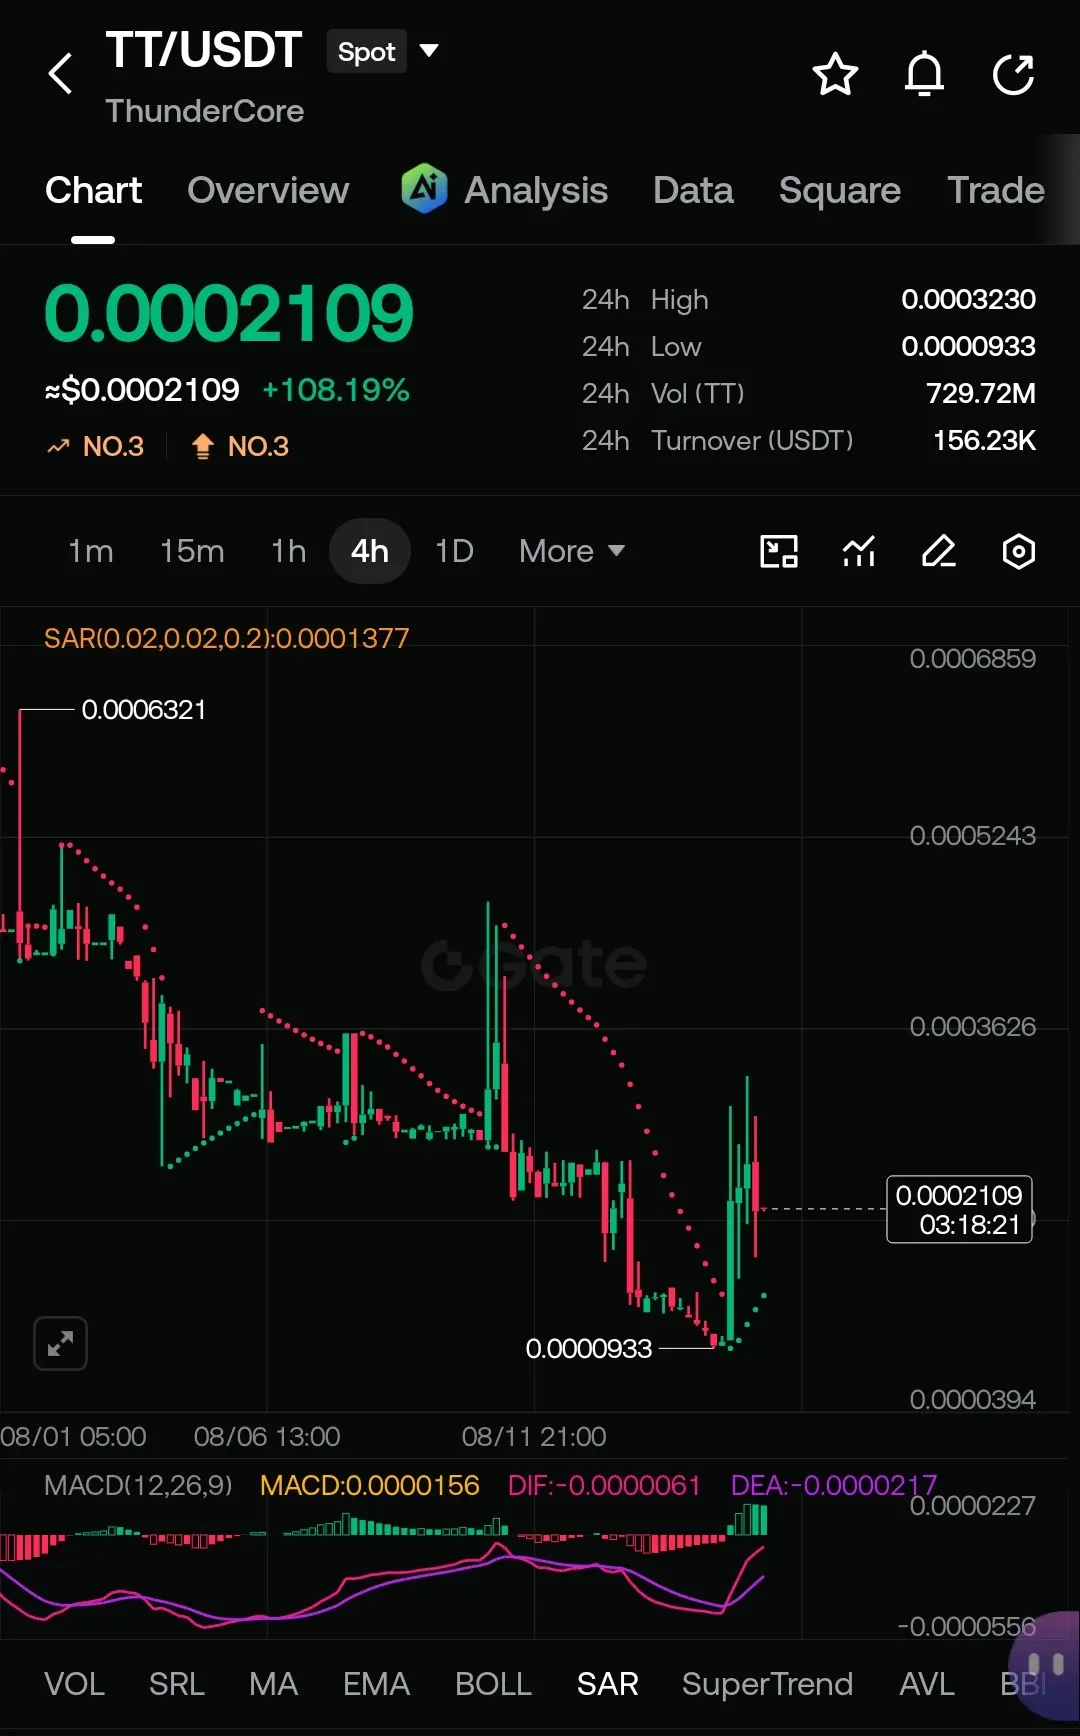
ThunderCore (TT) is stealing the spotlight today, printing a staggering +108.19% gain in the last 24 hours and currently trading at 0.0002109 USDT on Gate.io. After a brutal sell-off, is this the ultimate bottom or just a massive volatility spike? Let's dive into the technicals.
🔍 The Short-Term Surge (4-Hour Chart, the 4H timeframe paints a picture of a violent trend reversal.
The Capitulation Bottom: After grinding down to a steep local low of 0.0000933, buyers stepped in with absolute conviction, pushing the asset to a 24-hour high of 0.0003230.
Bullish Indicators: The momentum shift is clear. The Parabolic SAR has firmly flipped bullish, with support dots forming below the current price action.
MACD Crossover: The MACD indicator confirms this short-term strength, showing a sharp bullish crossover with expanding green histogram bars.
🦅 The Macro Perspective (1-Day Chart)
While the short-term chart is incredibly hot, zooming out to the Daily timeframe using provides crucial context.
The Long Downtrend: TT has been trapped in a macro downtrend since its previous structural high of 0.0015300. Today's massive green candle is a spectacular bounce, but it is happening within a larger bearish structure.
Overhead Resistance: Despite the 100%+ pump, the Daily Parabolic SAR remains bearish (currently sitting right at the 24h high of 0.0003230).
Exhaustion Signs: The Daily MACD is still deep in negative territory. However, the histogram is showing lighter red bars, indicating that the macro selling pressure might finally be reaching exhaustion.
💡 The Verdict & Key Levels to Watch
ThunderCore is experiencing a classic "V-shape" recovery on the lower timeframes, driven by massive volume (729.72M TT). However, traders need to respect the macro resistance.
For the Bulls: The key to confirming a true macro reversal is breaking and closing the Daily candle above the 0.0003230 level. This would flip the daily SAR and signal a major structural shift.
For the Bears: If the price fails to sustain this momentum and loses the 0.0002000 psychological support, this could simply be a lower-high in the grand scheme of the downtrend.
Trade safe, manage your risk, and don't let FOMO dictate your entries!
$TT
#Crypto #ThunderCore #Gateio
#TechnicalAnalysis #BitcoinTrendReversalSignalEmerges
ThunderCore (TT) is stealing the spotlight today, printing a staggering +108.19% gain in the last 24 hours and currently trading at 0.0002109 USDT on Gate.io. After a brutal sell-off, is this the ultimate bottom or just a massive volatility spike? Let's dive into the technicals.
🔍 The Short-Term Surge (4-Hour Chart, the 4H timeframe paints a picture of a violent trend reversal.
The Capitulation Bottom: After grinding down to a steep local low of 0.0000933, buyers stepped in with absolute conviction, pushing the asset to a 24-hour high of 0.0003230.
Bullish Indicators: The momentum shift is clear. The Parabolic SAR has firmly flipped bullish, with support dots forming below the current price action.
MACD Crossover: The MACD indicator confirms this short-term strength, showing a sharp bullish crossover with expanding green histogram bars.
🦅 The Macro Perspective (1-Day Chart)
While the short-term chart is incredibly hot, zooming out to the Daily timeframe using provides crucial context.
The Long Downtrend: TT has been trapped in a macro downtrend since its previous structural high of 0.0015300. Today's massive green candle is a spectacular bounce, but it is happening within a larger bearish structure.
Overhead Resistance: Despite the 100%+ pump, the Daily Parabolic SAR remains bearish (currently sitting right at the 24h high of 0.0003230).
Exhaustion Signs: The Daily MACD is still deep in negative territory. However, the histogram is showing lighter red bars, indicating that the macro selling pressure might finally be reaching exhaustion.
💡 The Verdict & Key Levels to Watch
ThunderCore is experiencing a classic "V-shape" recovery on the lower timeframes, driven by massive volume (729.72M TT). However, traders need to respect the macro resistance.
For the Bulls: The key to confirming a true macro reversal is breaking and closing the Daily candle above the 0.0003230 level. This would flip the daily SAR and signal a major structural shift.
For the Bears: If the price fails to sustain this momentum and loses the 0.0002000 psychological support, this could simply be a lower-high in the grand scheme of the downtrend.
Trade safe, manage your risk, and don't let FOMO dictate your entries!
$TT
#Crypto #ThunderCore #Gateio
#TechnicalAnalysis #BitcoinTrendReversalSignalEmerges