Square
Following
Hot
News
Profile
Share your thoughts
placeholder
Article
$OGN 99% confirmed profitable long opportunity, I’m preparing to open a 20x leveraged long position
Buy: 0.034 - 0.035 Take profit: 0.0380 / 0.0420 / 0.0460 / 0.0480 Stop loss: 0.030
Guys, trust me, it will soon rise to 0.048. Opportunities like this don’t come every day, so don’t miss out... Who wants to join me in this confirmed long position? Not investment advice; do your own research. Trade here 👉🏻 $OGN
post-image
OGN+6.03%
$BTC We’re just replaying the script from late 2023. The bullish megaphone pattern is exactly the same, and points 1, 2, and 3 are already locked in. After being rejected at 87k, we’re now hovering around 83k. The next step is a plunge to 74k to clear out leverage—that would mark point 4. If 74k holds, we’ll head straight for point 5 at 102k. Open interest is at a new high, and a major shift is right around the corner.$BTC Can it reach 102k? We’ll know when it hits the 74k point.
post-image
BTC-1.42%
Current price: 0.29869. The nearest resistance above is the Bollinger upper band at 0.333245, while support below is initially at MA5 0.29406. It surged 57.27% over 24h, with a trading volume of 18.0M USDT, making it the only one of the three candidates to establish an independent bullish structure.
A side-by-side comparison shows the strength gap: $WLD is currently at 0.5229, down 9.64% over 24h, with MA5 0.52846 below MA20 0.54617, RSI at just 30.3, a bearish MACD, and the price tracking the lower Bollinger band at 0.523221; $LUMIA is currently at 0.1097, down 10.67% over 24h, with simila
post-image
GTC
GTC芝麻币
Gate.Fun
MC:$0.1Holders:1
0%
WLD-8.57%
LUMIA-16.31%
Bitcoin is broadly exhibiting a volatile downward trend. After coming under pressure and retreating from the high around 83720 early this morning, it successively broke through short-term moving averages and round-number support levels during the volatile decline, reaching the low around 82680. It is currently trading around 82860. Bearish selling pressure has continued to dominate the market intraday, with trading volume gradually being released as the decline continues. Ethereum has shown a high degree of correlation with Bitcoin, likewise beginning a downward move from the high around 2615
post-image
BTC-1.43%
ETH-0.97%
  • 2
10.13 BTC early morning positioning idea
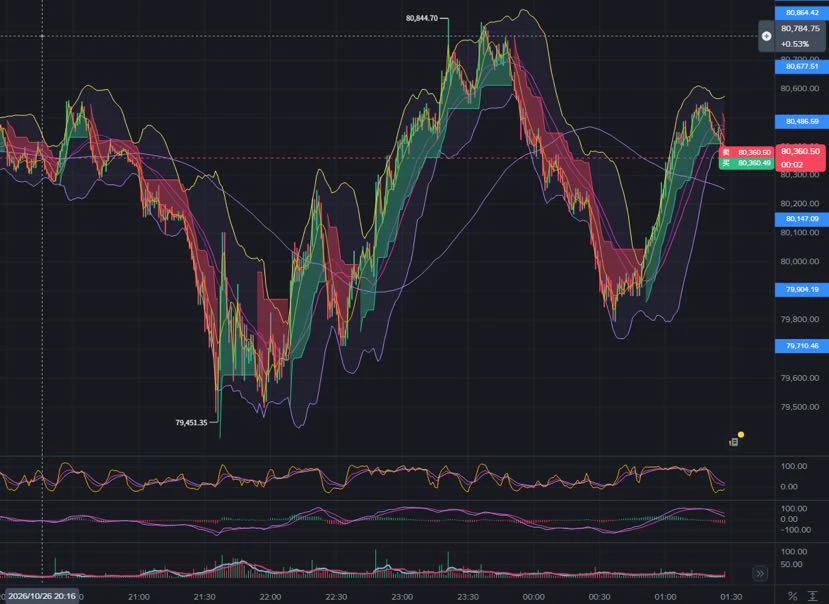
BTC on the 30-minute chart saw a rapid plunge, with the price falling more than 2,000 points from the interim high of 84340, reaching a low of 82349 before seeing a slight respite. It is currently maintaining weak, low-level consolidation around 82690; the chart indicators remain bearish throughout, with the Bollinger Bands opening and diverging downward. The price is still trading below the lower band. Although it is briefly oversold, the downtrend has not reversed, while the MACD continued expanding its green bars after a high-level death cross, indic
post-image
BTC-1.42%
🚨 JUST IN: Strategy just bought another 250 BTC for $21 million.
That’s roughly $84,000 per Bitcoin.
Saylor’s Bitcoin accumulation continues. 📈
bitcoin:native
post-image
BTC-1.43%
This pullback in commodities is just handing tickets to those who missed the ride. Don’t ask why—the answer is simply that the cycle isn’t over yet. Advisors, instead of agonizing over which asset to allocate to, should first figure out what role it plays in the portfolio. If you think I’m talking nonsense, save a screenshot. If you’re watching, give me a follow.
post-image
I’ve never been a short-term trading blogger, so as you can see, the short-term trades I refer to are basically all at least 1,500 points.
My personal view is to trade less, manage your positions properly, and make bold moves when you’re confident to improve your returns and accuracy. Doing this day after day is what it means to move forward.
$BTC #GateX红牛F1新加坡站夺冠
BTC-1.42%
📉 The market is down across the board, and a potential recovery may depend on whether whales step in to buy. 🐋📈
post-image
NEAR has superior relative strength among mainstream Layer 1 blockchains, with a healthier pullback structure than BOME and DOGE, making it worth adding to the watchlist. $NEAR
In a side-by-side comparison: BOME plunged 26.06% over 24h, with an RSI of just 12.5, indicating an oversold collapse; DOGE fell 0.98%, with an RSI of 35.8, showing a weak, gradual decline; meanwhile, $NEAR rose 3.58% against the trend, with an RSI of 43.2, making it the only one of the three assets to close higher while its RSI remained outside the oversold zone. NEAR is currently priced at 5.592, close to the lower B
post-image
NEAR-5.96%
DOGE-2.56%
BOME-24.92%
After Korean stocks plunged, I choose to watch rather than buy first: Bottom-fishing is not about having more courage, but whether the conditions are right
Samsung Electronics and SK hynix led the decline, sending Korean stocks sharply lower, while investors’ emotions felt like riding a roller coaster without a seat belt. Some believe a major plunge creates a golden opportunity, while others worry the market has not yet bottomed. Both views have merit, but I care more about one question: Do we have sufficient grounds to determine whether this correction is nearing its end?
My strategy leans to
post-image
NVDA-1.28%
#pekgy Will it hit the final bottom and reverse tomorrow, I wonder :)) Crazy questions in my head ... will this # pekgy come down to 9 TL, I wonder ... though you wouldn’t believe this either :))) You didn’t believe me when I said it would fall from 12 😄😄😄😄😄😄
post-image
US trading hours. Whats next for BTC
live-cover
LIVE1,429
10.13 ETH Early-Morning Trading Setup
ETH is currently dominated by short-term bearish forces; at the indicator level, the Bollinger Bands are expanding downward, with the price approaching the lower band. The middle band around 2542 forms strong short-term resistance. The MACD bearish green bars continue to expand, while DIF and DEA are both moving downward, indicating that bearish momentum is still being released. Key support levels below are the lower Bollinger Band around 2520 and the previous low where the move began around 2496.
Short Position
Entry: Light short near 2545
Stop loss: 2570
post-image
ETH-0.96%
$ENA has fallen to the lower Bollinger Band—is this a bottom-fishing opportunity or merely a continuation of the downtrend?
First, the conclusion: This is an oversold rebound window within a bearish alignment, not a trend reversal. It is only suitable for lightly positioned short-term longs, not for heavily positioned bottom-fishing.
Technically, $ENA is currently at 0.2224, already close to the lower Bollinger Band at 0.22149. MA5=0.22506 is below MA20=0.234405, with the moving averages showing bearish pressure and the medium-term trend still weak. However, RSI=36.1 has entered a relatively
post-image
ENA-8.27%
PUMP-10.17%
PYTH+12.61%
$FET 24-hour: -7.97%, but the price has already reached a level where neither bulls nor bears can easily add to their positions.
I’m only watching one point of divergence: whether it can quickly reclaim 0.2208 after breaking below it. The current price is 0.2239, with volume at 0.82x. The 1-hour and 4-hour trends are both weak, with RSI at 30 and 46, respectively.
If it breaks above 0.2443 with continued rising volume, the initiative will favor the bulls; if it breaks below 0.2208 and fails to reclaim it, the short-term outlook is invalidated, and the next level to watch shifts to 0.2106.
Don’
post-image
FET-7.51%
$BOME Down 25% in 24 hours, plunging directly from 0.0011 to 0.0008, with 48.7M in trading volume—seeing this figure on day 158 after the halving, I looked through the data from the first three cycles, and it sent a chill down my spine.
Let’s start with the data. On day 158 after the 2016 halving, BTC hovered around $600, seemingly dead, while altcoins broadly fell back to their pre-halving starting points. At the same time in 2020, BTC spent a full three weeks grinding around 10500, DeFi had not yet taken off, and most tokens drifted down more than 30%. Now in 2024, BOME has been cut in half
BOME-24.92%
BTC-1.43%
MEME-3.99%
BTC MARKET UPDATES
live-cover
LIVE1,108
First-Trade Loss Covered Up to 10 USDT | Cumulative Losses Compensated Up to 2,000 USDT https://www.gate.com/campaigns/6480?ref=BVVEVQ9c&ref_type=132
post-image
User_any
First-Trade Loss Covered Up to 10 USDT | Cumulative Losses Compensated Up to 2,000 USDT https://www.gate.com/campaigns/6480?ref=BVVEVQ9c&ref_type=132
repost-content-media
  • 4
Load More

Join 40 M users in our growing community

⚡️ Join 40 M users in the crypto craze discussion

💬 Engage with your favorite top creators

👍 See what interests you

Trending Topics

GateWCTCS9GlobalTradingCompetition

35.41k Views5.45k Discussing

Gate WCTC S9 Global Trading Competition is officially live, crossing asset boundaries across crypto, stocks, and CFDs with an 8M USDT total prize pool. The Lucky Launchpad guarantees a win every time, new users get a 20 USDT futures voucher upon registration, and the Event Contract PK tournament features a prize pool of up to 400,000 USDT.[👉 Read announcement](https://www.gate.com/announcements/article/102133)

GateXRedBullWinsSingaporeGP

174.25k Views6.48k Discussing

WillYouBuyDipInKoreanStocks

61.68k Views1.78k Discussing

View More