
Square
Following
Hot
News
Notifications
Profile
Share your thoughts
placeholder
Article
#ShareWeekly #401k #WCTCS9

A major development in U.S. financial regulation could open a new chapter for the cryptocurrency industry. The U.S. Department of Labor has submitted its final rule on alternative investments in 401(k) retirement plans to the White House for review, bringing digital assets one step closer to broader acceptance within traditional retirement investment markets.

The rule was submitted to the White House Office of Information and Regulatory Affairs (OIRA) on November 5, 2026. It could make it easier for retirement plan managers to consider cryptocurrencies alongside t
BTC-0.31%
ETH-0.91%
  • 1
$KORU Keep going long and look for a rebound! Targeting around 7.5–8! Others are fearful, I'm greedy! Just go for it! Hop aboard and pick up some easy money!
post-image
KORU-1.22%
Trenches
ZIG
Z
bade
b
ZIG
0x8c...1145
Market Cap
$.
Change
.
24h Vol
$.
Holders
.
STONK
S
bade
b
STONK
6GmA...UNgx
Market Cap
$.
Change
.
24h Vol
$.
Holders
.
IDOL
I
bade
b
IDOL
0x3b...ab07
Market Cap
$.
Change
.
24h Vol
$.
Holders
.
MAGGIE
M
bade
b
MAGGIE
8rHo...PmZV
Market Cap
$.
Change
.
24h Vol
$.
Holders
.
FLOAT
F
bade
b
FLOAT
Bv1a...BMmr
Market Cap
$.
Change
.
24h Vol
$.
Holders
.
BTC price patterns after halving: What do historical data tell us?
In the Bitcoin market, halvings have always been an important event for investors. With each halving, miners receive fewer block rewards, and the rate at which new BTC enters the market also declines. Historically, BTC has gone through notable bull cycles after several halvings, so many investors view halving as an important reason to be bullish over the long term.
But can historical patterns really repeat?
First, halving changes the new supply. BTC halving reduces the rate of new coin issuance, but does not directly create buy
post-image
BTC-0.67%
#USCPIDataIncoming
#USCPIDataIncoming

The US CPI data is coming, and the whole financial market is watching this important economic update. This data can give us a better idea about inflation in the United States.

CPI means Consumer Price Index. It shows how prices of daily goods and services are changing. If inflation goes higher, the Federal Reserve may keep interest rates high for a longer time. If inflation comes lower, it may create hope for possible interest rate cuts.

Bitcoin, Ethereum, and other cryptocurrencies may react to this news. The stock market and gold market can also see
BTC-0.67%
ETH-1.26%
XAU+0.38%
CRYPTO MARKET UPDATE
live-cover
LIVE1,024
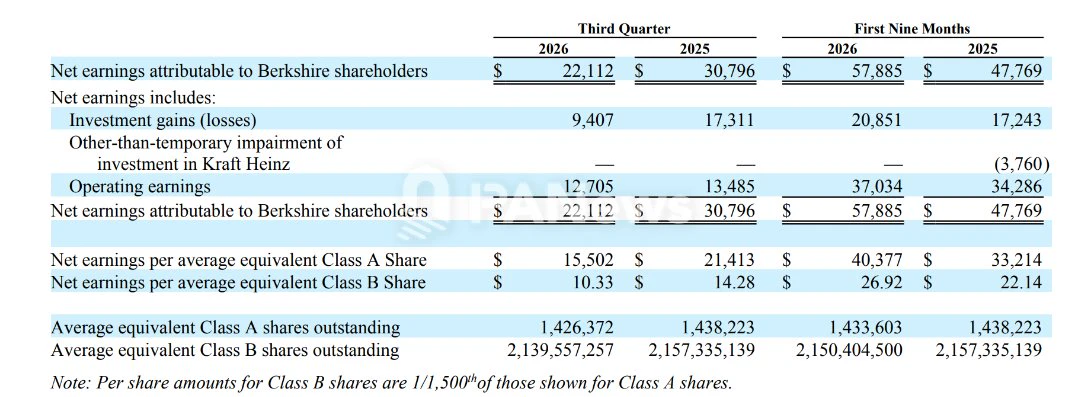
Berkshire’s third-quarter earnings report: net income was $22.1 billion, down 28% year over year. Investment gains were $9.4 billion, down 45% quarter over quarter.

It repurchased $9.6 billion of its own shares in the third quarter. So basically, it used some of what it earned from investments to buy back shares—pretty crafty.

Its cash reserves also rose to $377.4 billion. In other words, Buffett is still waiting. Even with U.S. stocks down this much, does that mean the Oracle of Omaha is still waiting for cheaper shares?
post-image
Will this week's CPI data bring a reversal?❓
Key Web3 events this week (11.9–11.15)⭐️
November 9
Publication date moved to November 9, allowing Polymarket Protocol V2 to avoid U.S. midterm election week;
Hyperliquid L2 network Elysium will launch on November 9;
Uniswap confirms V4 Hooks support on Elysium, with mainnet expected to launch on November 9
Mercado Bitcoin: Platform services will gradually resume on November 9, with compensation paid from its own funds
November 10
U.S. October CPI will be released on November 10 at 21:30;
Bitcoin payment coverage expands to over 4 million merchants,
BTC-0.67%
  • 1
$ZAMA has a good entry today at 0.0677
SL: 10% from 0.0677
strong fundamental project but new so high risk reward.
avoid investing more than 5% of your portfolio.
buy and hold or put it in a bot until the market kicks off again.
other privacy coins : #zec #near
ZAMA+2.26%
ZEC+1.16%
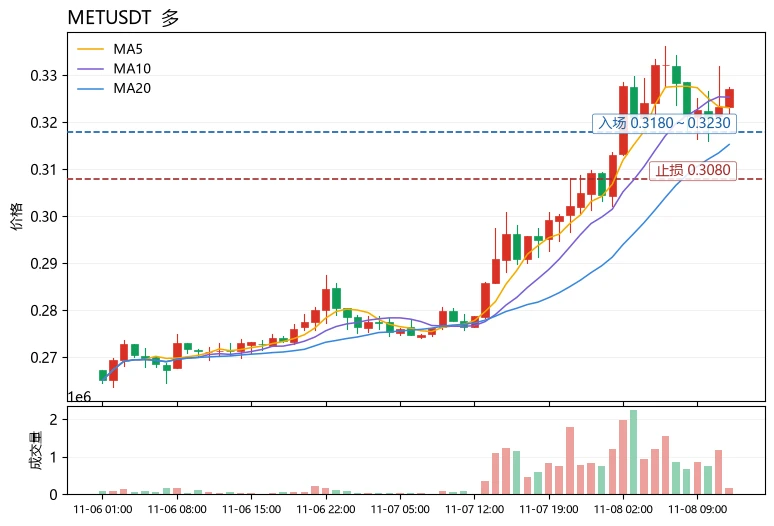
$MET Trend watch: After rising from the bottom area, trading volume has increased significantly as the price rebounded. It has moved back above the 7-day and 25-day moving averages, and short-term sentiment is warming. The market shows active capital inflows driving the move, with strong bullish momentum. There is still room for further upside, so the strategy is to add to long positions in line with the trend⬇️⬇️⬇️

MET +18.68%
Risk warning: The above is only my personal market view and does not constitute investment advice. Contract trading is highly volatile, so please manage your position
post-image
MET-0.16%
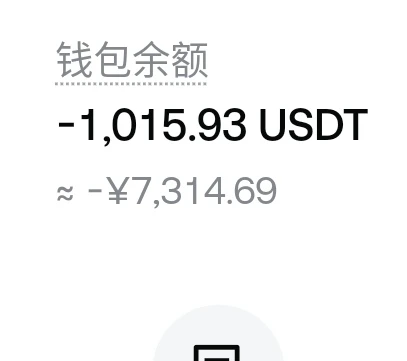
I’m leaving it alone now, making back 20u a day, and I’ll be in the green in 50 days, then I won’t touch it again
post-image
  • 1
I really don’t want to hear any more news about him; every time a story comes out, it drops by $10,000
post-image
NEW MAR MARKET UPDATE MARKET UPDATE
live-cover
LIVE1,878
Many people rush to buy the dip when they see negative funding rates, but overlook that relative strength is the source of excess returns. During the same period, $TRX$TRX rose just 1.04%, with a 1.12% range, and its Bollinger Bands were nearly flat—a typical low-volatility sideways market; $UNI $UNI rose 1.94%, with a 5.2% range and an RSI of 55, merely following the rally moderately. Meanwhile, $MET rose 18.20% in 24 hours, with a range of nearly 19%. MA5 crossed above MA20 and the price held above the moving averages, while the RSI of 66.7 had not yet entered overbought territory. Its signi
post-image
UNI+3.05%
MET-0.33%
$ARB The chart keeps forming higher lows. Brothers, take the opportunity to earn a bowl of Vietnamese pho🤩Go long now🔥🔥Take-profit 1: 0.182 Take-profit 2: 0.2 Take-profit 3: 0.25 Stop-loss: 0.139$IDOL $AIN
post-image
ARB+1.17%
IDOL-6.71%
AIN+3.85%
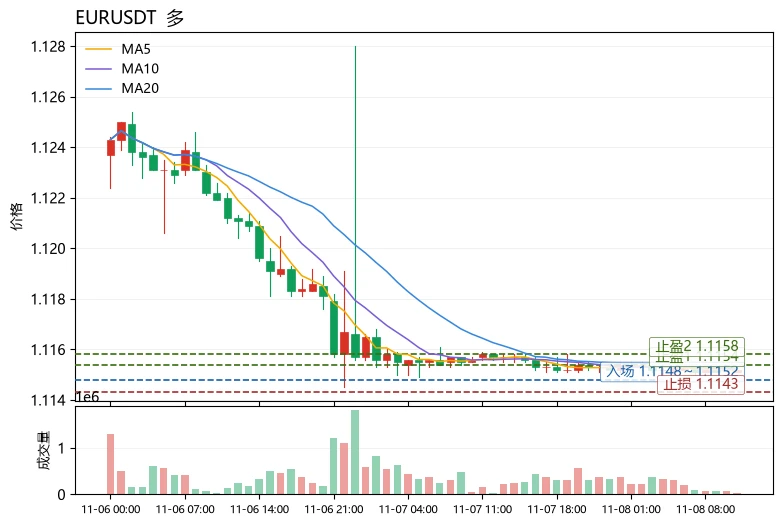
$EUR Current price 1.1152, 24h -0.04%. The range across 30 candlesticks is only about 0.1%, with volatility extremely compressed. On the moving-average front, MA5=1.11516 is slightly below MA20=1.11526; the short- and medium-term moving averages are converging and flat, with no clear direction. RSI=37.6 is in the weak zone but not oversold. The MACD histogram=+0.0001182 remains slightly bullish, but momentum is insufficient. The Bollinger Bands [1.11508,1.11544] are extremely narrow, and the price is trading near the lower band. The Fear & Greed Index is 28, indicating fearful market sentiment
post-image
eur
eureur
Gate.Fun
MC:$5.55KHolders:3
0.06%
LTC-0.07%
UNI+3.05%
My roommate recently did something pretty outrageous—pretended to be a foreigner to pressure a seller into shipping an order. He’s really mastered the art of “international order chasing.” $ETH $BTC By the way, the nonfarm payrolls data has once again added fuel to rate hike expectations, while the US plans to tighten data center regulations, potentially putting new shackles on AI expansion. BTC dipped 0.16%, and ETH fell 0.42%. Markets fluctuate, so don’t get carried away. Trade at your own risk. (The above is solely my personal opinion and does not constitute investment advice. Please asses
post-image
BTC-0.67%
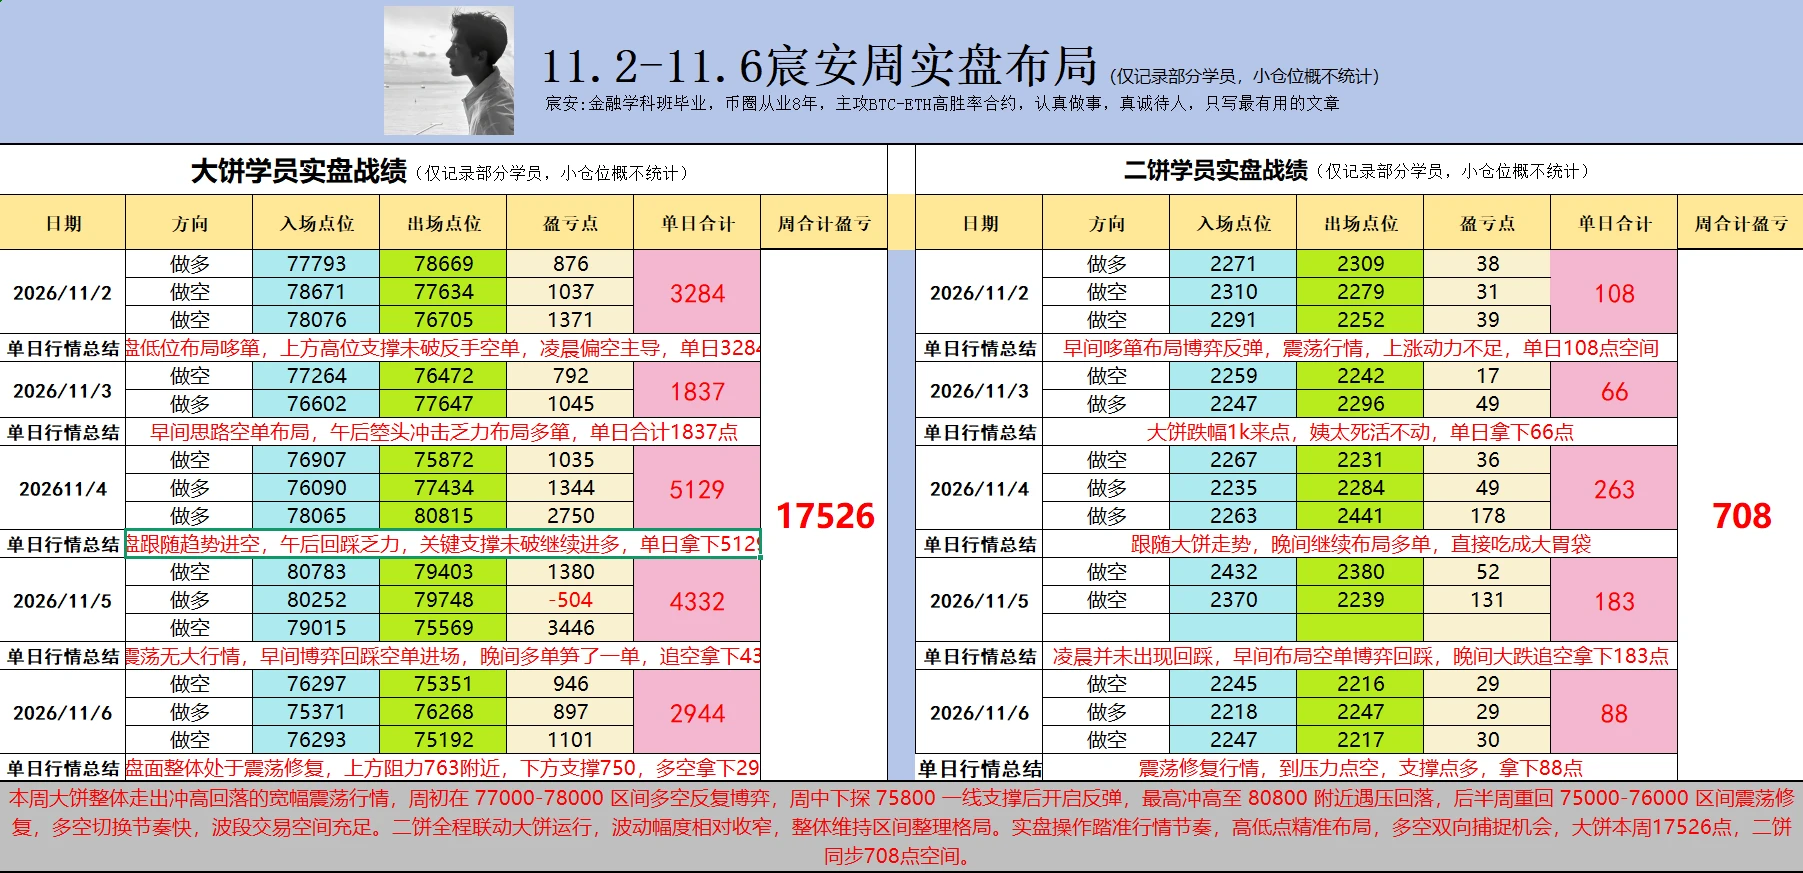
This week’s Bitcoin market action has officially wrapped up, with a wide-ranging move that first fell, then rose, and then pulled back. The battle between bulls and bears was fierce, and shifts in momentum far exceeded expectations.

  At the start of the week, bulls and bears repeatedly tussled around the 77k mark as market divisions continued to deepen. Then bearish pressure was unleashed in a concentrated burst, and the price quickly plunged to around 75,700 before finding support and stabilizing. Midweek, buying sentiment picked up, and the price launched a strong rally, climbing all the w
post-image
BTC-0.65%
ETH-1.23%
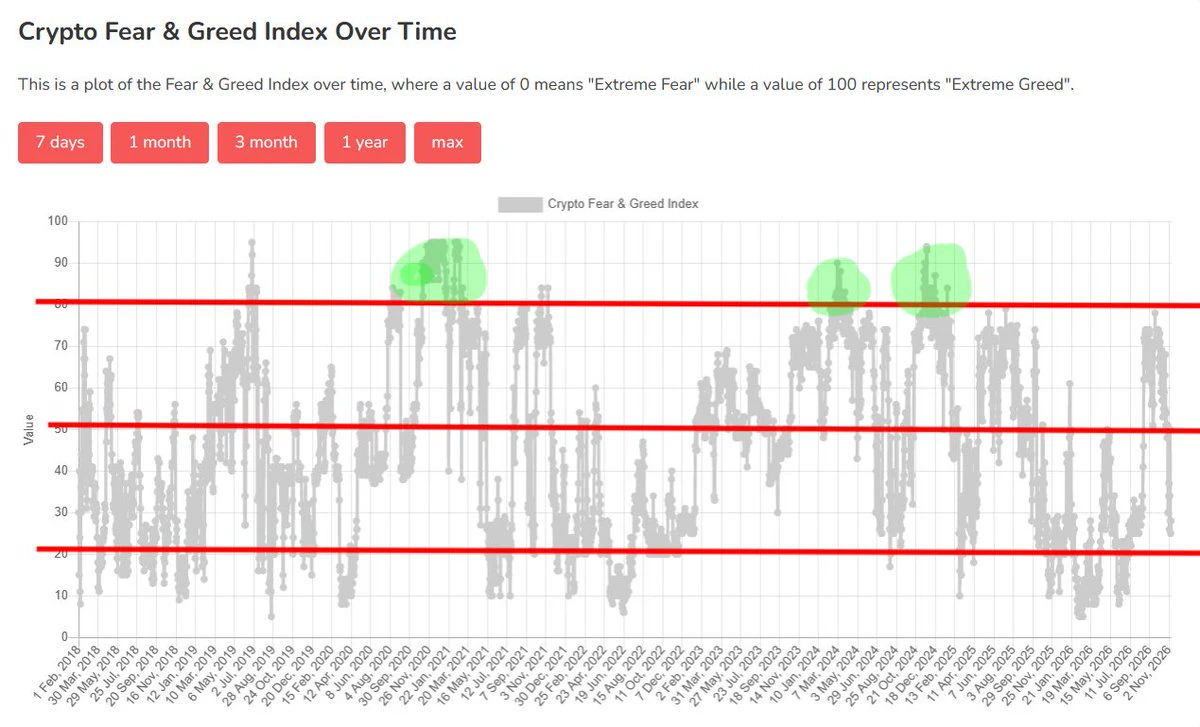
The last time sentiment was this low was in February, March and June when Bitcoin was in the low 60Ks, which offered the best entry of the year. Now we’re up 30% in price yet sentiment is back around the same level of 20. This means sentiment has been resetting while price prints a macro higher low above 70K presenting another opportunity.
P.S. for altcoins only above 80
post-image
BTC-0.67%
#Gate股票畅聊季
The global stock market is constantly evolving, creating new opportunities and challenges for investors. From technology and artificial intelligence to semiconductor companies, electric vehicles, banking, and energy, every industry is experiencing changes that can influence market performance. Gate's Stock Discussion Season brings the community together to explore these developments, share valuable insights, exchange trading experiences, and discuss the future of investing.

In today's financial environment, successful investing requires more than simply watching stock prices. Inves
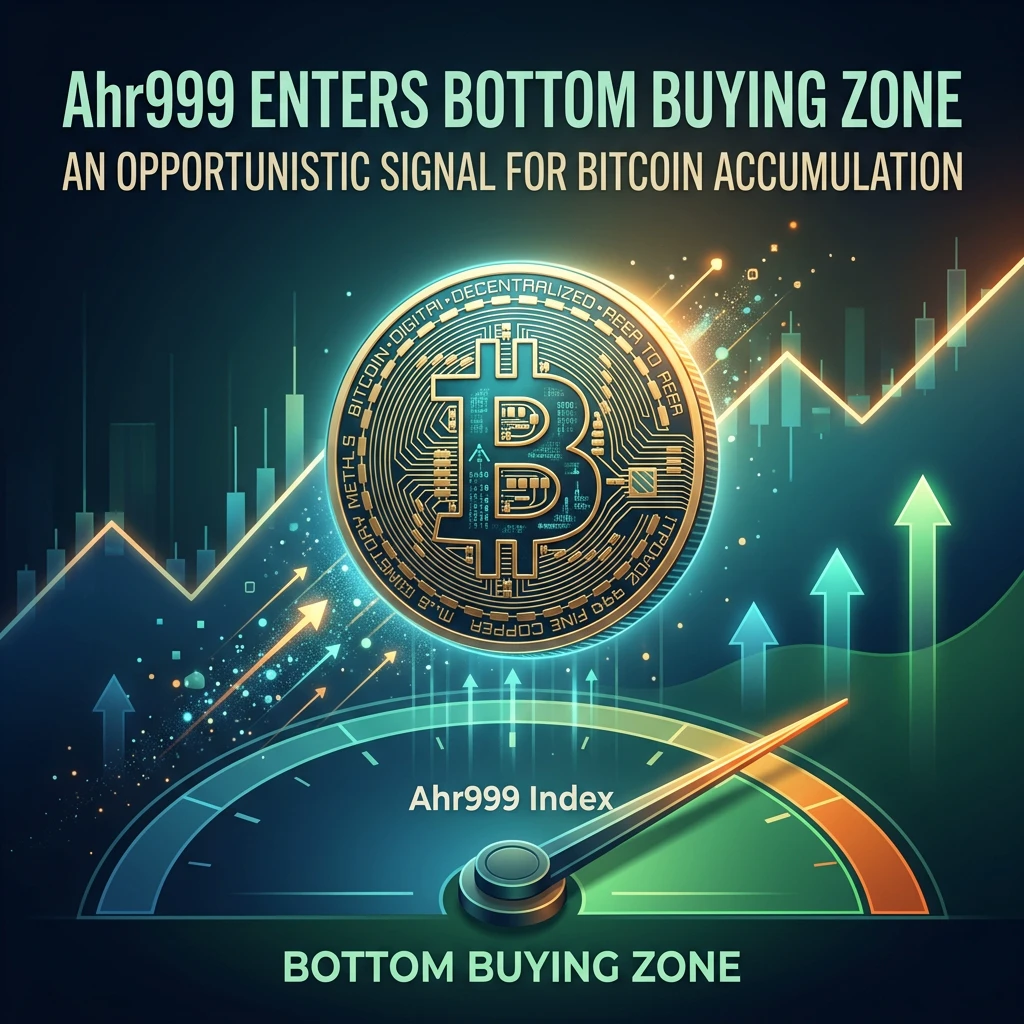
#Ahr999EntersBottomBuyingZone

AHR999 Drops Below 0.45: Bitcoin Enters a Historically Important Bottom-Buying Zone

The Market Has Reached an Important Point

Imagine watching Bitcoin trade around $80,000, then seeing its price move lower while a long-term valuation indicator enters a historically important zone. You might wonder whether the market is approaching a major turning point or simply experiencing another correction.

That is the situation surrounding the AHR999 indicator on November 8, 2026. Its latest reported reading is approximately 0.429, placing Bitcoin inside the historically
post-image
BTC-0.67%
Load More

Join 40 M users in our growing community

⚡️ Join 40 M users in the crypto craze discussion

💬 Engage with your favorite top creators

👍 See what interests you

Trending Topics

USCPIDataIncoming

1.88k Views1.49k Discussing

The U.S. October CPI report will be released on November 10 at 8:30 a.m. ET. September CPI came in at 3.7% year over year, and markets will be watching closely for signs that inflation is cooling, especially in core CPI. A softer-than-expected reading could strengthen rate-cut expectations, while hotter inflation may pressure risk assets through higher Treasury yields and a stronger dollar. How do you think this CPI print will move $BTC, U.S. stocks and gold?

USAIStocksHitHard

24.01k Views3.69k Discussing

USNonfarmPayrolls

41.49k Views4.38k Discussing

View More