Square
Following
Hot
News
Profile

KKYE

vip
Active for: 1.2y
Peak Tier 1
No content yet
9
Following
1
Followers
21
Liked
Next week’s market life-or-death showdown! 90% of traders are still stepping into fatal mistakes
This week’s low-liquidity grind has been ping-ponging like sewing needles, stabbing both longs and shorts—if you’ve been losing, raise your hand!
1. ETFs keep bleeding out; any fresh buy-side in the venue has already run dry—every rebound is just bait for bull trap distribution
2. A 1/3 chance of FOMC rate hikes is hanging over everyone’s heads; institutions are all watching from the sidelines and don’t dare push the market
3. $5 billion options are stuck in a tight, dead-lock range of 70,000–72,00
BTC-0.39%
$45.5 million BTC short positions crowding in—20x leverage stacking for a squeeze trap! The whole internet is collectively bearish; the main force is right on the edge of forcing liquidations.
The whole network is exploding! A single $45.5 million BTC short order has been exposed, instantly cranking up to a 20x ultra-high leverage. On the chart, an entire liquidation wall above has been laid bare. Countless retail traders are following suit and piling into shorts—everywhere in the market, bets are one-sided, pressing for continued further declines.
Most people only focus on the short-side upsi
BTC-0.39%
Fatal bad news keeps hitting in a chain! ETF sees two straight days of outflows. Next week’s FOMC rate-hike risk is closing in—don’t bottom-fish.
This week was a dead, stagnant range all the way through: throughout the week, the standard spot market traded back and forth within a tight intraday range, with no meaningful breakouts on either side. The price action has already been hiding signs of weakness and selloff.
The most lethal data is right in front of everyone: ETFs have recorded net capital outflows for two consecutive days, and the only spot incremental buy-side liquidity in the market
BTC-0.32%
HYPE-1.05%
SOL+0.92%
ETH+0.21%
  • 1
$BTC ‌From the current situation, it doesn’t look like the breakout has enough momentum to be picked up. Observe the point structure shown in the chart.
After breaking the previous low, watch to see whether it’s a false break. If it holds and stays firm, then consider the second buy. Ideally, this can be achieved tonight; otherwise, if it extends to the weekend (Saturday/Sunday), don’t participate again in supporting positions—wait until Monday’s US evening session (美盘) to make a decision.
Next week’s key milestone includes a big “bomb”: whether the crypto bill is being advanced or not.
BTC-0.39%
The liquidity-hunting trap has already landed! Big “BTC” is about to spike—63,800. Every dip-buy long will end up buried.
How many people rushed to chase longs after the early surge this morning?
Trading volume can’t keep up at all—this is a textbook major-player “liquidity hunt” with a fake breakout. It directly smashes through the 65,400 long/short lifeline!
The signals on the board are basically nailed down now: every rebound is an opportunity to sell. The next target is Monday’s low at 63,800, specifically sweeping out stop-losses for those chasing longs.
Good thing I cleared all my longs
BTC-0.39%
Breaking down how to approach trading in the US session: don’t rush to short altcoins at this stage
Here’s a trading plan publicly shared this week. It clearly distinguishes the trading cadence for BTC, ETH, and altcoins, and the logic is well worth referencing.
Overall, the approach is to treat the two major leaders differently from the smaller coins: in the short term, let Bitcoin consolidate while it trends upward, and don’t actively short the “big pie.” After the New York session opens, focus on positioning Ethereum short orders.
The key support levels shown in the chart have strong near-t
BTC-0.39%
  • 6
The market is collectively weak—only Dogecoin holds up the board $BTC
At the moment, the overall spot market sentiment is sluggish; the vast majority of major coins are down across the board, and the long/short battle is leaning toward the shorts.
BTC (the “big pie”) is currently $64,909, down only 0.07% on the day—its decline is relatively mild. Trading volume of $443 million supports the broader market and keeps it stable, with no big plunge. Ethereum follows the market lower, down 0.78% in a day, underperforming Bitcoin.
Sector coins face heavier sell pressure: SOL, SUI, and HYPE are all
BTC-0.39%
Strategy’s massive BTC position: an in-depth look at its holding depth — unrealized losses in the books have already reached $8.8 billion
From BlockBeats’ latest market update, as of the real-time trading view on July 24, Bitcoin spot prices are hovering around $65,010. The large Bitcoin position held by the institutional firm Strategy is currently showing an unrealized loss of 13.9% in its books. Converted, the loss amounts to a staggering $8.8 billion, putting top-tier holding institutions in the industry into a state of deep entrapment.
Looking back at the position’s baseline data: based on
BTC-0.32%
Gold and Silver Drop Together — Post-Trading Review
Earlier, geopolitical tensions escalated, driving gold and silver into a sustained bullish run. Both surged to new local highs, with gold topping out at 4,168.8 and silver reaching a peak of 61.01. But recently, the trend has reversed collectively, and both commodities have fallen sharply at the same time.
Current price: gold 4,060.2, down 2.43% today; silver 57.9, down 4.02% in a single day. Silver’s intraday volatility has been clearly higher than gold’s, consistent with silver’s inherent characteristic of stronger elasticity.
From the four
XAU-0.38%
Planet Deep Dive|SK hynix ignites a cross-market arbitrage frenzy: during the AI storage cycle, a triple pricing loophole emerges across US stock ADRs, Korean stocks, and the crypto market
I. Underlying market momentum driver: AI storage reshapes the global chip valuation framework
Over the past two years, global AI data center expansion has entered a fast-track cycle. Companies such as Nvidia and Dell have made large-scale purchases of HBM high-bandwidth memory chips, directly lifting storage vendors’ performance expectations. As the world’s second-largest storage wafer manufacturer, SK hynix
SKHY-1.28%
  • 1
#夏日创作营 Robinhood chain uses US stock MEME to connect the RWA narrative
1. Industry landscape
Solana currently monopolizes the US stock token trading on the EVM-compatible chain, with daily trading volume of tens of billions of USD, and its short-term scale far outpaces competitors. Robinhood chain has been live for only a few months; early on, the gap in transaction value was huge, but its growth rate has been rapid, and it has now entered the top three in the track.
2. Core catalysts of this round
MEME tokens pegged to NVDA ignite liquidity across the entire chain:
On 7.20, the platform Bankr
HOOD-0.95%
MEME+5.36%
RWA-0.51%
SOL+0.92%
  • 1
$DELL ‌ Shares surge 11% in a single day, and the AI server sector rallies across the board
The catalyst comes from Supermicro Computer landing a record-breaking bulk order for AI servers, lifting industry-wide demand expectations.
Dell has $51.3 billion in backlog AI server orders and has raised its FY27 AI-related revenue target to $60 billion.
The company is deeply aligned with Nvidia, delivering an integrated enterprise AI end-to-end solution that covers compute, storage, and deployment—an AI “core shovel seller” in the sector.
Solid existing order backlog supports performance, an
DELL-3.66%
  • 1
Chat for a bit
live-cover
0 views07-22 22:16
Ended • No Replay
SOL order book live observation & sharing
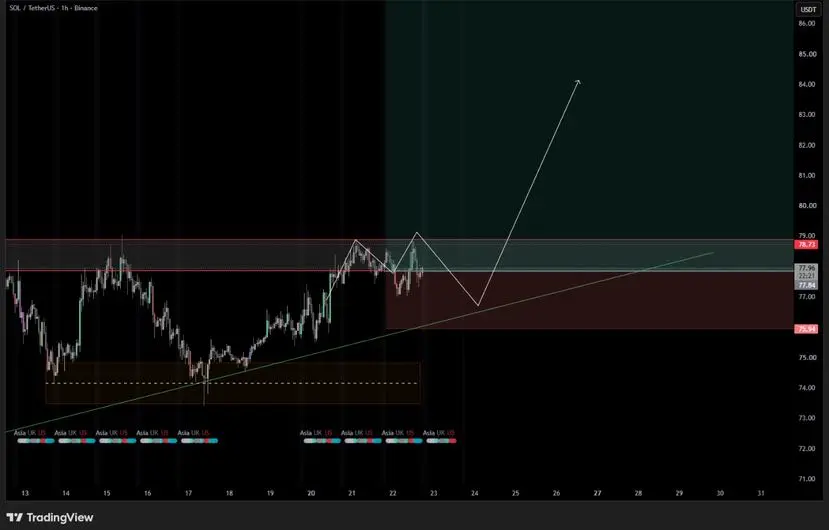
By tracking $SOL ’s trend, you can clearly see that at this stage the price is under sustained pressure. Throughout the entire move, it runs downward along a key resistance line, and the bulls have absolutely no follow-through strength.
The most important observation point right now is today’s daily candlestick close. The 78 level is the short-term divider between long and short, and its significance is crucial.
If today’s daily candle ultimately closes and holds below 78, the bearish trend will be fully confirmed, downside room will open further, and
post-image
SOL+0.92%
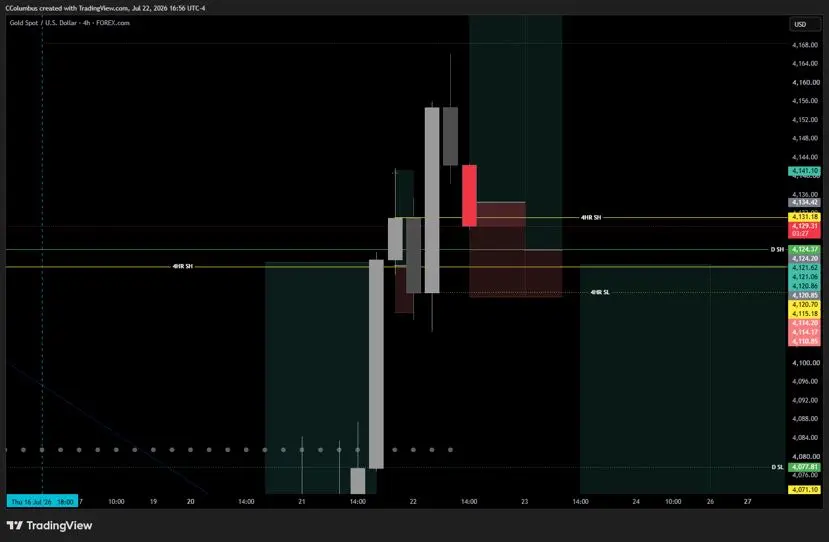
4-hour timeframe key signal reminder
If the 4-hour closing price breaks below the key support, the probability that the next 4-hour K line continues to fall is significantly increased.
If this K line closes below support, there are two ways to handle it: exit directly, with only a 0.2R loss; or reduce position size first to control risk. Afterwards, wait for the market to retest the stop-loss level, then for the price to regain the support range, and only then reassess trading opportunities.
Although the long/short logic hasn’t fully reversed yet, with support broken and the closing price show
post-image
XAUT-0.49%
After trading for a long time, it becomes increasingly clear: none of the indicators on the chart lie. When Bollinger Bands, MACD, KDJ, and RSI all collectively weaken, even if you still believe in the bigger trend, you can’t force a push. What seems like a chance to trade back and forth in the mid-range consolidation will, in reality, only keep grinding away your capital. Instead of obsessing over small fluctuations, it’s better to wait patiently for the pressure/support levels to give a clear signal before entering. A stable risk-reward ratio matters far more than frequent trading. $BTC ‌#夏
BTC-0.32%
  • 2
The market cap of Solana ecosystem ANSEM briefly exceeded $125 million, hitting an all-time high, before pulling back to approximately $117 million, with a daily gain of over 12,000%.
On June 29, semiconductor material stocks continued to expand their gains, with electronic specialty gases and silicon wafers leading the rally. Guanggang Gas hit the 20% daily limit to an all-time high. Earlier, Youyan Silicon, Duofuoro, Haohua Technology, and Yake Technology also hit their daily limits, while Shengong Shares, Zhongjuxin, Nanda Optoelectronics, Huahai Chengke, and a large number of other constit
SOL+0.92%