Share crypto content and earn up to 60% commissions through content mining.
placeholder
gatefun
🐋 WHALE WATCH : THROWBACK
On this exact day in 2017 $BTC broke $4400 for the first time in history.
Fast forward to 1 year ago Bitcoin shattered $124K.
Read that again.
If you survived the brutal consolidations and held through the noise you already know where this market is headed next. The macro setup never lies.
Are you accummulating or sitting on the sidelines ?
BTC0.00%
post-image
  • Reward
  • Comment
  • Repost
  • Share
$ACE (Fusionist) – Catastrophic Collapse, Staying Out
I'm staying far away from ACE because it has suffered an apocalyptic -49.59% drop to $0.1465, completely erasing its value from a 24h high of $0.3094. The moving averages are in freefall with EMA5 at $0.1407, EMA10 at $0.1392, and EMA30 at $0.1439. The 24h low is $0.1302, and MACD is deeply negative. This is a textbook blow-off top and subsequent crash. I'm not touching this until a stable, multi-day base forms. For now, I'm completely out.
ACE-46.69%
post-image
  • Reward
  • 7
  • Repost
  • Share
TailWind:
Another plunge, with all the moving averages bearish. Honestly, even if it rebounds, I don't want to catch this falling knife.
View More
Weekly Review
BTC +5903 points, ETH +191+
This afternoon, the bullish trend was disrupted, and 600 points were taken off the table.
BTC and ETH positions arranged on both sides; after finishing the short positions, we move on to the long positions. There are profits every day, with positive returns almost every day Y.
Sister Yue never asks you to predict the direction—just keep up with the rhythm. We take whatever the market gives us. $BTC $ETH #GateLaunchpool瓜分141万枚DOS
BTC0.00%
ETH0.00%
View Original
post-image
  • Reward
  • Comment
  • Repost
  • Share
#我的七夕交易分享
Little God of Wealth’s Tesla Trading Analysis
‌Market Summary‌
Tesla continued its rebound this week, with its share price climbing from around $311 at the end of July to around $334, a weekly gain of approximately 7%. The stock closed higher consecutively on August 7 and 11, with intraday fluctuations ranging from $329 to $336. Trading volume increased from the previous period, and market sentiment clearly improved. Driving factors included multiple positive developments, such as the Cybertruck remaining the best-selling vehicle in the United States priced above $100k, Morgan Stan
TSLA0.65%
View Original
post-image
LittleGodOfWealthPlutus
#我的七夕交易分享
Little Fortune's Tesla Trading Analysis
‌Market Summary‌
Tesla continued its rebound this week, with its share price climbing from around $311 at the end of July to around $334, a weekly gain of approximately 7%. Tesla closed higher on August 7 and 11, with its intraday trading range between $329 and $336. Trading volume increased somewhat from the previous period, and market sentiment clearly improved. Driving factors included multiple positive catalysts, such as the Cybertruck remaining the best-selling model priced above $100k in the United States, Morgan Stanley raising its second-quarter delivery estimate to 413.2k vehicles, and the groundbreaking of the Terafab chip superfactory. The current P/E ratio is around 278, with a market capitalization of approximately $1.32 trillion, leaving considerable room compared with the 52-week high of $498.
‌Technical Indicator Analysis‌
The share price has held above $330, with short-term moving averages in a bullish alignment and the MACD running above the zero line. Volume is reasonably supportive, but no surge has occurred. The RSI is in the relatively strong 50–60 range and has not entered overbought territory. However, it should be noted that the current share price remains in the lower-to-middle portion of the 52-week range of $297–$498. Pressure from medium-term moving averages remains, and overhead selling pressure should not be underestimated.
‌Key Support and Resistance Levels‌
The first support below is around $320, the area of the early-August low. The second support is at the round-number level of $300 and the 52-week low of $297. The first resistance above is around $350, while the second resistance lies in the $380–$400 range, a previous high-volume trading zone. A breakout could then lead to a challenge of $415, Morgan Stanley's target price.
‌Outlook‌
In the short term, favorable delivery data and the AI chip strategy will provide catalysts for the share price. If second-quarter earnings exceed expectations, $350 is within reach. In the medium to long term, however, investors should remain alert to pressure from high valuations, uncertainty surrounding the macro interest-rate environment, and a decline in overall market risk appetite. Investors are advised to monitor whether the $320 support holds; a high-volume breakout above $350 would warrant active follow-up, while otherwise position sizes should be controlled.
#股票交易分享挑战 $TSLA
repost-content-media
  • Reward
  • 1
  • Repost
  • Share
ThisIsTranslateContent::
Just go for it 👊
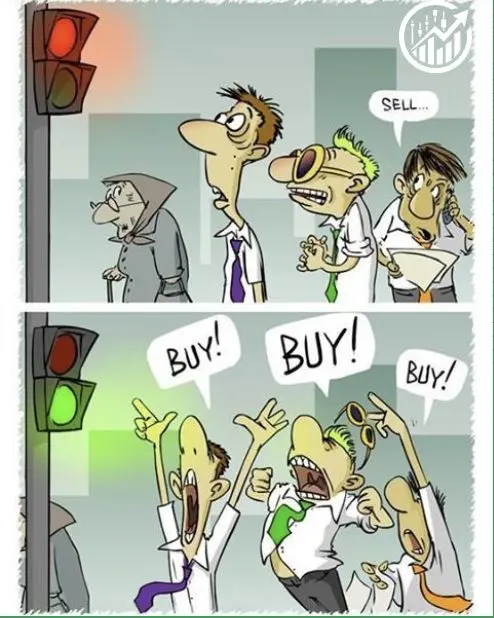
Even the top catchers cannot escape the crushing force of the cycle.
View Original
post-image
  • Reward
  • Comment
  • Repost
  • Share
#我的七夕交易分享 The $60k Defense: Why Does Crypto Have “Capital but No Trend” Recently?
ETF funds briefly flowed back in and macroeconomic data began to weaken, but Bitcoin still has not escaped low-level oscillation.
As of August 16, 2026, Bitcoin was hovering around $63k, while Ethereum was around $1,880. Over the past week, Bitcoin briefly recovered to around $65k, but soon fell back into the $62.5k—$63k range.
Cooling regulatory expectations, weakening ETF demand, and insufficient spot buying are the direct reasons the market has come under renewed pressure recently.
Recently, the total crypto m
ETH-0.03%
BTC-0.67%
View Original
post-image
ThisIsTranslateContent:
#我的七夕交易分享 $60k Defense Battle: Why Has Crypto Recently Had “Money but No Trend”?
ETF funds briefly returned, and macro data began to weaken, but Bitcoin still has not escaped its low-level range.
As of August 16, 2026, Bitcoin was hovering around $63k, while Ethereum was around $1,880. Over the past week, Bitcoin briefly rebounded to around $65k, but soon fell back into the $62.5k–$63k range.
Cooling regulatory expectations, weakening ETF demand, and insufficient spot buying are the direct reasons the market has come under renewed pressure recently.
Recently, the total global cryptocurrency market capitalization was approximately $2.26 trillion, with Bitcoin accounting for about 56.5%, Ethereum about 10.1%, and stablecoins about 13.4%. This shows that the current market remains highly concentrated in Bitcoin and stablecoins, with funds not spreading on a large scale toward small- and mid-cap tokens. The so-called “full-scale altcoin season” has yet to form.
The core judgment of this article is that the current market is neither the starting point of a new bull market nor the final panic-driven capitulation, but is closer to a low-level consolidation phase in the middle-to-late stages of a bear market.
There is still money in the market, but more of it is staying in ETFs, stablecoins, and derivatives, without forming sustained spot-buying momentum.
I. The main theme of 2026 is not a correction, but renewed compression of the valuation system
In the first quarter of 2026, total cryptocurrency market capitalization fell 20.4%, from approximately $3 trillion to $2.4 trillion; in the second quarter, it fell another 12.6% to approximately $2.1 trillion. In other words, the market has contracted for two consecutive quarters, rather than experiencing an ordinary correction caused by one or two short-term negative catalysts. Based on Bn’s public daily data, from January 1 to August 16, Bitcoin fell from approximately $88.8k to around $63.1k, a year-to-date decline of about 29%; Ethereum fell from approximately $3,004 to around $1,881, a year-to-date decline of about 37%.
However, calculated from the June low, Bitcoin has rebounded about 8.5% from approximately $58.1k, while Ethereum has rebounded about 25% from approximately $1,506. This has created a market environment that is easy to misjudge: the decline has already been substantial, and the local rebound is also evident, but the medium-term downtrend has not truly been reversed. Ethereum’s rebound has been larger than Bitcoin’s, but this does not mean Ethereum has already turned stronger; it is more because Ethereum had previously fallen further and has higher volatility.
A genuine trend reversal requires seeing the ETH/BTC exchange rate stabilize continuously, on-chain activity recover, and spot trading volume expand, rather than merely seeing the dollar price rebound from its low.
II. ETFs have seen renewed inflows, but without corresponding price elasticity
In early August, U.S. spot Bitcoin and Ethereum ETFs briefly saw significant fund inflows, with combined net inflows of approximately $1.1 billion for the week. Under normal circumstances, this level of incremental capital would be sufficient to drive a notable recovery in risk appetite, but Bitcoin only briefly rose to around $65k before falling back again. By mid-August, ETF demand had begun to weaken again, and prices also reacted tepidly to softer U.S. economic data. This indicates that ETF funds are currently serving more to absorb selling pressure and maintain the bottom than to drive a price breakout.
There are three reasons.
First, while ETF buying provides incremental demand, miners, early holders, corporate entities holding crypto, and some long-term funds may also use rebounds to reduce their positions.
Second, ETF funds are highly concentrated in Bitcoin, with limited spillover effects on Ethereum and small- and mid-cap tokens. Therefore, even if Bitcoin receives support, it may not lead the broader market to rise across the board.
Third, ETF inflows exhibit clear daily volatility. Only stable net inflows lasting several weeks, rather than concentrated buying over a few days, can constitute genuine trend-driven demand.
Therefore, at this stage, “ETF inflows” cannot simply be understood as meaning that “prices will inevitably rise.” What deserves closer attention is: **With continued inflows, can prices raise their lows in tandem?** If funds enter but prices do not rise, it usually means that substantial supply still exists overhead.
III. The macro environment has shifted from simple headwinds to a complex tug-of-war between bulls and bears
On July 29, the Federal Reserve kept the federal funds rate at 3.5%–3.75%. Notably, nine officials voted to keep rates unchanged, while three wanted a 25-basis-point hike, reflecting continued significant inflation concerns within the Fed. However, the U.S. July employment data released afterward weakened noticeably: nonfarm payrolls declined by 23k, the unemployment rate was 4.1%, and May and June payrolls were revised down by a cumulative 103k. The weakening labor market reduced expectations that the Fed would continue raising rates in September.
This has created an apparently contradictory environment for crypto: a weakening economy helps reduce expectations of further rate hikes, but economic weakness itself may also mean declining corporate profits, risk appetite, and demand for capital. Easing inflation benefits liquidity-sensitive assets, but energy and geopolitical risks could push inflation higher again.
Therefore, recent macro data is no longer simply “bullish” or “bearish,” but has created an awkward situation: the data is weak enough to prevent further rate hikes, yet not weak enough to force the Fed to ease rapidly. This is an important reason why Bitcoin has not reacted strongly to softer inflation and employment data. The market needs not “a single data point below expectations,” but a complete set of evidence confirming lower real interest rates, a weaker dollar, and sustained improvement in liquidity conditions.
IV. The most concerning issue is not falling prices, but the renewed accumulation of leverage
According to Bn’s public futures data, the notional value of open BTCUSDT contracts rose from approximately $6.49 billion in mid-July to approximately $7.03 billion on August 16, an increase of about 8.3% in one month. Meanwhile, Bitcoin’s price has generally not risen, and funding rates remained positive most of the past week. In other words: prices have not broken out significantly, but bullish leverage has begun accumulating again. Funding rates have not yet reached extreme levels of exuberance, so it cannot be said that the market will necessarily experience large-scale liquidations. However, “sideways prices, rising open interest, and positive funding rates” usually indicate that the market structure is becoming fragile. If spot capital suddenly strengthens, leveraged positions could drive prices rapidly higher; but if ETFs shift to continuous outflows, macro news deteriorates, or the area around $60k is lost, excessive long futures positions could also become fuel for the next decline. This is the greatest contradiction in the market recently: surface-level volatility has declined, but internal risk has not fallen accordingly.
V. Three possible paths for the coming weeks
Base case: Continued consolidation above $60k The most likely path remains Bitcoin fluctuating repeatedly within the broad $58k–$67k range, with $62k–$65k potentially continuing to be a dense short-term trading zone. Ethereum may continue fluctuating around $1,750–$2,000. As long as Bitcoin does not break below $60k and begin a sustained, high-volume decline, the market may maintain a bottoming structure characterized by “limited downside and no upside momentum.” This type of market often erodes sentiment more than a rapid crash, because it repeatedly creates minor breakouts and then repeatedly disappoints momentum-chasing capital.
Bullish scenario: Spot capital regains pricing power A genuine strengthening cannot be judged solely by whether Bitcoin breaks above $65k on a given day. At least three conditions should appear simultaneously: Bitcoin recovers the $67k–$70k area on rising volume; ETFs record net inflows for several consecutive weeks; and spot trading volume grows faster than open interest. If Ethereum also holds above $2,000 and ETH/BTC stops making new lows, the market may gradually shift from a “Bitcoin defensive market” toward a broader recovery in risk appetite.
Bearish scenario: Losing $60k triggers deleveraging If Bitcoin loses $60,000 and retests the June low of approximately $58.1k while open interest remains high, the market may experience a new round of forced deleveraging. At that point, close attention should be paid to whether ETFs record continuous outflows, whether funding rates turn negative, and whether the stablecoin supply continues to decline. If all three occur simultaneously, it would indicate that the decline is no longer merely a technical pullback, but may represent a new round of capital contraction. The ranges above are market-structure observation levels, not personalized trading instructions.
The next genuine major trend will not be determined by a positive news event on any single day, but will be confirmed jointly by ETFs, stablecoins, spot trading volume, and macro liquidity. $BTC
repost-content-media
  • Reward
  • 1
  • Repost
  • Share
ThisIsTranslateContent::
Just send it 👊
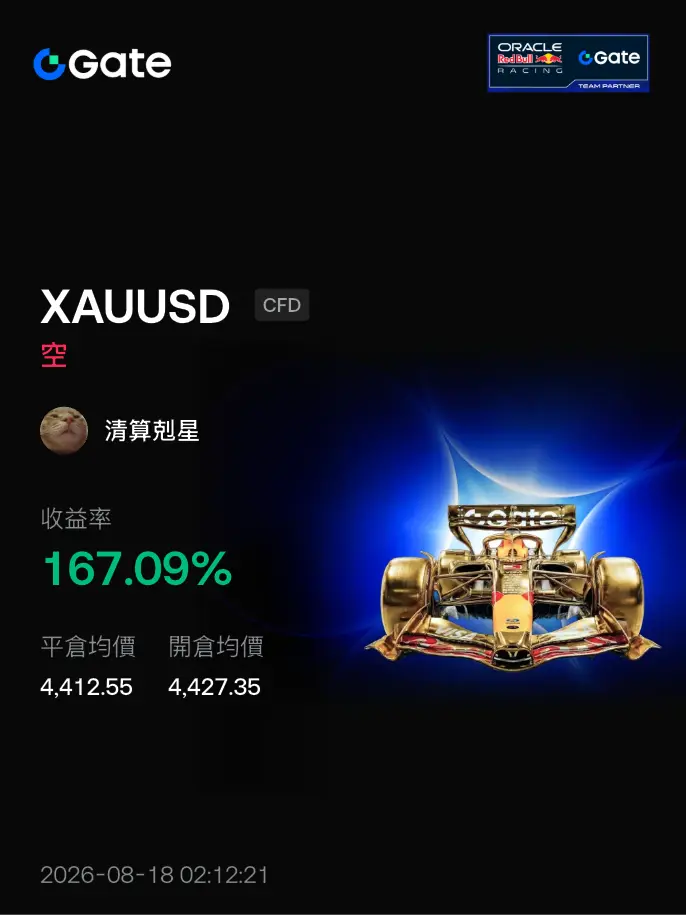
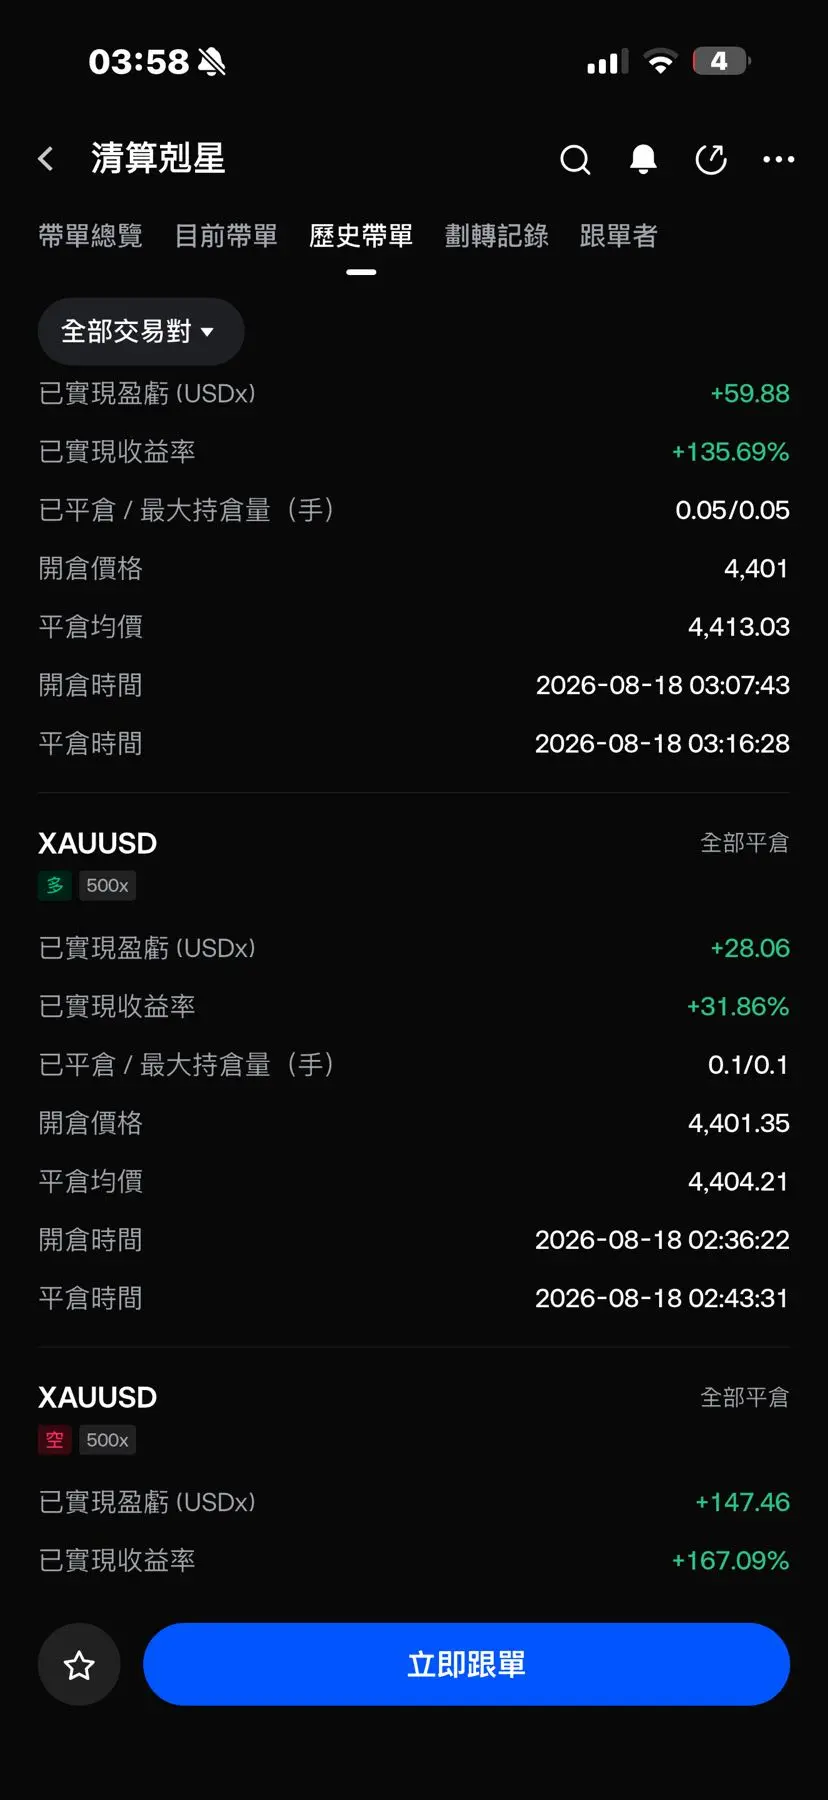
17% profit on the 15th / small daily gains add up to a very solid result; ultra-short-term trading will begin next week, while long-term positioning will proceed simultaneously
$XAU
1. U.S. data: July nonfarm payrolls and retail sales came in below expectations, inflation edged down slightly, the market lowered the probability of a Fed rate hike in September, and the U.S. Dollar Index came under pressure and retreated, supporting the medium- to long-term outlook for gold.
2. Medium- to long-term support: Continued gold purchases by global central banks and the U.S. debt deficit issue pro
XAU0.13%
View Original
post-image
post-image
  • Reward
  • 1
  • Repost
  • Share
InternetCelebrityMiMiLao:
Set a reminder for the livestream—nonstop highlights.
$SOL Signal】4H bearish continuation, short the rebound
$SOL The 4H MACD histogram at -0.0088 is contracting, the 1H buy ratio is 0.41, and selling pressure dominates the order book. The 4H Bollinger Bands are narrowing, with the price below the middle band. OI is stable, the funding rate is -0.0019%, and bears have not surrendered.
🎯Direction: Short
⚡Entry/Limit order: 75.3277 - 75.4700
🛑Stop-loss: 76.2247
🚀Target 1: 74.3380
🚀Target 2: 73.7719
🛡️Trade management:
- Execution strategy: After reaching Target 1, reduce the position by 50% and move the stop-loss up to breakeven. If the price
SOL0.01%
BTC0.00%
ETH-0.03%
DOS-9.13%
View Original
post-image
  • Reward
  • Comment
  • Repost
  • Share
#TetherReservesExceedLiabilitiesBy6.8B 💰 #TetherReservesExceedLiabilitiesBy6.8B
Tether’s latest reserve position highlights a $6.8 billion cushion over liabilities, adding another layer of confidence around the stability of the world’s largest stablecoin.
📊 Stronger reserves can improve market confidence
💵 A healthy buffer supports USDT’s resilience
🌐 Transparency remains crucial for the stablecoin ecosystem
As stablecoins become increasingly important to global crypto markets, reserve quality and transparency matter more than ever.
#Tether #USDT #Stablecoins
USDT0.00%
post-image
  • Reward
  • Comment
  • Repost
  • Share
You 🐶🌞 haters, did anyone come out to thank me when they made money? How can anyone win every trade? If you’re going to bash me when you lose, you’ll all be blocked and muted. If your poor position management means you can’t handle the losses, cut your losses yourself—don’t bother me.
The market is unpredictable; manage your positions and control your greed!
View Original
post-image
post-image
  • Reward
  • 12
  • Repost
  • Share
PopoCarmen:
Stay firm and HODL💎
View More
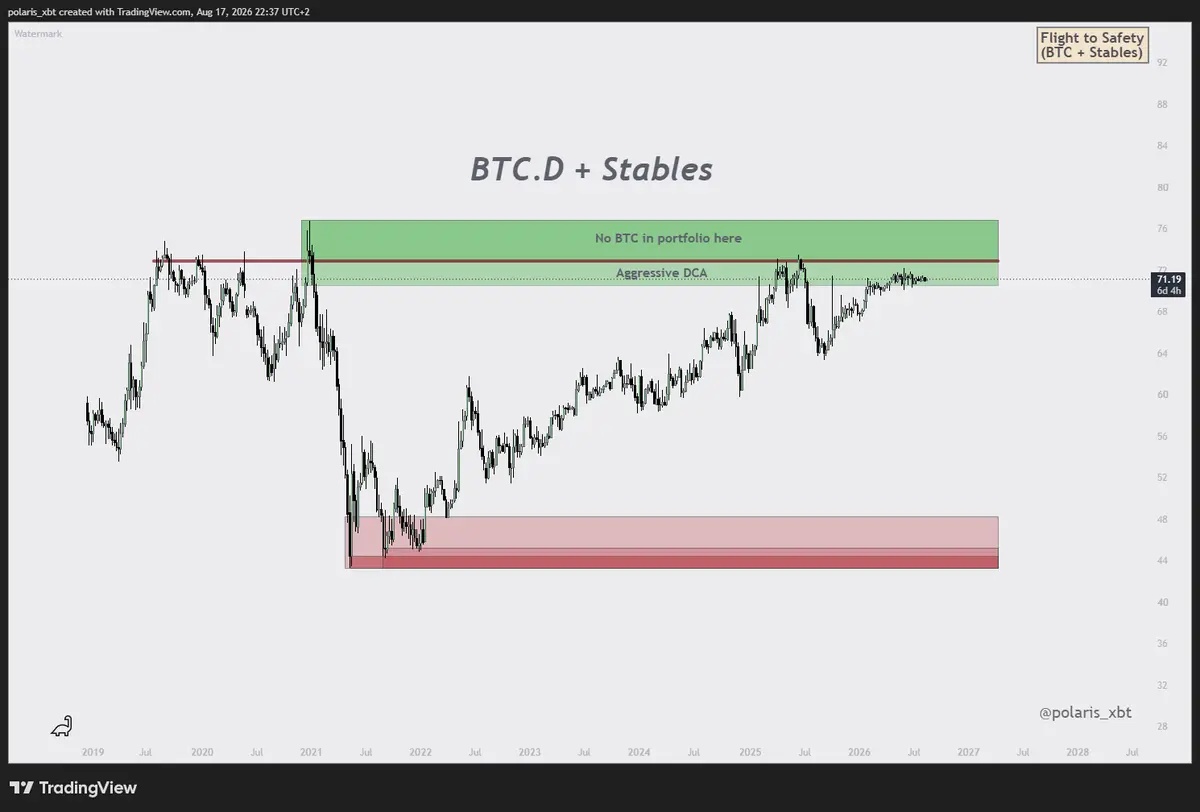
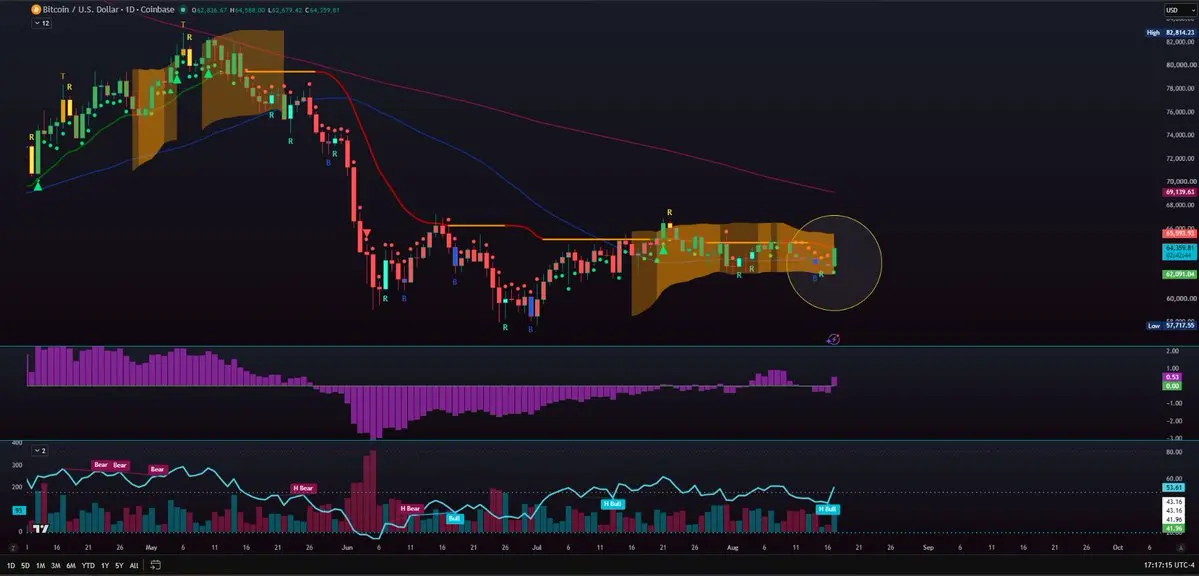
JUST IN: Prominent trader argues BTC needs to reclaim and hold the 200-day moving average near $69.5k to officially signal a new bull phase, after reclaiming Mayer Multiple +0.8. If confirmed, this could mark a market regime shift. $BTC
BTC0.00%
post-image
  • Reward
  • Comment
  • Repost
  • Share
#股票交易分享挑战 Tesla (TSLA) has recently shown a volatile recovery in its share price, influenced by multiple factors including divergent performance, market sentiment, and capital flows. Short-term market volatility remains high, while long-term support still comes from expectations for new businesses such as AI and robotics. Below is an analysis of Tesla’s latest market performance and core logic:
I. Latest Market Performance and Trend Characteristics
· Recent share price performance: In mid-August 2026, Tesla’s share price fluctuated between $327 and $342 (for example, closing at $339.96 on Augu
TSLA0.65%
View Original
post-image
  • Reward
  • 6
  • Repost
  • Share
HighAmbition:
Full send 👊
View More
$H surged 36% in 24 hours, shooting directly from 0.1169 to 0.1634, with $78 million in trading volume. Do you think it was a shitcoin pump? Wrong—this is a textbook case of macro liquidity spillover. Although last night’s Federal Reserve meeting minutes contained no new action, the dot plot hinted at room for one more rate hike this year. After the 10-year Treasury yield surged above 4.8% and then pulled back, Nasdaq futures first fell and then rallied. This “bad news fully priced in” scenario transmitted directly to the crypto market—funds flowed out of major coins in search of higher elast
NAS100-0.35%
BTC0.00%
USIDX-0.31%
XCU0.44%
View Original
post-image
post-image
post-image
  • Reward
  • Comment
  • Repost
  • Share
🔥@Intraday Free Strategy Levels👇
🔥@Long Entry Levels (the second entry level + short entry level + take-profit level are in the pinned subscription post; both long- and short-term spot setups are also in the pinned post)
===========
62800 long, 62500 long, Sun 61100
1865 long, 1845 long, loss 1805
#GateCard三重升级
View Original
post-image
post-image
  • Reward
  • Comment
  • Repost
  • Share
$SOL Signal】Short opportunity, 1H MACD bearish expansion
$SOL Buy-side depth dominates, but the price has not moved higher accordingly. Hovering below EMA20. 1H MACD bearish expansion, 4H MACD downside momentum narrowing. RSI 46.33, rebound lacks strength. 1H Bollinger Bands narrowing to 75.24-75.65, with a move imminent. OI stable, funding rate -0.0029%, shorts are not yet crowded.
🎯Direction: Short
⚡Entry/limit order: 75.1743 - 75.3200
🛑Stop-loss: 76.0732
🚀Target 1: 74.1902
🚀Target 2: 73.6253
🛡️Trade management:
- Execution strategy: After reaching Target 1, reduce the position by 50%
SOL0.01%
DOS-9.13%
View Original
post-image
  • Reward
  • Comment
  • Repost
  • Share
#晒出我的合约收益
$LAB Caught a wave of the cascade, which was pretty good.
LAB-4.64%
View Original
post-image
Neverccc
0/50
Futures
30D ROITrader PnL
+4.58%
+46.39
Win Rate
--
AUM
0
Copiers PnL
--
  • Reward
  • Comment
  • Repost
  • Share
I found SpikePanel, a very useful tool for U.S. stocks. You guys should give it a try.
This tool directly filters out the noise on X and Reddit, organizing what the market is discussing, which stocks are suddenly gaining traction, and whose opinions are more credible into an easy-to-understand dashboard.
Here are a few free and practical features I’m using and liking:
1. Trending Discussions
Useful for discovering stocks with discussion volume suddenly higher than usual and quickly identifying new market narratives.
2. Long/Short Opinions and Sources
View influencers’ opinions, verify their pa
View Original
post-image
post-image
post-image
post-image
  • Reward
  • Comment
  • Repost
  • Share
$AAVE SHORT
Entry: 86.00 – 86.05
Stop Loss: 87.75
TP: 84.30 - 82.58 - 80.86
AAVE-1.17%
post-image
  • Reward
  • Comment
  • Repost
  • Share
Load More

Join 40 M users in our growing community

⚡️ Join 40 M users in the crypto craze discussion
💬 Engage with your favorite top creators
👍 See what interests you
  • Pinned