#USIranTalksPostponed
The highly anticipated peace talks between the United States and Iran, scheduled to take place in Geneva on June 19, 2026, have been officially postponed. This unexpected development has sent shockwaves through global financial markets, creating significant uncertainty and volatility across multiple asset classes including cryptocurrencies, precious metals, and energy commodities.
Background of the Postponement
The planned diplomatic meeting between US and Iranian negotiators was called off following Vice President JD Vance's cancellation of his trip to Switzerland. According to reports from Reuters and NPR, the postponement stems from ongoing Israeli military operations in Lebanon, which Iran cited as a direct breach of the framework underpinning the peace negotiations. The Swiss Foreign Ministry confirmed that talks involving the US, Iran, Qatar, and Pakistan have been postponed indefinitely, with no new date confirmed at this time.
Iran's delegation had initially demanded to see concrete signs of the US implementing the interim deal before proceeding with technical discussions. The semi-official Tasnim news agency reported that Iran needed confirmation that Washington would honor its commitments under the memorandum of understanding signed earlier this week. This hesitation, combined with continued Israeli strikes in southern Lebanon, created an impasse that led to the postponement.
Impact on Bitcoin and Cryptocurrency Markets
Bitcoin has experienced significant volatility in response to the geopolitical uncertainty. As of June 19, 2026, Bitcoin is trading around $62,500 to $64,230, having declined from recent highs above $65,800. The postponement triggered approximately $192 million in liquidations across major cryptocurrencies, with Ethereum leading losses followed by Bitcoin and XRP.
The cryptocurrency market's reaction reflects broader risk-off sentiment among investors. When geopolitical tensions escalate, traders typically shift away from risk assets toward safer havens. Bitcoin, despite its reputation as digital gold, has been trading in lockstep with traditional risk assets like the Nasdaq and S&P 500 rather than serving as a true safe haven during this crisis.
Technical analysis shows Bitcoin breaking below the 0.382 Fibonacci level at $64,968, with the Supertrend indicator flipping bearish at $68,399. The 0.236 Fibonacci level at $62,725 represents the last defense before potentially retesting the June absolute low at $59,098. Market analysts are closely monitoring these levels as the uncertainty surrounding US-Iran negotiations continues.
The crypto market had initially rallied on June 15 when news of a preliminary peace agreement emerged, with Bitcoin recovering above $64,000. However, the postponement has reversed these gains as traders reassess the likelihood of a lasting resolution. The pattern demonstrates how sensitive cryptocurrency prices remain to geopolitical developments, particularly those involving major oil-producing regions.
Impact on Gold Markets
Gold prices have shown mixed reactions to the postponement news. After initially rallying above $4,300 per ounce on optimism about the peace deal, gold has since retreated to approximately $4,147 to $4,184 per ounce as of June 19, 2026. The precious metal is currently on track for its third consecutive weekly decline.
The initial peace agreement had caused gold to decline as lower oil prices reduced inflation expectations. However, the postponement has reintroduced uncertainty, which typically supports gold prices. Spot gold fell 1.38% on June 19, trading at $4,151.74 per ounce, down from recent highs above $4,300.
Goldman Sachs maintains its year-end target of $4,900 per ounce for gold, though this forecast has been revised down from an earlier $5,400 projection. JPMorgan targets $5,000 per ounce with $6,000 as a longer-term possibility. These targets reflect expectations that geopolitical tensions and inflation concerns will ultimately support precious metal prices.
Technical analysis indicates key support levels for gold at $4,100, with deeper support at $4,023 and the psychologically important $4,000 level. Resistance is seen at $4,170, $4,200, and $4,300. Market analysts note that momentum remains bearish for gold in the near term, though safe-haven demand could resurface if tensions escalate further.
Impact on Oil Markets
Oil markets have experienced significant volatility surrounding the peace talks. Brent crude is currently trading around $79.56 to $80.38 per barrel, having fallen from approximately $94 per barrel at the start of June 2026. The postponement has created uncertainty about when Iranian oil supplies will return to global markets.
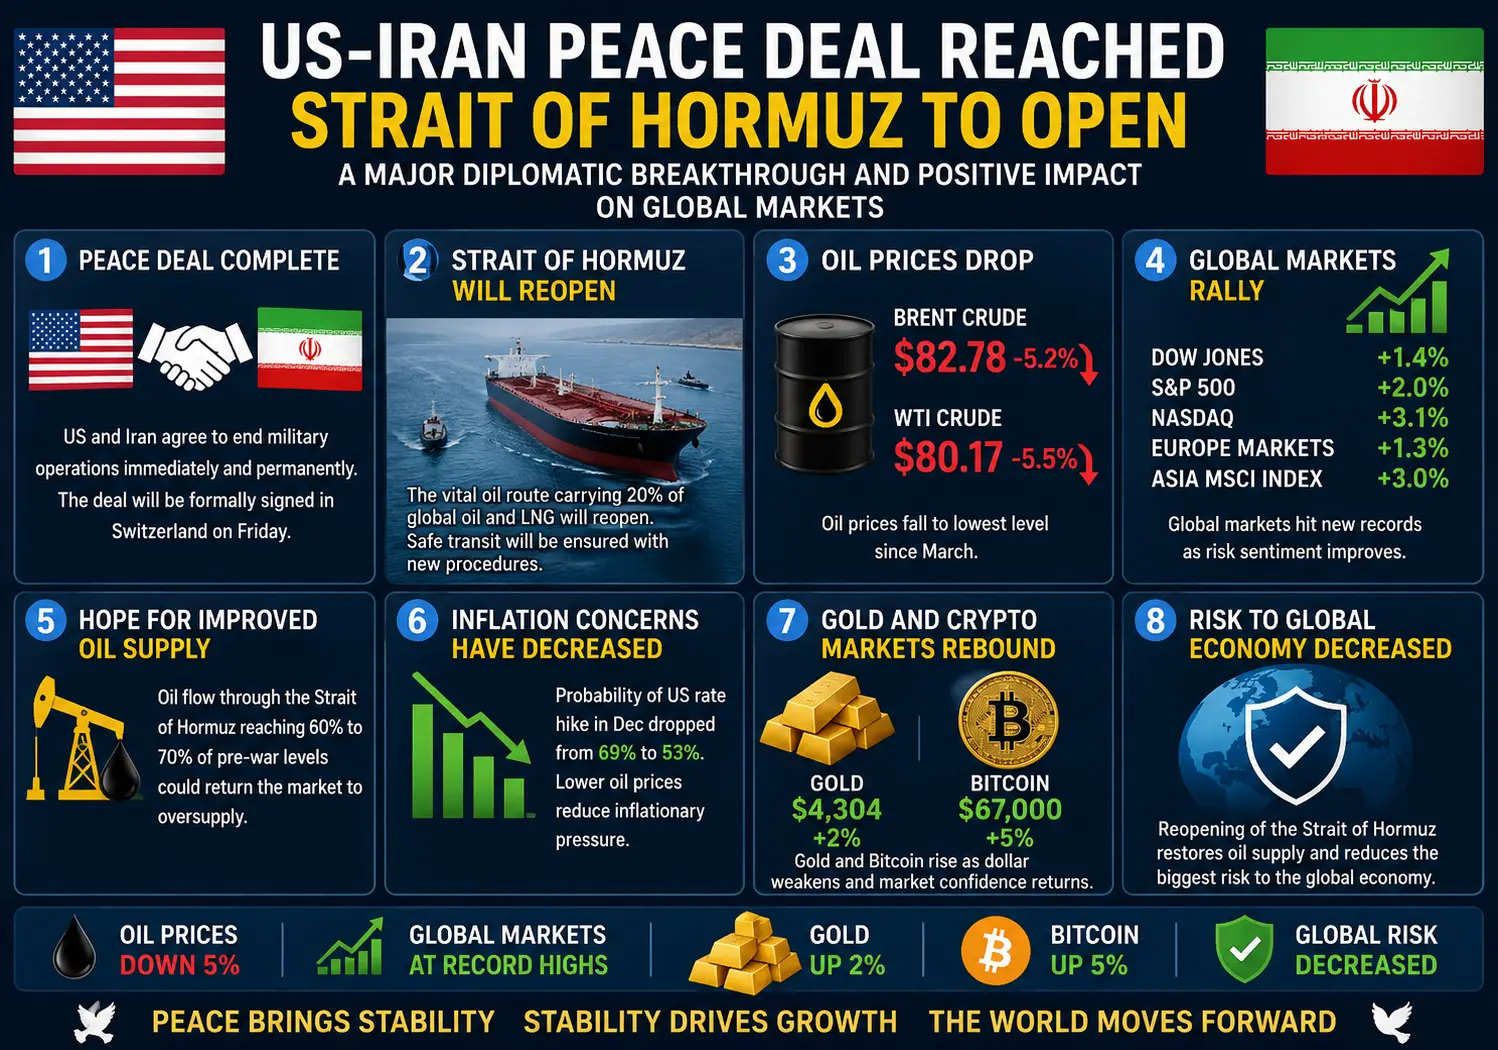
The preliminary peace agreement signed earlier in the week had caused oil prices to drop nearly 5% to their lowest levels since March 4, as markets anticipated the reopening of the Strait of Hormuz. This vital waterway typically carries one-fifth of the world's oil supply, and its closure during the conflict had removed approximately 14 million barrels per day from global supply.
However, the postponement has raised questions about the timeline for restoring normal traffic through the strait. While some oil tankers have begun moving through the Strait of Hormuz following the interim deal, full restoration of supply may take longer than initially anticipated. Analysts suggest that prices are unlikely to fall to pre-crisis levels until stockpiles of crude oil and gasoline are replenished, which may not occur before the end of 2026.
The national average gasoline price in the United States has fallen below $4 per gallon for the first time in nearly three months, reflecting the initial optimism about the peace deal. However, sustained progress in negotiations will be necessary to maintain these lower prices.
Market Outlook and Key Factors to Monitor
Investors and traders should monitor several critical variables in the coming days and weeks:
1. **Diplomatic Developments**: The status of US-Iran diplomatic channels remains the primary driver of market sentiment. Any announcement regarding rescheduled talks or breakthroughs in negotiations will likely trigger significant market movements.
2. **Israeli Military Activity**: Continued Israeli operations in Lebanon represent a major obstacle to peace negotiations. A de-escalation in southern Lebanon would improve prospects for successful talks.
3. **Federal Reserve Policy**: The US Federal Reserve's hawkish stance, with nine of nineteen policymakers now expecting rate hikes in 2026, adds another layer of complexity to market dynamics. Higher interest rates typically pressure both cryptocurrencies and gold.
4. **Oil Supply Restoration**: The pace at which Iranian oil returns to global markets will significantly impact energy prices and broader inflation expectations.
5. **Safe-Haven Flows**: Traditional safe-haven assets like gold and the US dollar may benefit from continued uncertainty, while risk assets including cryptocurrencies could face additional pressure.
Conclusion
The postponement of US-Iran peace talks has introduced significant uncertainty into global markets, affecting Bitcoin, gold, and oil prices in distinct ways. Bitcoin has declined toward $62,500 amid risk-off sentiment and liquidation events. Gold has retreated to approximately $4,150 per ounce despite its safe-haven status, weighed down by Federal Reserve policy expectations. Oil prices remain volatile around $80 per barrel as markets assess the timeline for restoring Iranian supply.
The situation remains fluid, with markets highly sensitive to any developments regarding the rescheduling of talks or changes in regional tensions. Investors should maintain heightened awareness of geopolitical risks while monitoring technical levels across these key asset classes. The coming days will be critical in determining whether diplomatic efforts can get back on track or whether markets must price in an extended period of uncertainty.@Gate_Square
The highly anticipated peace talks between the United States and Iran, scheduled to take place in Geneva on June 19, 2026, have been officially postponed. This unexpected development has sent shockwaves through global financial markets, creating significant uncertainty and volatility across multiple asset classes including cryptocurrencies, precious metals, and energy commodities.
Background of the Postponement
The planned diplomatic meeting between US and Iranian negotiators was called off following Vice President JD Vance's cancellation of his trip to Switzerland. According to reports from Reuters and NPR, the postponement stems from ongoing Israeli military operations in Lebanon, which Iran cited as a direct breach of the framework underpinning the peace negotiations. The Swiss Foreign Ministry confirmed that talks involving the US, Iran, Qatar, and Pakistan have been postponed indefinitely, with no new date confirmed at this time.
Iran's delegation had initially demanded to see concrete signs of the US implementing the interim deal before proceeding with technical discussions. The semi-official Tasnim news agency reported that Iran needed confirmation that Washington would honor its commitments under the memorandum of understanding signed earlier this week. This hesitation, combined with continued Israeli strikes in southern Lebanon, created an impasse that led to the postponement.
Impact on Bitcoin and Cryptocurrency Markets
Bitcoin has experienced significant volatility in response to the geopolitical uncertainty. As of June 19, 2026, Bitcoin is trading around $62,500 to $64,230, having declined from recent highs above $65,800. The postponement triggered approximately $192 million in liquidations across major cryptocurrencies, with Ethereum leading losses followed by Bitcoin and XRP.
The cryptocurrency market's reaction reflects broader risk-off sentiment among investors. When geopolitical tensions escalate, traders typically shift away from risk assets toward safer havens. Bitcoin, despite its reputation as digital gold, has been trading in lockstep with traditional risk assets like the Nasdaq and S&P 500 rather than serving as a true safe haven during this crisis.
Technical analysis shows Bitcoin breaking below the 0.382 Fibonacci level at $64,968, with the Supertrend indicator flipping bearish at $68,399. The 0.236 Fibonacci level at $62,725 represents the last defense before potentially retesting the June absolute low at $59,098. Market analysts are closely monitoring these levels as the uncertainty surrounding US-Iran negotiations continues.
The crypto market had initially rallied on June 15 when news of a preliminary peace agreement emerged, with Bitcoin recovering above $64,000. However, the postponement has reversed these gains as traders reassess the likelihood of a lasting resolution. The pattern demonstrates how sensitive cryptocurrency prices remain to geopolitical developments, particularly those involving major oil-producing regions.
Impact on Gold Markets
Gold prices have shown mixed reactions to the postponement news. After initially rallying above $4,300 per ounce on optimism about the peace deal, gold has since retreated to approximately $4,147 to $4,184 per ounce as of June 19, 2026. The precious metal is currently on track for its third consecutive weekly decline.
The initial peace agreement had caused gold to decline as lower oil prices reduced inflation expectations. However, the postponement has reintroduced uncertainty, which typically supports gold prices. Spot gold fell 1.38% on June 19, trading at $4,151.74 per ounce, down from recent highs above $4,300.
Goldman Sachs maintains its year-end target of $4,900 per ounce for gold, though this forecast has been revised down from an earlier $5,400 projection. JPMorgan targets $5,000 per ounce with $6,000 as a longer-term possibility. These targets reflect expectations that geopolitical tensions and inflation concerns will ultimately support precious metal prices.
Technical analysis indicates key support levels for gold at $4,100, with deeper support at $4,023 and the psychologically important $4,000 level. Resistance is seen at $4,170, $4,200, and $4,300. Market analysts note that momentum remains bearish for gold in the near term, though safe-haven demand could resurface if tensions escalate further.
Impact on Oil Markets
Oil markets have experienced significant volatility surrounding the peace talks. Brent crude is currently trading around $79.56 to $80.38 per barrel, having fallen from approximately $94 per barrel at the start of June 2026. The postponement has created uncertainty about when Iranian oil supplies will return to global markets.
The preliminary peace agreement signed earlier in the week had caused oil prices to drop nearly 5% to their lowest levels since March 4, as markets anticipated the reopening of the Strait of Hormuz. This vital waterway typically carries one-fifth of the world's oil supply, and its closure during the conflict had removed approximately 14 million barrels per day from global supply.
However, the postponement has raised questions about the timeline for restoring normal traffic through the strait. While some oil tankers have begun moving through the Strait of Hormuz following the interim deal, full restoration of supply may take longer than initially anticipated. Analysts suggest that prices are unlikely to fall to pre-crisis levels until stockpiles of crude oil and gasoline are replenished, which may not occur before the end of 2026.
The national average gasoline price in the United States has fallen below $4 per gallon for the first time in nearly three months, reflecting the initial optimism about the peace deal. However, sustained progress in negotiations will be necessary to maintain these lower prices.
Market Outlook and Key Factors to Monitor
Investors and traders should monitor several critical variables in the coming days and weeks:
1. **Diplomatic Developments**: The status of US-Iran diplomatic channels remains the primary driver of market sentiment. Any announcement regarding rescheduled talks or breakthroughs in negotiations will likely trigger significant market movements.
2. **Israeli Military Activity**: Continued Israeli operations in Lebanon represent a major obstacle to peace negotiations. A de-escalation in southern Lebanon would improve prospects for successful talks.
3. **Federal Reserve Policy**: The US Federal Reserve's hawkish stance, with nine of nineteen policymakers now expecting rate hikes in 2026, adds another layer of complexity to market dynamics. Higher interest rates typically pressure both cryptocurrencies and gold.
4. **Oil Supply Restoration**: The pace at which Iranian oil returns to global markets will significantly impact energy prices and broader inflation expectations.
5. **Safe-Haven Flows**: Traditional safe-haven assets like gold and the US dollar may benefit from continued uncertainty, while risk assets including cryptocurrencies could face additional pressure.
Conclusion
The postponement of US-Iran peace talks has introduced significant uncertainty into global markets, affecting Bitcoin, gold, and oil prices in distinct ways. Bitcoin has declined toward $62,500 amid risk-off sentiment and liquidation events. Gold has retreated to approximately $4,150 per ounce despite its safe-haven status, weighed down by Federal Reserve policy expectations. Oil prices remain volatile around $80 per barrel as markets assess the timeline for restoring Iranian supply.
The situation remains fluid, with markets highly sensitive to any developments regarding the rescheduling of talks or changes in regional tensions. Investors should maintain heightened awareness of geopolitical risks while monitoring technical levels across these key asset classes. The coming days will be critical in determining whether diplomatic efforts can get back on track or whether markets must price in an extended period of uncertainty.@Gate_Square