Square
Following
Hot
News
Profile
Share your thoughts
placeholder
Article
🚨 LATEST: Stripe partners with Plasma to introduce multi-currency stablecoin cards, allowing users to spend in USD, EUR, BRL, MXN and COP.
The cards will support payments in local currencies without requiring users to first convert their funds into U.S. dollars.
Another major step toward global stablecoin adoption.
XPL+8.96%
$MU
As you can see, after my bottom call at $104, it never fell below certain moving averages. Now it has pulled back right to them. It must hold this support line
post-image
MU+1.93%
Layout: Bitcoin, Ethereum, Dogecoin
live-cover
LIVE880
  • 4
US oil is pumping
And you still believe in the BTC pump?
BTC+0.60%
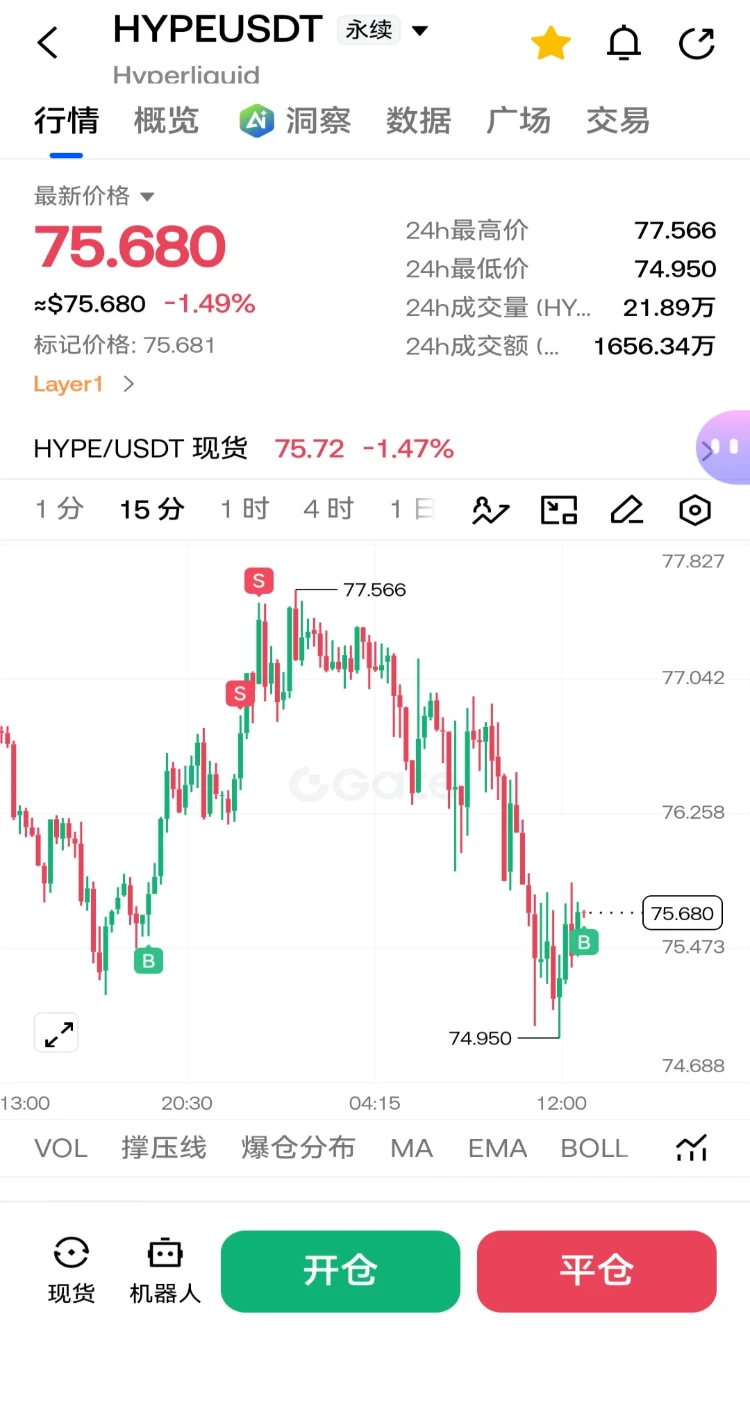
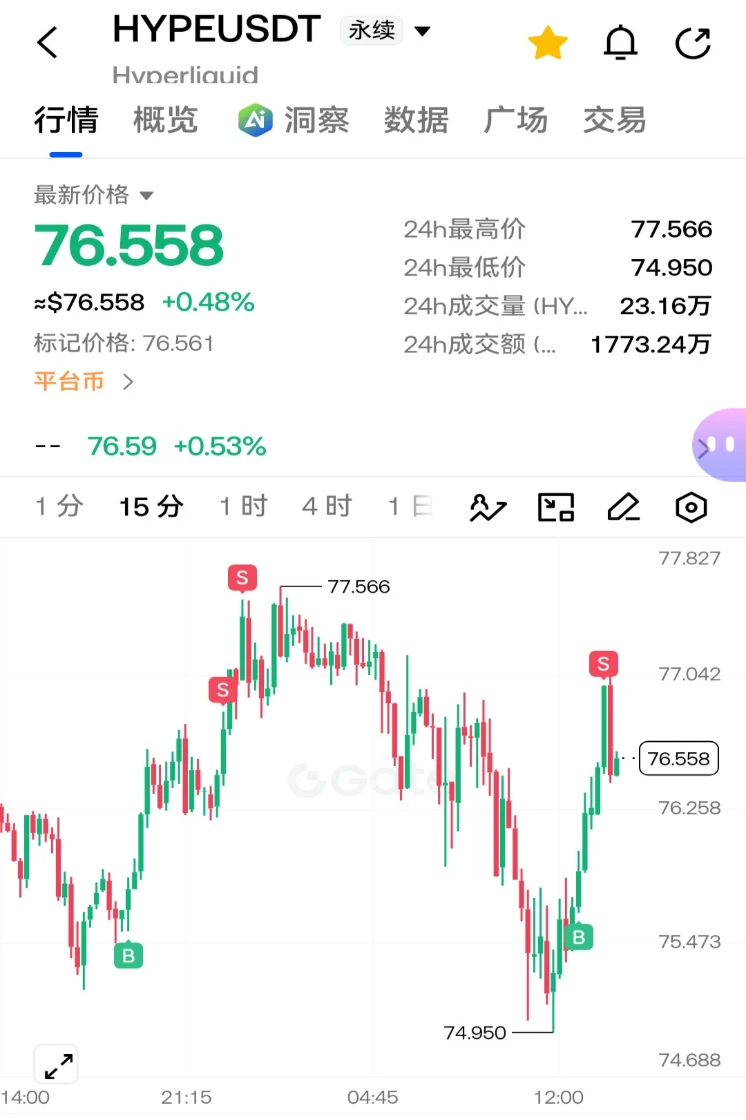
HYPERLIQUID $HYPE REJECTING MOVING AVERAGE RESISTANCE ARE BEARS TARGETING $78.06 NEXT?
Pair: $HYPE /USDT
Direction: SHORT
Entry Price: 81.62
Target Levels (Take Profit)
TP 1: 79.48 2.62%
TP 2: 78.06 4.36%
Stop Loss
SL: 84.47
Technical Breakdown
HYPE ($81.565) faced strong sell-side rejection following an impulsive upward push, printing a topping wick right at overhead structural resistance. This price action confirms persistent seller defense and sets up a clean continuation toward lower targets.
Price action tested areas above short-term moving averages before meeting heavy distribution
HYPE+0.83%
I turned off the $ZEC gainers-and-losers rankings first, and only one issue is left on the chart: $ZEC remains strong, while the crowded positioning is already out in the open.
$ZEC is currently at 1,241.91, up 8.09% over 24 hours. The 1-hour support is 1,075, resistance is 1,248.4, and current volume is 0.55 times the average volume of nearly 20 candles.
My view for now is this: I acknowledge that the trend is strong, but what matters next is not how much higher it can go, but whether anyone steps in during the first pullback. Moving higher does not count as a win just because it touches 1,2
post-image
ZEC+7.81%
US economic data delivered a clear message: inflation is running hotter than expected, yet consumer demand and parts of the manufacturing sector remain surprisingly resilient.
🔹 This combination creates a difficult position for the Federal Reserve. After Wednesday's above-forecast CPI, today's producer-level data reinforced the case for rates staying higher for longer.
📊 The data on the table:
🔹 Core PPI: +0.7% MoM (forecast: +0.3%). The largest monthly increase since March 2022.
▪️ Headline PPI: +1.3% MoM (forecast: +0.6%), +6.3% YoY (forecast: +5.3%). The highest annual reading since Dece
post-image
User_any
✨ US equity futures traded mixed on October 15 as technology and AI-related stocks faced renewed pressure.
🔹 Futures tied to the tech-heavy Nasdaq 100 fell about 1.2%, while S&P 500 futures slipped 0.3%. Dow Jones Industrial Average futures held relatively firm, trading slightly positive. The divergence reflects a selective risk rotation rather than a uniform selloff.
📊 The data behind the market's sharp reaction:
🔹 Inflation pressures are broadening
▪️ US September PPI rose 1.3% month-over-month and 6.3% year-over-year, far exceeding the 5.3% forecast and marking the largest annual increase since December 2022.
▪️ Core PPI, excluding food and energy, rose 0.7% MoM and 5.0% YoY, also above expectations.
▪️ The September CPI report released a day earlier showed headline inflation accelerating to 3.7% YoY, with core CPI at 2.6%.
▪️ Energy prices surged 10.8%, accounting for over 80% of the goods price increase, with gasoline jumping 20.3%.
🔹 AI and semiconductor stocks face a reality check
▪️ Memory chip names continued to slide, with Micron down about 4% and AMD falling roughly 3.5% premarket. CoreWeave dropped another 5% after plunging 15% on Wednesday.
▪️ Investor concerns focus on whether the massive capital expenditures required for AI data centers will generate sufficient returns, particularly as debt-financed expansion raises sustainability questions.
▪️ Reports of progress by China's CXMT on next-generation DRAM technology have also pressured memory stocks by raising competitive concerns.
🔹 TSMC's cautious 2027 guidance amplifies uncertainty
▪️ TSMC reported its sixth consecutive quarter of record profit, with net income up 69% YoY to NT$763.1 billion. It raised its 2026 revenue growth forecast to approximately 44%.
▪️ However, CEO C.C. Wei struck a cautious tone on 2027, citing macroeconomic uncertainties and rising component costs affecting price-sensitive end markets.
▪️ The cautious outlook, despite strong AI demand, reinforced concerns about future growth visibility across the semiconductor supply chain.
⚖️ Structural perspective:
🔹 From a long-term structural perspective, the current market dynamic reflects a recalibration of valuations rather than a deterioration in underlying industrial demand. TSMC's cautious 2027 planning is best understood as prudent expectation management amid macro uncertainty, not a signal of weakening AI fundamentals.
▪️ The transmission chain from energy costs to broader pricing is becoming clearer: crude oil → gasoline → transportation and warehousing services → wholesale and retail margins. This broadening inflation narrative keeps the Fed's restrictive policy path in focus, pressuring high-duration growth assets.
▪️ Meanwhile, capital is rotating defensively — into Treasuries and dividend-paying instruments — rather than exiting risk entirely. The 10-year Treasury yield dropped sharply to around 5.05%, a three-week low, reflecting strong safe-haven demand.
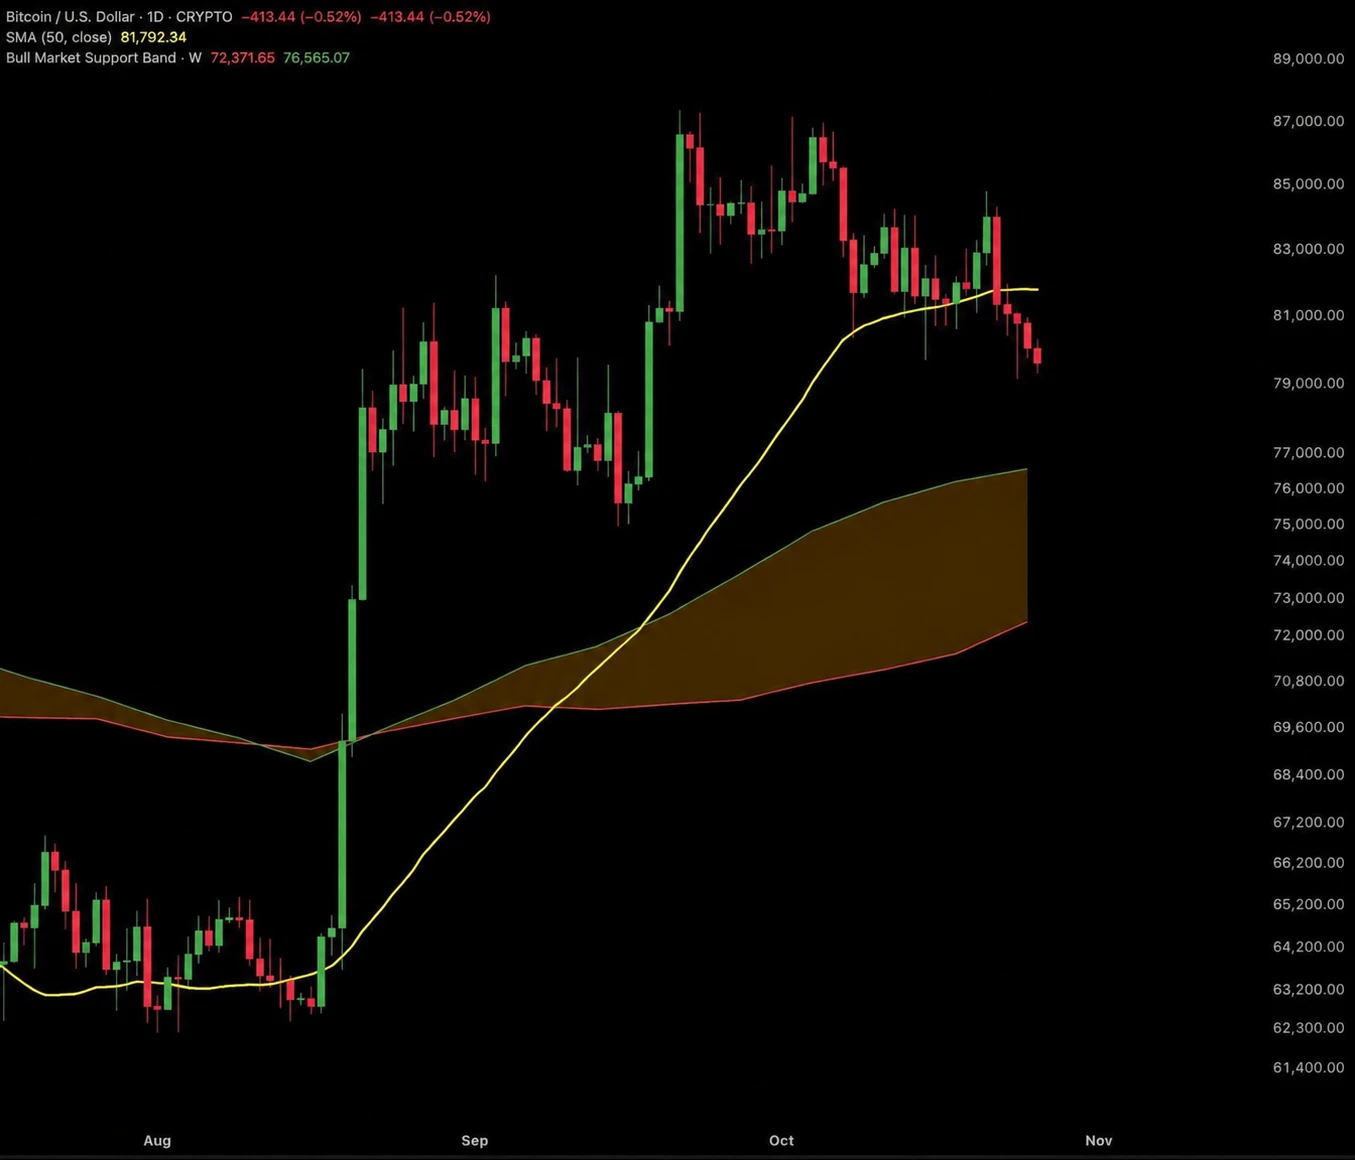
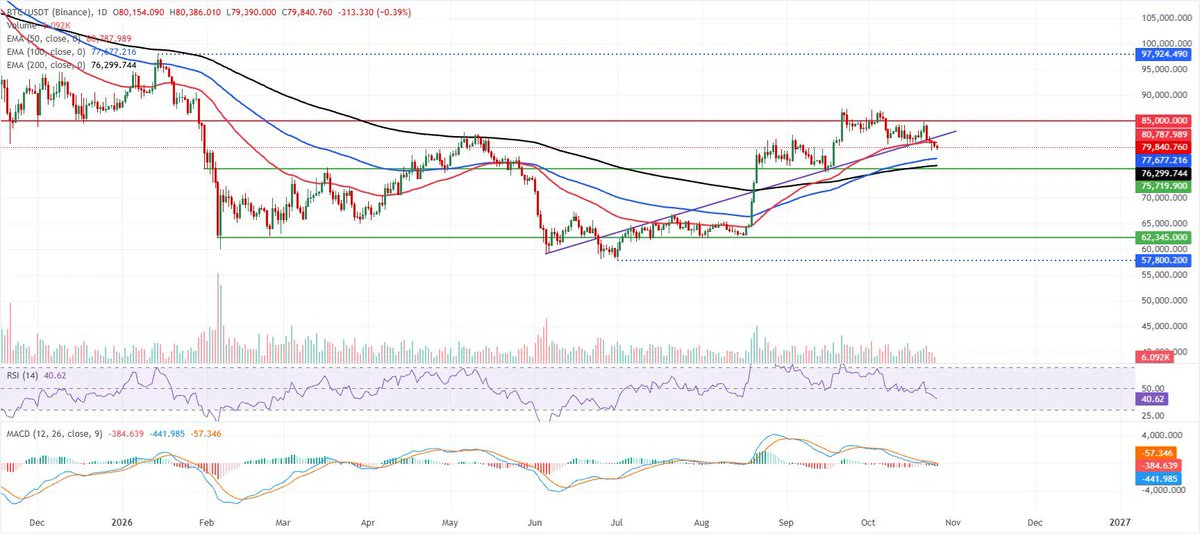
▪️ Bitcoin fell to near $80,500, down about 3.6% over 24 hours, with market-wide liquidations approaching $977 million, predominantly from long positions. The $80,000 level remains a critical support zone to watch.
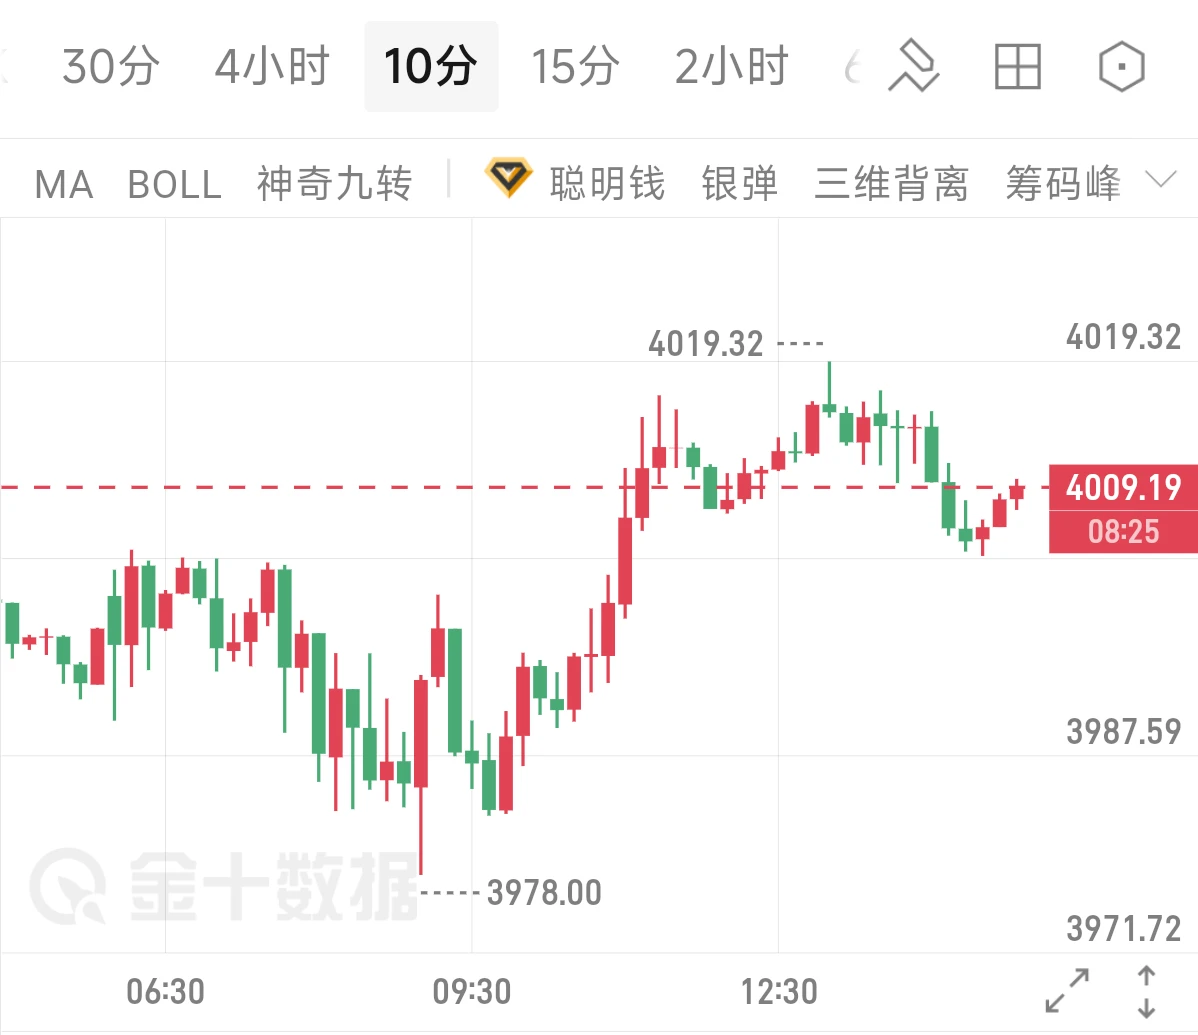
▪️ Gold recovered above $4,150, up over 1.3%, as falling yields and a softer dollar supported precious metals despite the hot inflation print.
▪️ The dollar index retreated from its 18-month high toward 102.0, giving back most of its post-CPI gains as rate-hike expectations eased slightly.
🔹 The key variable ahead is whether the Fed signals patience at its October 27-28 meeting or adopts a firmer tone. Markets currently price roughly a 49% probability of an October hike, up sharply from about 22% before the CPI data. Until that guidance arrives, markets are likely to remain in a selective recalibration phase.
💬 When inflation pressures broaden beyond energy and AI valuations face scrutiny, do you prioritize defensive positioning or long-term structural exposure? 👇
#USStocks #Inflation #USSeptemberPPIBeatsExpectations
#美国9月PPI大超预期 #USSeptemberCPITopsEstimates
Not financial advice.
repost-content-media
BTC+0.60%
ETH+1.40%
XAU+1.66%
XAG+3.32%
XRP+1.33%
  • 2
  • 2
BREAKING: Aster now lets traders deposit and withdraw BTC directly on the Bitcoin network. It adds to existing support for wrapped BTC on EVM chains, on an exchange holding $762.31M in deposits.
@Aster_DEX
ASTER+1.27%
BTC+0.60%
#美国9月PPI大超预期 ✨ US PPI Inflation Surges to 6.3%, the Highest Since Late 2022
🔹 The US September Producer Price Index (PPI) rose 1.3% month-over-month and 6.3% year-over-year, significantly exceeding the consensus estimate of 5.3%. This marks the largest monthly increase since March 2022 and the highest annual reading since December 2022.
📊 The data behind the print:
🔹 Core PPI: Excluding food and energy, core PPI rose 0.7% MoM and 5.0% YoY, both above expectations.
▪️ Energy: Energy prices surged 10.8%, accounting for more than 80% of the broad-based increase in goods prices. Gasoline jumpe
post-image
BTC+0.60%
SPX500+0.23%
NAS100+0.08%
  • 2
  • 2
Which step is $CRCLB’s latest rally most likely to fool you on?
$CRCLB There is a very typical debate right now: one side uses +8.96% over 24 hours to prove the direction, while the other counters with key levels. I’m not taking sides based on the rise or fall for now, because $CRCLB remains strong, while the crowded positioning is already out in the open and has yet to provide a complete answer. I acknowledge that the trend is strong, but what matters next is not how much higher it can surge, but whether anyone steps in during the first pullback.
Laying out the chart, the current price is 86.
post-image
$ETH Long Catches a Fresh Flush Partial Bounce, No Momentum Confirmation
Pair: $ETH /USDT
Direction: LONG
Entry Zone: 2364.29
Take Profit:
- TP1: 2423.13 +2.5%
- TP2: 2462.36 +4.1%
- TP3: 2521.20 +6.6%
Stop Loss: 2285.83
Chart Structure:
- ETH declined steadily from ~2480 through MA7, MA25, and MA99, then printed a sharp flush candle down to ~2285-2300 before bouncing to current price
- Price remains well below all three moving averages this is a bounce attempt within an intact downtrend, not a reclaim
- RSI(14) dropped to ~25 at the flush low and has only partially recovered to the high-
ETH+1.40%
  • 2
Bitcoin is BACK over $82,000!!
We are so back!!
post-image
BTC+0.60%
The Fear & Greed Index is only 53, yet $ZEC has already risen above the Bollinger upper band at 1218.45, with the current price at 1229.64—this is the most unusual detail in today’s market: sentiment is merely neutral, but the price has reached the top of the channel, indicating that bulls actively bought it up rather than being driven by sentiment.
To determine whether the trend is healthy using moving averages, look at two things: alignment and slope. MA5=1194.01 is above MA20=1129.5, and the two lines are diverging upward, forming a standard bullish alignment; the MACD histogram is +18.93,
post-image
ZEC+7.81%
OSMO+18.36%
ZAMA+11.89%
$LYN
📉 Open interest has fallen flatter than my wallet, I'm dying laughing😂 This wave of bearish pressure is enough to crush a camel, but I refuse to believe it and will tough it out to the end💪 LYN's price action is just like an overworked employee who stays up late working overtime but still can't get a raise—frustrated but stubborn😤 Patiently wait for the wind to come; it should be about time for a rebound, so don't rush to admit defeat😌
post-image
LYN-4.84%
I need a memecoin
Low market cap
Shill me tickers $________? 🔥🚀💸
#100x #1000x #memecoin #Gems
post-image
MEME+0.97%
GEMS+1.25%
  • 1
$ETH Are You Ready For This?
NFA, DYOR ⚠️
#Crypto #Trading #ETH
post-image
🚀 GT/USDT Technical Insights: Is GateToken Preparing for a Bullish Reversal at $10.00 Support?
Pair: GT/USDT (Spot)
Current Price: ~$10.42
24h Range: $10.00 – $10.45
24h Volume: ~67.70K GT (~$691.81K turnover)
📊 1. Key Technical Breakdown Across Timeframes
1-Hour Chart (Short-Term Recovery):
GT tested strong psychological support around $10.00 before staging a clean V-shaped rebound back above $10.40.
Short-term EMAs (EMA5 at 10.38 and EMA10 at 10.33) are sloping upward, crossing above the short-term Moving Averages, signaling early bullish momentum in micro-timeframes.
MACD has fli
GT-0.09%
  • 3
Ledger response to the recent supply chain attacks: $899 pls. Ps don't drop it
post-image
$BTC Don’t get baited into heavily chasing longs in this rally! The one-hour chart looks like a strong rebound, but it is actually just a corrective bounce after the sharp drop, not a trend reversal. Overhead trapped positions are weighing on the market, so any surge could pull back at any time.
ETH rebounded and rallied after hitting a low of 2314.27 one hour ago. The MA5 and MA10 turned upward, and the MACD formed a golden cross, indicating a corrective rebound after the sharp drop rather than a trend reversal. Overhead resistance from previous trapped positions remains.
Enter ETH long posit
BTC+0.60%
Market update
live-cover
LIVE24
Load More

Join 40 M users in our growing community

⚡️ Join 40 M users in the crypto craze discussion

💬 Engage with your favorite top creators

👍 See what interests you

Trending Topics

USSeptemberPPIBeatsExpectations

91.35k Views1.87k Discussing

US September PPI came in at 6.3% YoY, well above the 5.3% market expectation, pointing to renewed producer-side inflation pressure. Weekly jobless claims were 199K, broadly in line with forecasts. Could hotter inflation further reduce room for rate cuts, and what does it mean for $BTC, US stocks, and gold?

DrLinHanSpeaksAtOxfordUnion

135.63k Views1.86k Discussing

JapanAndKoreaStocksPlunge

47.27k Views1.76k Discussing

View More