Square
Following
Hot
News
Notifications
Profile
Share your thoughts
placeholder
Article
Bitcoin Eyes Recovery As Analyst Flags Key Level For Next Rally
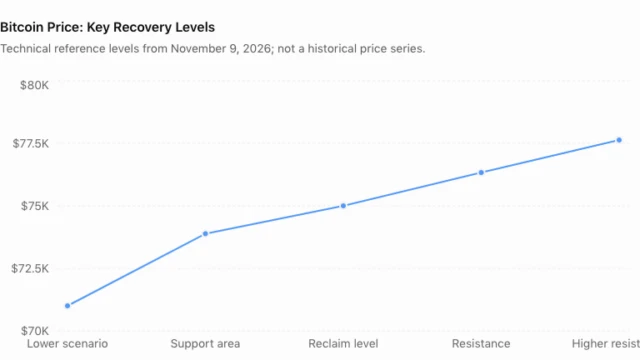
Bitcoin’s recovery may be approaching a critical turning point as the world’s largest cryptocurrency looks to regain momentum following its recent correction. Crypto analyst Michaël van de Poppe believes reclaiming a key price level could signal that buyers are ready to take control.
The new trading week has started with Bitcoin facing renewed pressure, but the latest technical analysis points to a clear level the cryptocurrency needs to overcome before stronger upward momentum can develop. Bitcoin’s recent price action follows a
post-image
BTC-0.67%
  • 1
Market Updates ABout BTC, ETH, SOL and ZEC...
live-cover
LIVE31
Trenches
牛逼
牛
bade
b
牛逼
0x96...7777
Market Cap
$.
Change
.
24h Vol
$.
Holders
.
STONK
S
bade
b
STONK
6GmA...UNgx
Market Cap
$.
Change
.
24h Vol
$.
Holders
.
PIEVERSE
P
bade
b
PIEVERSE
0x0e...25a9
Market Cap
$.
Change
.
24h Vol
$.
Holders
.
BTC
B
bade
b
BTC
C5xp...pump
Market Cap
$.
Change
.
24h Vol
$.
Holders
.
ON
O
bade
b
ON
0x0e...1d48
Market Cap
$.
Change
.
24h Vol
$.
Holders
.
Once $SOXLB picks up steam, the first pullback is the real test

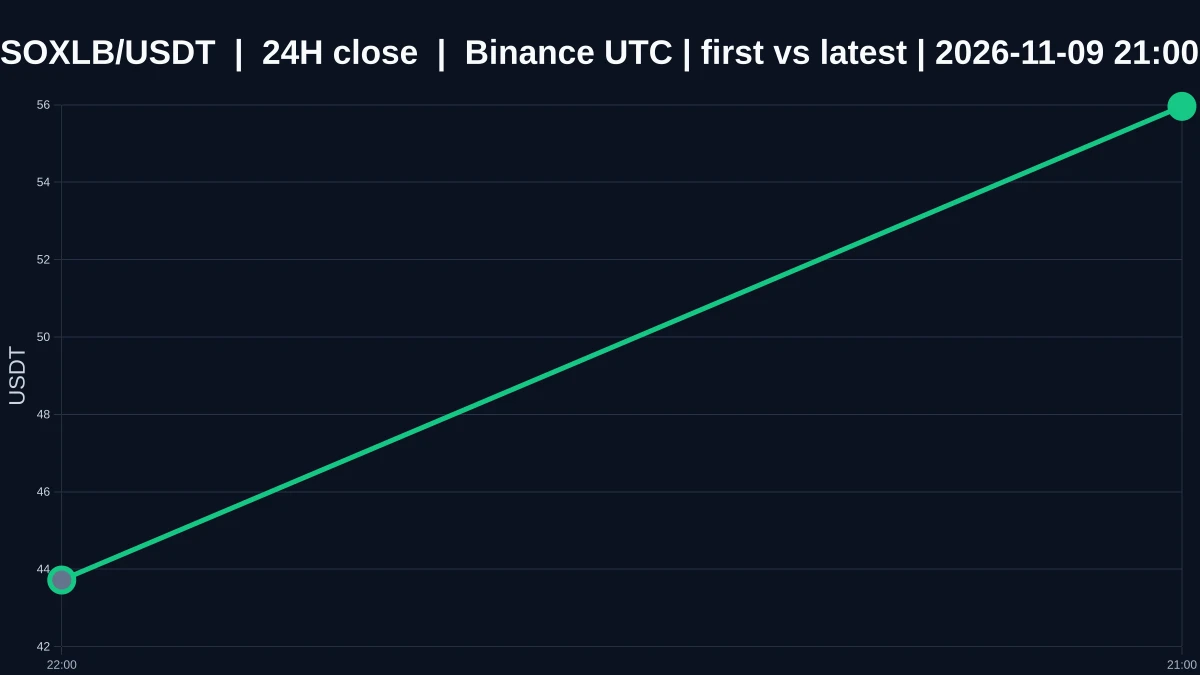
$SOXLB is currently priced at 55.94, up 23.679% over the past 24 hours. The 1-hour and 4-hour trends are both showing strength, but the volume ratio is only 0.0958, indicating that market participation is notably weak. This mismatch between price direction and trading activity reflects a fundamental tension between short-term buying pressure and the lack of marketwide consensus.

Looking at key levels, the current price is 14.62 points above the 1-hour support level of 41.32 and 11.56 points below the 1-hour resistance level of 5
post-image
With the same 1000U, the outcomes can be worlds apart. Are you getting on the $MVLL ride now or not? It hit a low of 7.94 yesterday and is now at 10.45, with a 24-hour range of 35%. This isn't a candlestick chart—it's a spring-loaded meat grinder.
First, the bulls' case: the current price is 10.45, up 19.84%, with a trading volume of 50.4M. The volume is there, but note the 24-hour high of 10.73—the price is now just 2.7% below the ceiling. That means anyone chasing the rally has the lid that just slammed down right over their head. The bulls' logic is that volume-backed momentum has broken th
🚨 BREAKING: Senator Elizabeth Warren reportedly plans to INVESTIGATE President Trump's family-linked crypto businesses!
The businesses are reported to have generated at least $2.3 BILLION, raising questions about potential conflicts of interest and financial disclosures.
Shorted $CL when the price cleanly broke below 87.0 and selling pressure intensified. The result was excellent, with a 52% gain. 🎯 ⚡Profit: $ 151 Add these assets to my watchlist:

$TST and $ETH .
post-image
TST
TSTTestToken
Pump.Fun
MC:$2.41KHolders:2
26.08%
CL-1.83%
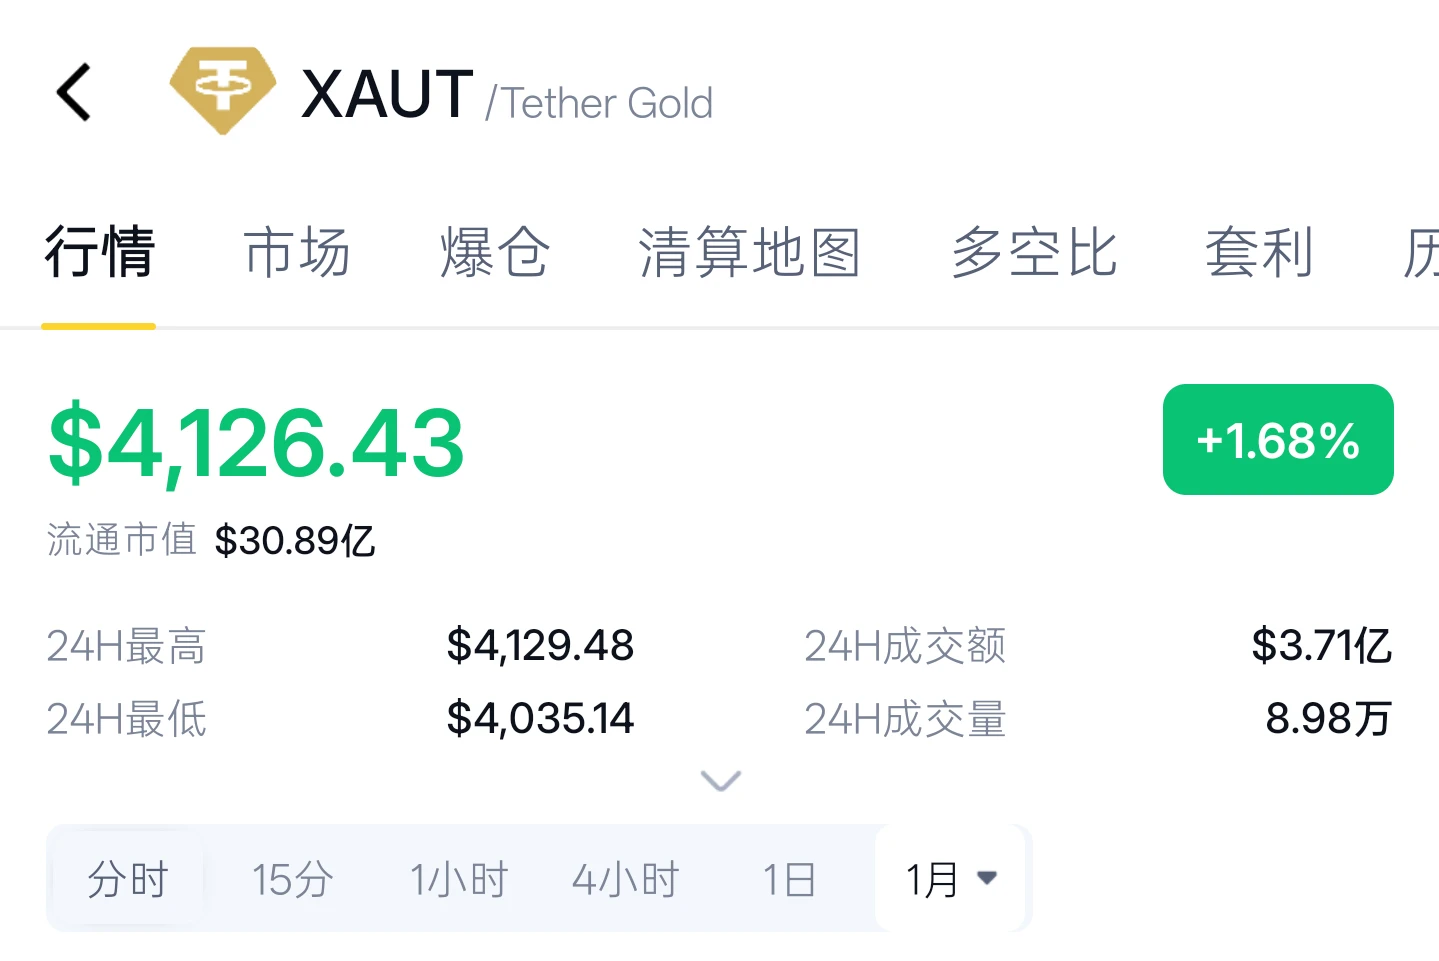
Gold prices back above 4100! Double-top resistance at 4133–4147, with rising risk of a spike and pullback!

Gold rebounded from its low in the early hours today, returning above the 4100 mark: after rallying from a low near 4055, it climbed back above the key 4100 level and reached the 4133 high area (touching 4143 based on New York gold prices). It is currently trading near 4108, up approximately 0.7%–1.1% on the day. Overall, the market is showing a “rebound from lows, repeated range-bound swings” pattern, with bulls and bears battling back and forth between 4100 and 4145, while the directio
post-image
GLDX-0.40%
PAXG+0.37%
We have all experienced that familiar feeling in our portfolios at some point: an asset climbs for a long stretch, then suddenly pulls back, leaving you wondering—has the trend ended, or is it just catching its breath? Looking at the GateToken chart, we find ourselves in exactly such a moment. The price has retreated from 11.52 to 9.62. The SuperTrend indicator is flashing red at 10.42, signaling a bearish trend in the short term.

This isn’t a situation that warrants panic, but it’s also not a signal to simply brush off as "business as usual." In short, the indicators suggest that bullish mom
GT-2.41%
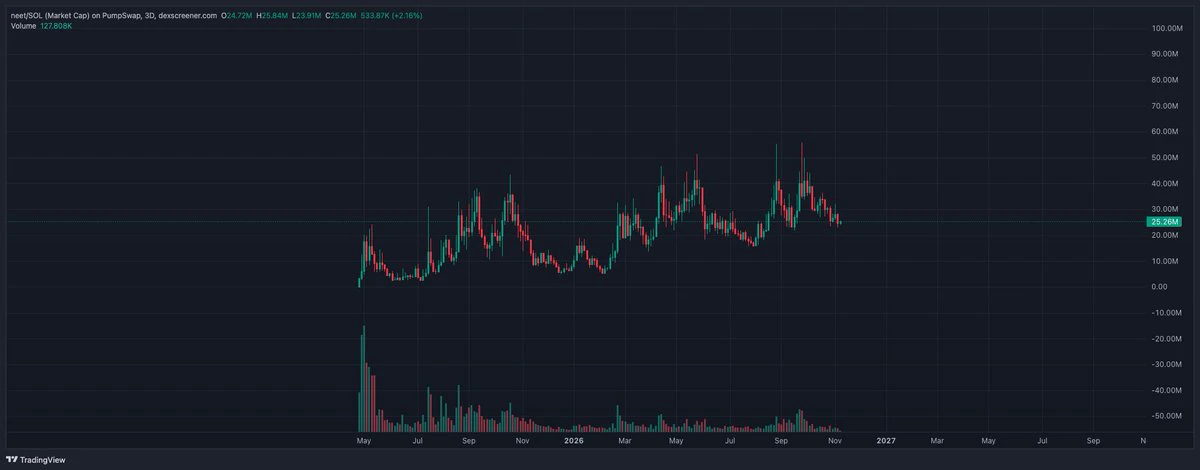
Tempted to reposition back into solana:Ce2gx9KGXJ6C9Mp5b5x1sn9Mg87JwEbrQby4Zqo3pump because the word is starting to get viral with unemployment tiktoks and reels it could run hard on second wave of onchain memes. + chart is unbelievably strong considering it launched last year April. Is this a good decision? I really believe so tbh.
post-image
SOL-0.77%
MARKET UPDATE
live-cover
LIVE75
🚨 I'M HUNTING FOR A LOW-CAP #MEMECOIN! 💎🔥
I want to discover the next hidden gem BEFORE it goes viral! 👀
💰 Low market cap
🚀 100X–1000X moonshot potential
🔥 Strong and active community
SHILL YOUR TICKER: $________ 👇
ARE WE READY TO FIND THE NEXT GEM? 🚀💸
#100x #1000x #Memecoin #Crypto #Gems
post-image
MEME-0.94%
GEMS-0.75%
37% APY
on stables !!
Means you make $37,000 passively with $100,000
Yes, its a "junior" tranche
But it's not as degen as you think:
Mezzanine (@mezzanine_fi) splits one vault into two tranches:
- Senior gets a lower yield and gets paid back first
- Junior gets the higher yield and takes the first hit if anything goes wrong
So what's actually under it?
Your USDC becomes wYLDS. That's backed by YLDS, a registered security from Figure. From there it goes into home equity loans and car loans
Real borrowers paying real interest. That interest is where the yield comes from.
For junior to lose money
USDC+0.01%
MORPHO-4.33%
KMNO+3.65%
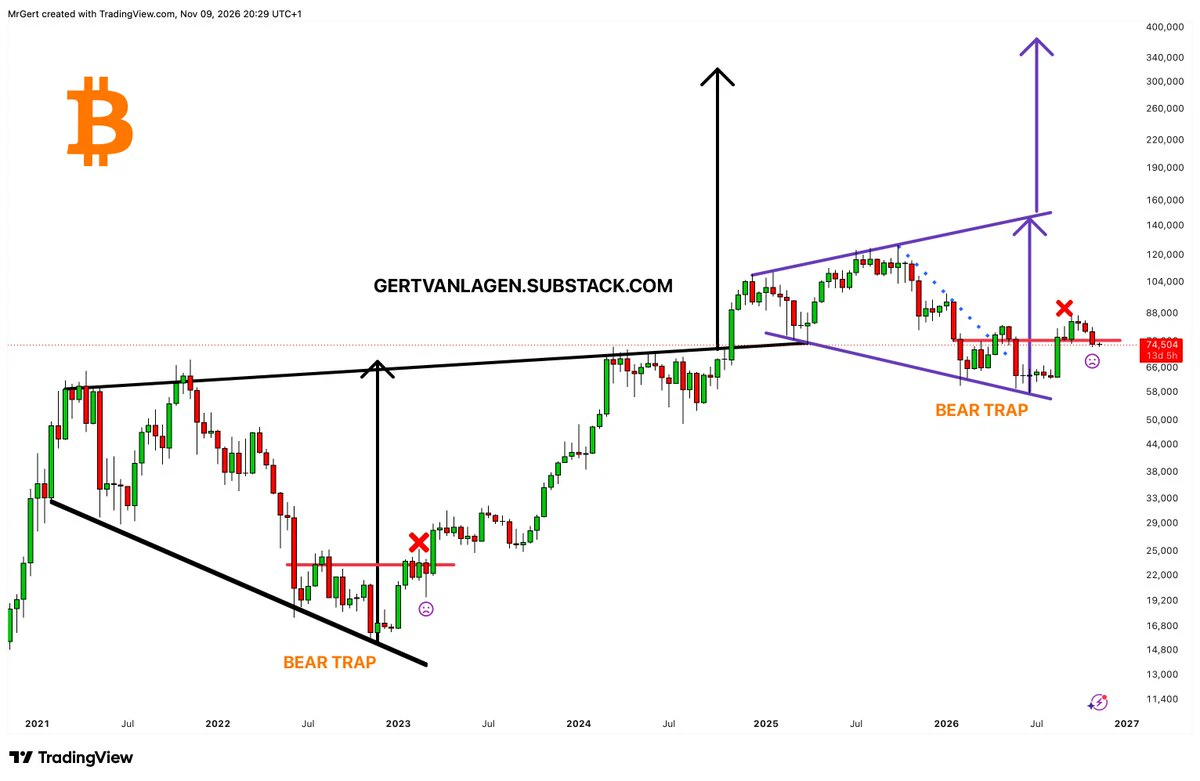
$BTC [2W] - The bulls remain in control as long as price holds above $57K. The important Q3 close above the $82.8K high is not easily reversed.
The double-bottom setup is getting more comparable to the 2022 reversal. Compare ❌ and ☹️.
post-image
BTC-0.67%
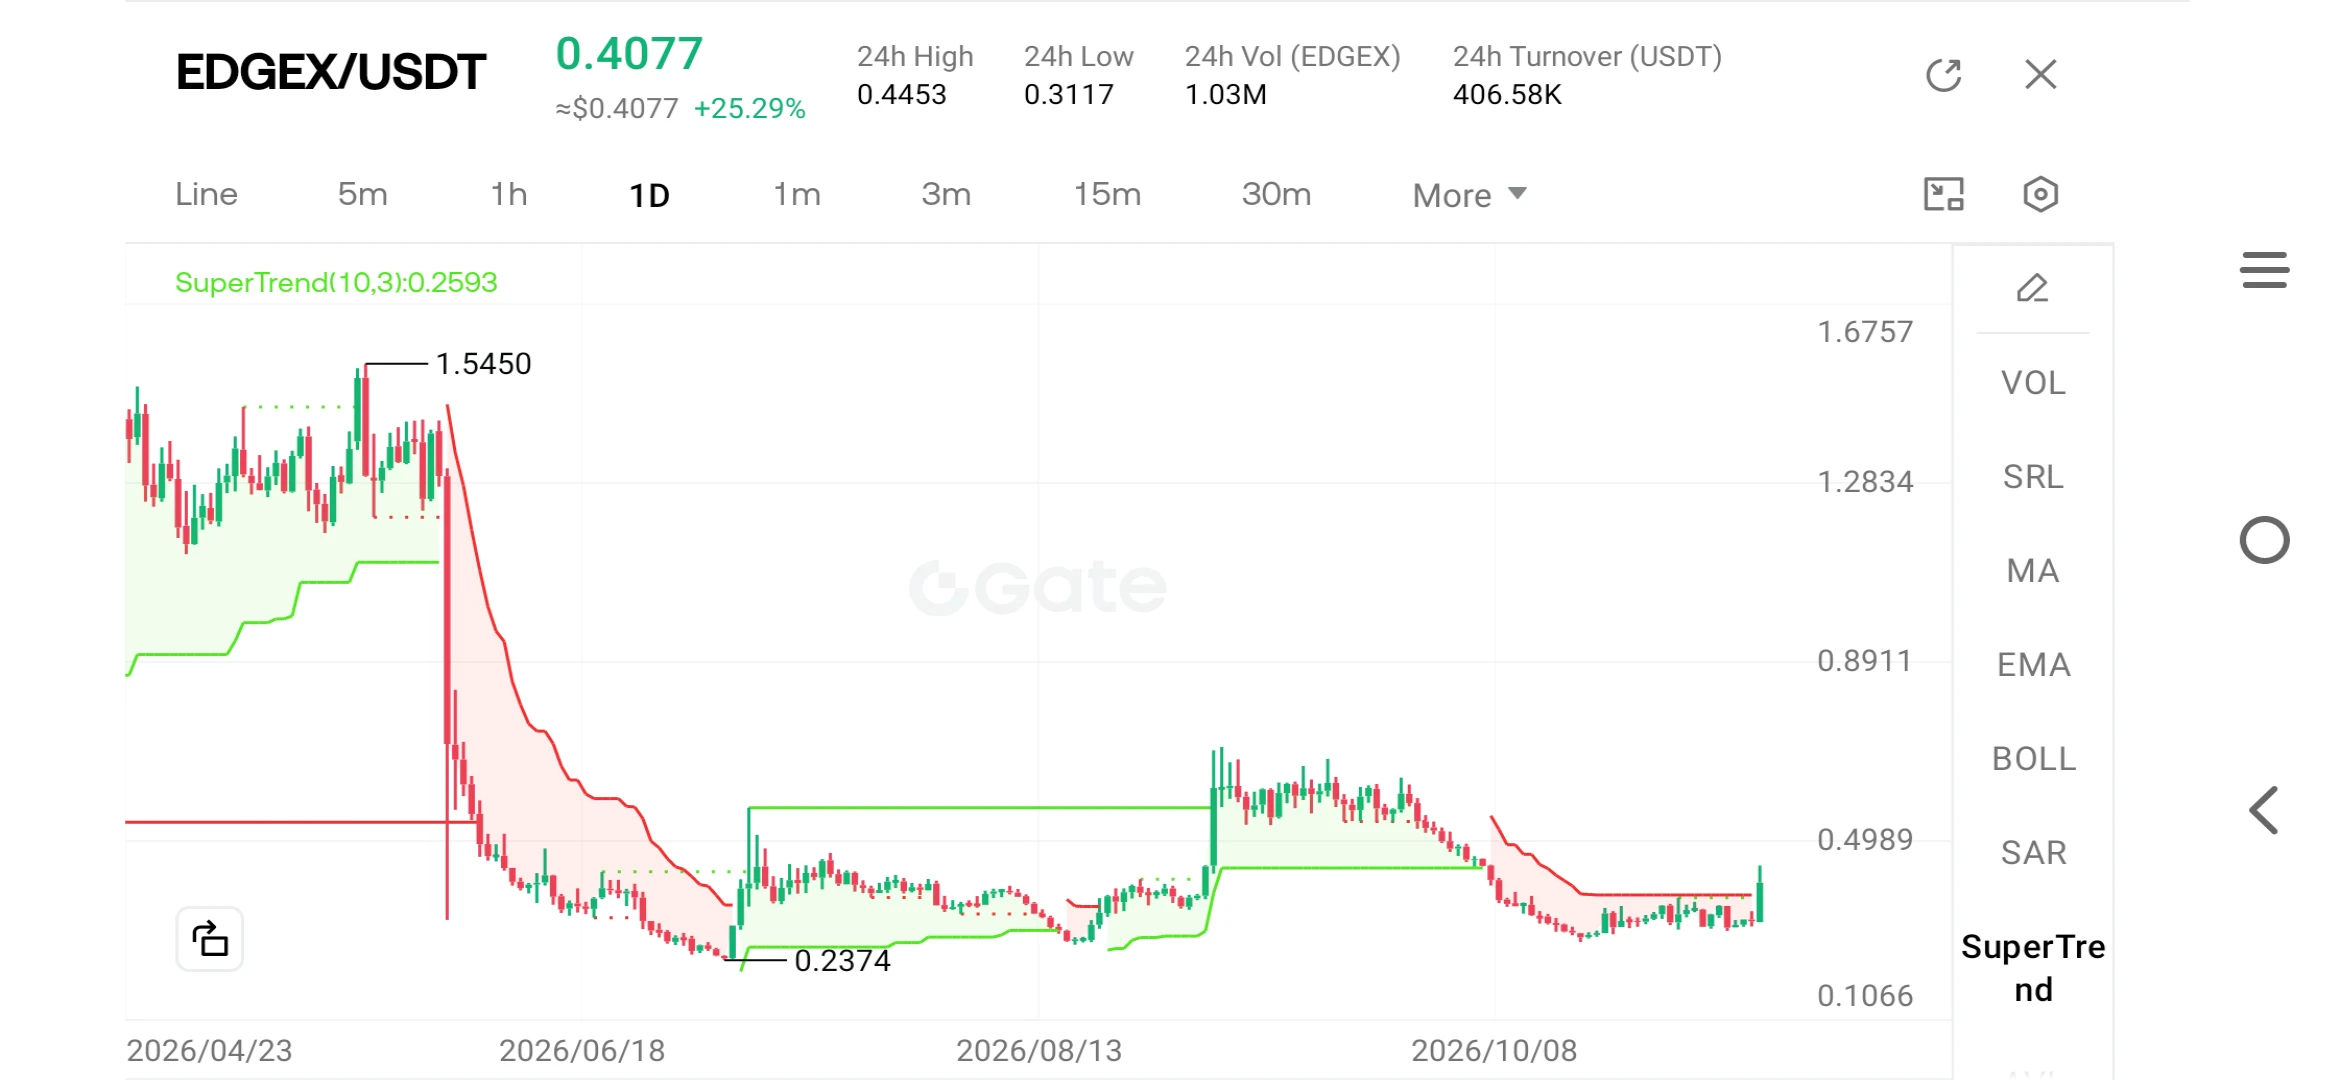
Today’s chart looks exciting at first glance. EDGEX is trading around $0.4077, up 25.29% in 24 hours. The daily range was $0.3117 to $0.4453, and turnover on this venue was about $407K.

But the excitement fades when you zoom out. The peak on the chart was $1.5450 back in the spring. The low was $0.2374. That means price is still about 74% below its high, and about 72% above its low. In other words, today’s move is a bounce inside a large downtrend, not a reversal yet. Treat it that way until it proves otherwise.

SuperTrend on the daily chart appears to have flipped bullish on today’s candle.
post-image
EDGEX+1.20%
BTC-0.67%
ETH-1.26%
SOL-0.77%
XRP-1.15%
As of November 10, ETH is trading around $2,130. With a daily decline of 4.36%, it is hovering near the lower bound of its 24-hour range, which spans from $2,065 to $2,227. This movement is not unique to the crypto market; it is intertwined with broader macroeconomic developments that shape global risk appetite.

Market attention is currently focused on the U.S. inflation data for October, due to be released on Tuesday. This figure is critical as it serves as the final inflation reading before the Federal Reserve’s meeting on December 8–9. Following strong employment data released last week, t
ETH-1.26%
$BTW Another opportunity to open a short (sell) trade 📉🚨 Targets 🎯 0.88 and 0.7 Stop loss ❌ 1.35
post-image
BTW-7.42%
U.S.-Iran negotiations made good progress, and U.S. stocks closed with a large bullish candle as tech stocks emerged from the gloom and began to bottom out and move higher.
SanDisk surged more than 100 points, while Google, Intel, semiconductor stocks, and others began to rebound.
BTC and ETH have now held firm at key levels for right-side trading. The market could break out of its current range this morning. BTC could reach 76000, and ETH could reach 2160 or higher.
The short-term trend in major cryptocurrencies still needs to stabilize. Prices are likely to consolidate in a range. As long as
SNDK+6.27%
BTC-0.67%
ZEC+1.16%
#RedBullDoublePodiumInBrazil #ShareWeekly

Red Bull's Brazilian GP Masterclass: How Two Drivers Turned a Challenging Weekend Into a Double Podium

The 2026 São Paulo Grand Prix at Interlagos delivered a powerful reminder that Formula 1 is not simply about starting positions, raw speed or having the fastest car. It is about making the right decisions under pressure, adapting to unpredictable circumstances and taking advantage of every opportunity. Red Bull demonstrated these qualities by securing an impressive double podium, with Max Verstappen finishing second and Isack Hadjar taking third pl
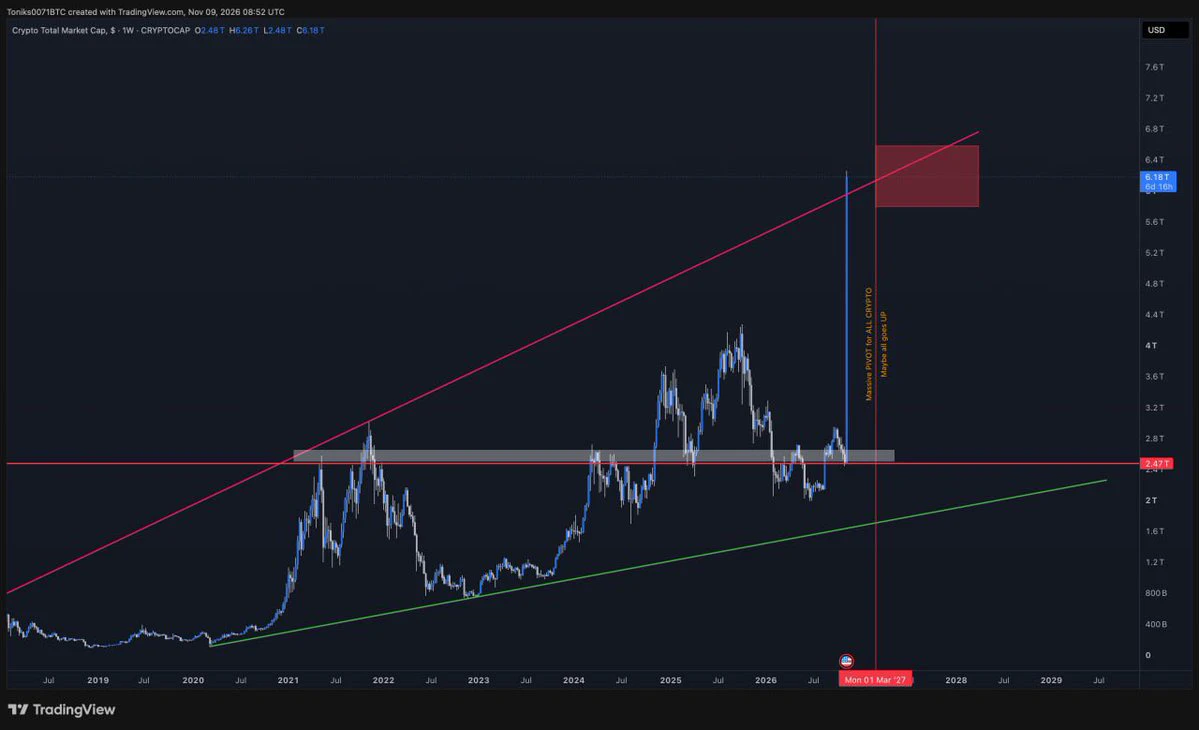
TOTAL #Crypto MC
Idk if this is some sort of sign or just a lag but funny enough it went exactly where I expect it to go - in the red box and hit the red trendline.
What if market is chopping around everyone until it pulls off such a candle and just a few profit from it ? #Altcoins
post-image
Load More

Join 40 M users in our growing community

⚡️ Join 40 M users in the crypto craze discussion

💬 Engage with your favorite top creators

👍 See what interests you

Trending Topics

USCPIDataIncoming

44.29k Views2.03k Discussing

The U.S. October CPI report will be released on November 10 at 8:30 a.m. ET. September CPI came in at 3.7% year over year, and markets will be watching closely for signs that inflation is cooling, especially in core CPI. A softer-than-expected reading could strengthen rate-cut expectations, while hotter inflation may pressure risk assets through higher Treasury yields and a stronger dollar. How do you think this CPI print will move $BTC, U.S. stocks and gold?

RedBullDoublePodiumInBrazil

9.98k Views30.59k Discussing

BTCFlashCrash

220.49k Views66.6k Discussing
View More