BelduTatsmar

vip
Active for: 3.3y
Peak Tier 5
No content yet
Pin
  • Reward
  • Comment
  • Repost
  • Share
#nvidia
NVDAG0.00%
NVDA-4.58%
CryptoGladiator
#NVIDIAEarnings
NVIDIA After Earnings: The AI Engine Is Still Running, but the Market Has Raised the Bar
NVIDIA has delivered another quarter that makes the scale of the AI infrastructure cycle difficult to ignore. Q2 FY2027 revenue reached $96.22 billion, up 106% year over year, while adjusted EPS came in at $2.22. Data Center revenue was the standout, reaching $89.0 billion, up 117% year over year and 18% sequentially. These numbers confirm that AI infrastructure demand is still expanding at extraordinary speed.
The forward guidance is arguably even more important than the quarter that just finished. NVIDIA expects Q3 revenue of approximately $108 billion, plus or minus 2%, with gross margin around 74%. The company is therefore guiding toward another substantial sequential increase in revenue while accepting some margin pressure as the business scales.
That margin story is where the next debate begins. NVIDIA generated a 75% gross margin in Q2, but management expects approximately 74% in Q3. Supply constraints and rising component costs mean investors are now watching not only how much AI infrastructure NVIDIA can sell, but how efficiently that demand converts into profit. A small margin decline is not necessarily a problem when revenue is expanding this quickly, but expectations are extremely high.
The demand signal remains the strongest part of the thesis. NVIDIA says its AI infrastructure buildout is continuing at full speed, with demand coming from frontier AI labs, startups, enterprises, sovereign customers and other parts of the ecosystem. Reuters also reported that management expects approximately 70% revenue growth for fiscal 2028, substantially above the growth rate many investors had been expecting.
Vera Rubin adds another layer to the story. NVIDIA says the Vera Rubin platform is already ramping into full production, with systems running at partners including CoreWeave, Google Cloud, Microsoft Azure, Oracle Cloud Infrastructure and Nebius. This matters because the growth thesis is increasingly becoming a multi-generation platform cycle rather than a story dependent entirely on Blackwell.
The AWS announcement strengthens that interpretation. NVIDIA and Amazon Web Services announced plans to deploy 2 million additional NVIDIA GPUs across AWS's global infrastructure while expanding cooperation across AI factories, networking, CPUs, open models and physical AI. That is a long-duration demand signal rather than simply another quarterly order.
China remains an important uncertainty. NVIDIA's Q3 revenue outlook assumes no Data Center compute revenue from China, meaning any future improvement in that market would represent potential upside to the current outlook rather than something already embedded in the guidance. At the same time, export restrictions make China a genuine geopolitical risk that investors cannot simply ignore.
Now look at the stock reaction. The latest available market data shows NVDA trading around $225.51, up approximately 7.56% during the August 27 session at the time of the latest quoted update. The stock opened around $222.79 and traded as high as $227.30, while the previous session closed at $209.66. That is a major repricing in a very short period and confirms that investors are responding positively to the forward growth outlook.
The technical picture has therefore changed from the $219 area referenced before earnings. $227–$228 is now the first immediate resistance zone because it overlaps the current session high and the previous August high near $227.92. A sustained move above that region would strengthen the breakout structure. The next psychological area is $230, followed by the broader $235–$236 zone.
On the downside, the first important reference is approximately $220–$222, which now sits close to the current breakout area. If buyers can defend that zone during any post-earnings pullback, the market would be showing that the earnings reaction is being absorbed rather than fully reversed. Below that, $213–$215 becomes the next meaningful support area, followed by the previous $209–$210 region.
Volume is especially important here. NVDA traded more than 143 million shares during the latest quoted August 27 session, compared with roughly 180 million shares on August 26 and 122 million on August 25. That tells us the earnings reaction is occurring with substantial market participation rather than on unusually thin liquidity.
The broader market is providing another tailwind. Reuters reported that NVIDIA's post-earnings move helped lift AI-related markets, while the Nasdaq also advanced. However, the macro backdrop is not completely risk-free: July PCE inflation remained elevated, and markets are preparing for Federal Reserve Chair Kevin Warsh's Jackson Hole speech. That means interest-rate expectations could still influence how far the AI rally can extend.
My bullish scenario is a sustained hold above $220–$222, followed by a decisive break through $227–$228 with strong volume. If that happens, $230 becomes the next psychological test, followed by $235–$236. The strongest confirmation would be a breakout followed by a successful retest of the $227 area as support.
The bearish scenario is different. If the post-earnings surge fails and NVDA loses $220, the market could begin digesting the enormous move more aggressively. A break below $213–$215 would weaken the immediate structure, while a return toward $209–$210 would indicate that investors are questioning whether the new growth expectations justify the current valuation.
The fundamental picture is therefore strong, but the technical setup is entering a higher-expectation zone.
NVIDIA has already answered one question: AI demand is still enormous.
The next question is harder: can NVIDIA continue delivering extraordinary revenue growth while protecting margins, managing supply, launching new platforms and navigating geopolitical restrictions?
At around $225.51, I would focus on three numbers: $228 for breakout confirmation, $220–$222 for near-term support, and $209–$210 for deeper structural risk.
The AI story has not weakened. If anything, the latest results have extended the runway.
But after a move of this magnitude, the market will demand more than another impressive quarter. It will demand evidence that the next stage of AI infrastructure spending can continue translating into sustainable earnings growth.
#GateSquare
$NVDA
  • Reward
  • Comment
  • Repost
  • Share
#GateStockInsightsChallenge
NVidia Market Analysis
Nvidia Stock is inching higher in pre-market trading on Monday after a report said some major customers face more than 15% price hikes on AI servers. The higher prices will affect systems using Nvidia’s Vera Rubin and Grace Blackwell chips. Rising memory costs are driving much of the increase. The new prices will apply to systems shipping early next year. The report comes two days before Nvidias 2nd fiscal quarter
earnings, Wall Street expcts 2.09 on adjusted EPS on 92.2 billion in revenue.
Revenue is expected to rise about 95% year over ye
NVDA-4.58%
  • Reward
  • Comment
  • Repost
  • Share
Bit_ardizor
$NEAR
NEAR is really moving with strength. In the past 24 hours, there’s been more action. Once the trend really takes hold, turning back is hard. The ranking is slowly climbing upward, and the heat is clearly visible to the naked eye. Whenever this kind of volume-and-price breakout rhythm happens, it basically doesn’t disappoint afterward. The wise ones have already stopped talking and are just quietly positioning. 😏
  • Reward
  • Comment
  • Repost
  • Share
$QNT
Market Analysis and QNT Price Trajectory to 2030
Projecting cryptocurrency prices requires analyzing multiple concurrent variables. For Quant, these include broader crypto market cycles, regulatory developments for enterprise blockchain, and the execution speed of its partnership pipeline. Historical data shows QNT exhibits higher volatility during bull markets but has demonstrated resilience due to its B2B focus.
Analysts from firms like CoinCodex and DigitalCoinPrice utilize quantitative models incorporating these factors. Their consensus suggests a gradual appreciation in value correl
QNT-0.67%
  • Reward
  • Comment
  • Repost
  • Share
&sol
SOL-2.14%
Sweep1
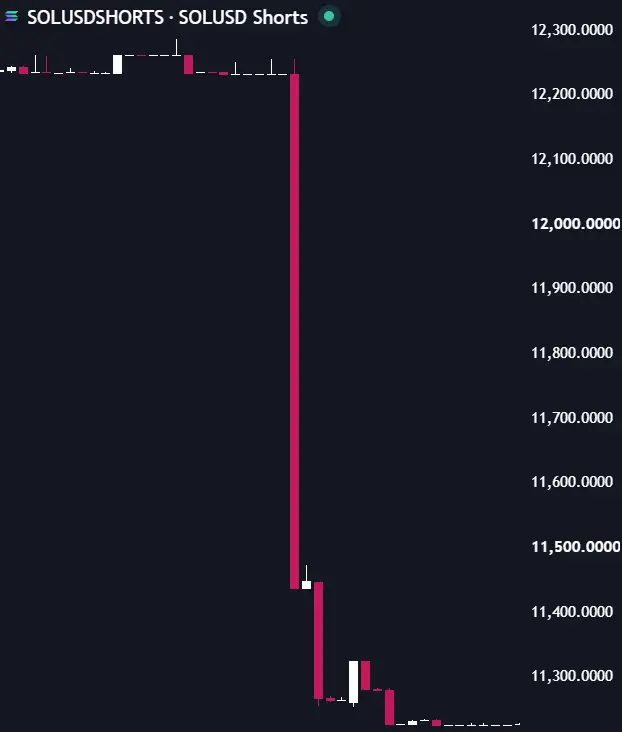
Whales just nuked their $SOL short positions
They definitely know something
repost-content-media
  • Reward
  • Comment
  • Repost
  • Share
BITCOIN TREND UPDATE
$BTC shows a bullish trend with the price at 65,203.5, staying above both EMA20 at 65,052.96 and EMA50 at 64,948.01. 📈 RSI stands at 65.6 and the MACD is at 75.271, showing positive momentum. Bulls may face hurdles around 65,345.49, 65,510.13, and 65,612.34. 🚧 Buyers may step in around 64,936.28, 64,757.14, and 64,482.17. A sudden breakout could trigger further momentum.
BTC-0.64%
  • Reward
  • Comment
  • Repost
  • Share
$BTC $ETH

Solar/Lunar Eclipses & BTC Price Cycles: The Market Theory
Some crypto traders utilize Financial Astrology to identify correlations between market lore and solar and lunar eclipse-like astronomical events and price volatility. Market Volatility Increases During Eclipse Theory: Traders who follow lunar cycles often see more market volatility during important solar/lunar eclipses, full moons, and new moons. Reversals and Pivots in Trends: Solar eclipses are regarded in astro-trading theories as potential "macro pivot points" or "launch points" that signal the conclusion of an ancie
BTC-0.64%
ETH-0.24%
  • Reward
  • Comment
  • Repost
  • Share
BTC-0.64%
MatthewDixon
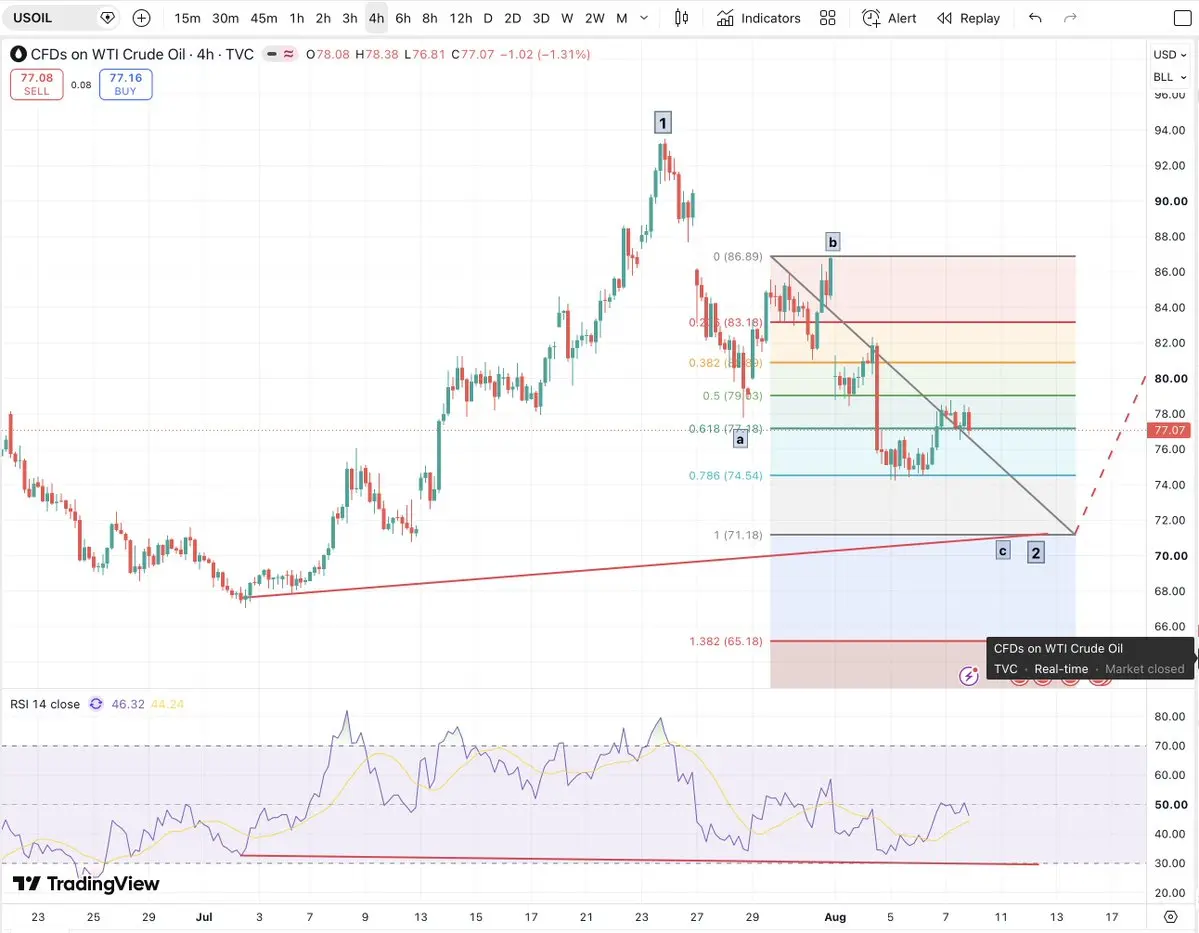
Still favouring a deeper Wave 2 correction in #OIL towards the $71 area.
That could coincide with a further near-term advance in #BTC and #Crypto.
But the bigger setup may come afterwards.
Oil will likely show hidden bullish divergence once Wave 2 completes, then the preferred count points to a potentially powerful Wave 3 higher.
If that develops into Q4, sharply higher oil could become another macro headwind for inflation, rates and ultimately risk assets.
Oil down → crypto relief → oil reversal → Q4 risk?
A scenario, not a certainty but one I'm watching closely.
repost-content-media
  • Reward
  • Comment
  • Repost
  • Share
#btc
BTC-0.64%
GateUser-7d4053b9
Today’s crypto market is showing cautious bullish sentiment, driven by strong Bitcoin ETF inflows and a surge in the creation of new wallets. The main focus of the current strategy is to capitalize on institutional momentum while remaining alert to short-term volatility.Today’s Main StrategyMonitor Institutional FlowsPay attention to Bitcoin and major altcoin ETF inflow data as an indicator of market direction.Follow the movements of large-cap assets such as Bitcoin (BTC) and Ethereum (ETH).Avoid chasing prices (FOMO) during sudden sharp surges.#MoonshotAIPreIPOsOpen
  • Reward
  • Comment
  • Repost
  • Share
Bitcoin Stuck around 65k
Bitcoin is once again trying to move above $65K. But the area between $65K and $67K is proving hard to cross. Buyers are showing interest but sellers are still waiting around these levels.
Bitcoin recently moved toward $65K and buying activity increased. However the buying was not strong enough to clear the sell orders above the price. After buyers slowed down Bitcoin moved back toward $64K.
This shows the main problem right now. Bitcoin needs stronger buying if it wants to move clearly above $67K.
There is still one positive sign for buyers. Bitcoin spot ETF flows hav
BTC-0.64%
  • Reward
  • Comment
  • Repost
  • Share
#SOL
SOL-2.14%
Cryptoluter
$SOL /USDT Perp – "Bullish EMA Crossover – Long"**
**Trading Plan Long $SOL
Entry: 73.80 – 74.05
SL: 72.80
TP1: 74.50
TP2: 75.00
SOL is up +0.91% at 74.00. It has crossed and held above EMA30 (73.37), creating a bullish alignment. MACD is positive with DIF (0.18) above DEA (0.04). Watch for a breakout above the 74.31 high. A break below the 72.10 purple line invalidates the setup.
#NFPShockSpikesRateCutOdds
repost-content-media
  • Reward
  • Comment
  • Repost
  • Share
AKE-1.72%
DivineCrypto
$AKE A MACD golden cross combined with bullish RSI divergence—did you catch this signal?
A favorite among technical traders. At 0.0023, the technical indicators may have formed a perfect confluence.
In-depth analysis:
1. Bullish divergence: The price makes a new low, but the MACD green bars shorten or RSI rises, which is a strong reversal signal.
2. Moving average system: Long-term moving averages (such as MA120) are beginning to flatten, while short-term moving averages (MA5/MA10) cross above the long-term moving averages.
3. Entry timing: This confluence point has an extremely high win rate, and combined with 25x leverage, it is a source of huge profits.$BTC $ETH #Gate上线宇树科技盘前合约
repost-content-media
  • Reward
  • Comment
  • Repost
  • Share
HOME-0.94%
Original content no longer visible
  • Reward
  • Comment
  • Repost
  • Share
BITCOIN BOUNCE !!! 1M & 15 M SAR SIGNALS
live-cover
103 views
2026-08-03 13:19
Ended • No Replay
  • Reward
  • Comment
  • Repost
  • Share
QUANT SUPPLY HITS LOWS ON EXCHANGES !!!
Quant (QNT) — Current Exchange Supply Status (Exchange Reserve, All Exchanges)
What the latest data says (most recent point in the chart):
Exchange Reserve is ~1,141,862 QNT (≈ $68.98M) on the latest timestamp shown.
Over the displayed window, the series trends downward from roughly ~1.159M QNT (≈ $78.94M) toward ~1.142M QNT (≈ $68.98M).
Interpretation (for QNT as a non-stablecoin):
A declining Exchange Reserve means less QNT is sitting on exchanges right now.
That typically indicates reduced immediate sell-side supply (coins moving toward self-custody
QNT-0.67%
  • Reward
  • Comment
  • 1
  • Share
#ZAMA
$ZAMA - SHORT🔴
Entry: 0.05002
SL: 0.05464
TP1: 0.04771
TP2: 0.0454
TP3: 0.04309
Move SL to Breakeven once TP1 is hit !
The current setup on the 1H chart suggests a potential reversal, driven by shifting momentum.
On the 1D chart, the bullish bias is evident, but our short trade will be moving against this broader trend - a fact that warrants careful risk management.
NFA $ZAMA ‌
ZAMA-0.07%
  • Reward
  • Comment
  • Repost
  • Share
#apple
AAPLG-0.68%
Bykaranteli
JUST IN: Berkshire Hathaway hits an eight-month high as its top holdings—Apple, Coca-Cola, and Bank of America—shine YTD, with Apple up 13%+, Coca-Cola up ~25%, and BofA up ~12%. $AAPL $KO $BAC
repost-content-media
  • Reward
  • Comment
  • Repost
  • Share
BTC-2.99%
CryptoZeno
The latest $BTC price action produced one of my favourite short setups.
It’s called “The Overshoot.”
The reason this setup works so consistently is that it forms within an established downtrend, but temporarily creates enough bullish structure to convince traders that the trend has reversed.
BTC first established the downtrend by forming a lower high at B, followed by a lower low at C.
Price then rallied from C, stopped making lower lows and established a higher low at D. When the next rally broke the local high above it, BTC appeared to be shifting into a new short-term uptrend.
That apparent shift is what creates the trap.
As price extends toward E, breakout traders begin entering long while existing shorts are forced to cover. If the move also sweeps the previous lower high at B, it clears another layer of liquidity and makes the reversal look even more convincing.
The sweep itself is not essential. What matters is that the new long positioning is now dependent on the higher low at D holding.
Despite the local breakout, the broader downtrend has never actually been invalidated. Price has simply overshot within it.
That is why D becomes the neckline of the setup.
Once price rejects from E and breaks back below D, the local bullish structure fails. The traders who entered during the breakout are now trapped, their stops begin adding sell pressure and the original downtrend takes control again.
That failure naturally opens the rotation back toward C because it is the lower low the entire reversal attempt was trying to move away from.
This is exactly what BTC has just produced.
Price rallied back into the previous lower-high region at $65.5K, rejected, lost the higher low around $63.7K and flushed directly into the original low near $62.6K.
The pattern looks more complicated than it is, but the mechanism is extremely balanced.
An established downtrend creates a temporary bullish reversal. That reversal attracts long positioning, and the failure of the level supporting those longs provides the liquidity for the trend to continue.
repost-content-media
  • Reward
  • Comment
  • Repost
  • Share
  • Pinned