Share your thoughts
placeholder
Article
$SOL — -1.24%
Bitcoin's weakness is pulling everything down today, but Solana is showing resilience. Currently trading at $102.32, SOL broke through key support levels before bouncing hard from $100.21.
Support: $100.21
Resistance: $104.79
🎯 Target: $106.50
🔥 Next Move: If macro stabilizes, expect a quick retest of $104.79. The pullback looks shallow—smart money is likely accumulating here.
💡 Pro Tip: Watch volume on the bounce. High volume recovery often precedes a run to new highs.#Gate60MillionUsers #BTCReclaims80K
post-image
SOL-1.32%
$RDDT /USDT Perp – "Illiquid Chop – Avoid"**
**Trading Plan Short $RDDT
Entry: 153.65
SL: 153.80
TP1: 153.54
TP2: 153.40
RDDT is extremely illiquid (volume 0.81) and completely flat. High slippage risk; enter only on a break below the 153.65 level, with a tight stop above the 153.80 resistance.
post-image
RDDT-2.21%
  • 7
  • 2
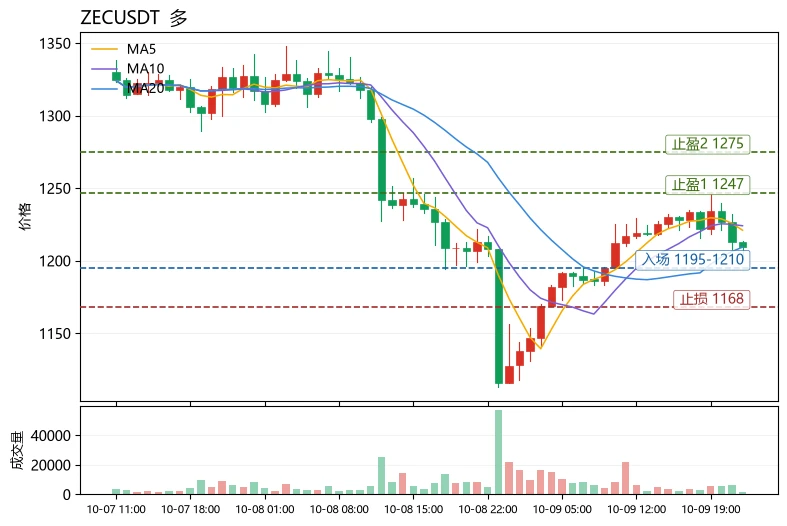
$ZEC
ZEC has gone crazy again!
Breaking through $1,000 and setting a new high for nearly ten years!
Who exactly is buying this time?
Damn, Zcash's trend is seriously ruthless
It was still hovering in the $900s yesterday
And suddenly it broke straight through $1,000
At one point, it reached around $1,050
Its market cap also surged to around $17 billion
Re-entering the ranks of the top assets in the crypto market
And this isn't an ordinary rebound
This is the first time in nearly ten years that it has climbed above $1,000
The wildest part is
Many people still thought privacy coins were finished
post-image
ZEC+3.79%
ID/USDT — Pressure is building
ID is trading around 0.03289, up 3.59%, but the bigger picture is still a range.
Price has been gradually recovering from the 0.02299 low and is now testing the upper part of the recent consolidation.
Levels I’m watching:
• 0.03338 — immediate resistance
• 0.03690 — major resistance
• 0.03000 — key support
• 0.02856 — next support
• 0.02685 — SuperTrend support
The interesting part is momentum: MACD has turned positive and is slowly improving, while price continues to hold above 0.03000.
A clean break and hold above 0.03338 would make 0.03690 the next important a
post-image
  • 1
Everyone’s chasing the 15m RSI bounce—but the 4h chart just whispered a secret about $LAB /USDT.

$LAB /USDT - SHORT

Trade Plan:
Entry: 0.07577 – 0.07641
SL: 0.08005
TP1: 0.07312
TP2: 0.07114
TP3: 0.06817

Why this setup?
- RSI on 15m is overheated at 68.35—that’s fuel for the next leg down, not up.
- 1D trend is bearish, and price is stalling at 0.07609—right at the 4h supply zone.
- My model’s 80.33 confidence says SHORT. Targets: TP1 0.07312, TP2 0.07114. Stop is tight at 0.08005.
- Why now? The bounce is losing steam exactly where shorts want to reload.

Debate:
Are you fading t
LAB+7.26%
Sideways trading is accumulation; the Wyckoff volume-price analysis method was perfectly validated on $AKE USDT. A 25x leveraged long position, entered at 0.0131275 with a take-profit at 0.0163156, secured a gain of +595.96%.
There is no excess return in crowded hot coins; true smart money is always lurking in overlooked corners. Livermore said, “Making big money depends on waiting,” but high leverage requires strict discipline—neither take-profit nor stop-loss can be omitted.
Once the big fish is hooked, bank the profits quickly; greed is the fuse that triggers liquidation. Protecting princip
AKE+29.72%
BTC-1.44%
ETH-2.23%
Market prediction
live-cover
LIVE2,069
Web3 is big for countless opportunities!
Just keep showing up. Eventually, the right people notice the work, the conversations start, and those conversations can turn into real opportunities and deals.
September looks promising 💝
post-image
#GateTops7DayNetInflowsGlobally
GATE CROSSES $300M IN 7-DAY NET INFLOWS
Gate has recorded approximately $300.43 million in net capital inflows over the past seven days, placing it among the top three globally according to the latest DeFiLlama-based data. The figure is significant because it shows that capital movement toward Gate has remained strong even while the broader crypto market is dealing with elevated volatility and changing macro expectations.
WHAT DOES $300M+ NET INFLOW ACTUALLY MEAN?
Net inflow is not simply the amount of money entering an exchange. It represents the difference b
post-image
Falcon_Official
#GateTops7DayNetInflowsGlobally
Gate is making a strong statement through capital flows. According to DeFiLlama data, Gate recorded approximately $273.72 million in net capital inflows over the past 7 days, placing it among the top three centralized exchanges globally. For an exchange, this is more than just a large number on a dashboard—it shows that a significant amount of capital has moved onto the platform after accounting for outflows.
The important word here is “net.” If users deposit $500 million but withdraw $226 million during the same period, the net inflow is roughly $274 million. That means the headline figure is measuring the difference between money coming in and money leaving, rather than simply counting deposits. This makes a sustained positive seven-day figure a useful indicator for understanding where exchange liquidity is building.
A seven-day window is particularly interesting because it filters out some of the noise that can appear in a single day. One large transfer can make a 24-hour ranking look impressive, but maintaining strong net inflows across an entire week suggests broader activity. Capital may be arriving for spot trading, derivatives, portfolio repositioning, new listings, hedging or simply to keep funds ready for opportunities.
There is another reason this number deserves attention. Exchange inflows should never be interpreted as an automatic bullish signal for the entire crypto market. Coins moving onto an exchange can eventually be used for buying, but they can also be deposited for selling or hedging. The stronger interpretation comes when capital inflows are combined with trading volume, price action, stablecoin liquidity and user activity. In other words, inflow tells us where capital is moving; market behavior tells us what that capital is actually doing.
Gate's broader flow picture also adds context. DeFiLlama data cited by Gate showed approximately $520.45 million of net inflows over the past month, ranking Gate third among centralized exchanges globally. The seven-day figure therefore fits into a larger story of meaningful capital movement rather than appearing as an isolated one-day event.
For traders, this is the part I find most interesting. If strong net inflows continue while trading activity expands, liquidity becomes an increasingly important part of the Gate ecosystem. More available capital can support deeper market participation and provide traders with greater flexibility when volatility creates opportunities. But if inflows rise while prices weaken sharply, the interpretation becomes more complicated because those funds could be positioned for selling or defensive strategies.
The recent data also shows how quickly rankings can change. Another September 3 snapshot from DeFiLlama placed Gate's seven-day net inflow at $78.19 million and ranked it first among global centralized exchanges, highlighting that exchange-flow figures can move rapidly as deposits and withdrawals change. The key takeaway is therefore not to treat one snapshot as permanent, but to watch whether positive capital-flow momentum continues over multiple periods.
For Gate, the $273.72 million seven-day net inflow is still a notable milestone. It puts the exchange firmly on the global capital-flow radar and gives the community another metric to watch beyond simple trading volume. If the next weekly readings remain positive and are accompanied by stronger activity, that would make the trend considerably more meaningful.
Capital follows opportunity, but the smartest signal is not simply seeing money arrive. The real signal is seeing whether that capital stays, participates and contributes to sustained market activity.
@Gate_Square
repost-content-media
BTC-1.44%
  • 5
#Web3SecurityGuide 🚀
Most people think Web3 is only for crypto traders.
That's one of the biggest misconceptions.
The real power of Web3 isn't about making one lucky trade.
It's about giving ordinary people more control over their digital lives.
Imagine a world where you truly own your digital assets, receive payments from anywhere, and exchange value directly with others—without unnecessary barriers.
That future is already taking shape.
🌍 Why Web3 Matters
Web3 shifts ownership from large platforms back to users.
Instead of simply using online services, people can own digital assets, verify
  • 2
I'm still quite bullish on storage, so why go against the trend? A pullback to 1650-1680 is a long; let's target 1950 first.$SNDK
post-image
SNDK+11.51%
Bitcoin and Ethereum Could Gain Further Strength if Buyers Hold the Current Support Area
live-cover
LIVE1,192
🇺🇸 U.S. August NFP Beats Expectations — A Major Macro Signal for Crypto
The latest U.S. Non-Farm Payrolls (NFP) report has delivered a stronger-than-expected employment picture, putting macro markets back in focus. 📊🔥
According to the U.S. Bureau of Labor Statistics, total nonfarm payroll employment increased by 162,000 in August, while the unemployment rate remained unchanged at 4.1%. The August job gain was also well above the average monthly increase of 31,000 over the previous 12 months.
📌 Key Numbers
🔹 NFP: +162K jobs
🔹 Unemployment: 4.1%
🔹 Labor-force participation: 61.6%
🔹 Ave
NFP-1.31%
BTC-1.44%
📉 Big surprise in the jobs market! The U.S. added 162,000 jobs in August—triple economists' expectations! 🚀 Could this signal a bumpy road for $BTC ? What’s your take on the Fed’s next move? #CryptoNews
BTC-1.44%
WAL/USDT — A quiet recovery after a long downtrend
WAL is trading around 0.02619, up 4.22%, with price finally stabilizing after falling from the 0.12531 peak.
The bigger picture is still weak, but the recent structure is different: price has formed a base around 0.02001 and is slowly pushing higher.
Levels on my radar:
• 0.02646 — immediate resistance
• 0.03000 — key breakout area
• 0.04106 — major resistance
• 0.02001 — major support
• 0.02098 — SuperTrend level
MACD is improving and has moved back into positive territory, which supports the recovery idea. But the long-term performance is st
WAL+4.49%
  • 2
ZEC is currently distributing while consolidating at elevated levels, with strong overhead selling pressure at 1070 and 1099. The bulls’ lifeline below is at 999; if it breaks and the rebound fails to reclaim 1010, the price will likely decline to test support at 888. The hourly chart currently shows a head-and-shoulders pattern. Later, 1030–1040 can be lightly shorted.
post-image
ZEC+3.84%
Behind SanDisk’s 11.9% Surge! The Core Reason Revealed→_→
This morning, I called a long on SanDisk at 1732, now up 40+ points 💛
SanDisk surged 11.9% on heavy volume yesterday. Many friends only saw the stock price rally, but failed to understand the core catalyst behind it.
Major news has landed: S&P Dow Jones officially announced that SanDisk will be added to the S&P 100 Index, effective September 21.
Don’t simply treat this as a nominal honor—it is a genuine positive catalyst driven by incremental capital.
The S&P 100 is a core broad-based U.S. stock index, tracked by passive ETFs and index
SNDK+11.51%
Good morning.
Get money.
Rise and shine.
post-image
JUST IN: A trader’s two FOMO trades led to roughly $907k loss across MEME and SLINK, underscoring the volatility and risk of meme tokens. Stay cautious and avoid chasing impulsive bets. $MEME $SLINK
post-image
MEME+7.40%
  • 3
$VRTX /USDT Perp – "Breakdown Below Averages – Short"**
**Trading Plan Short $VRTX
Entry: 545.90
SL: 548.50
TP1: 543.70
TP2: 540.50
VRTX is rejecting below the 548.9 Upper Band and the 560.7 high. The Bollinger Bands are expanding downwards. Short the current rejection, stop above the Upper Band, and target the 543.7 Lower Band.
post-image
VRTX-1.05%
  • 6
Load More

Join 40 M users in our growing community

⚡️ Join 40 M users in the crypto craze discussion

💬 Engage with your favorite top creators

👍 See what interests you

View More