#BTC跌破8.2万 Technical read at $81,668: what the chart says about 81K and 80K
BTC is trading near $81,668, and the question on everyone's screen is whether 81K can hold or 80K gets tested next. Here is the technical picture, level by level, with no guesswork.
Where we came from
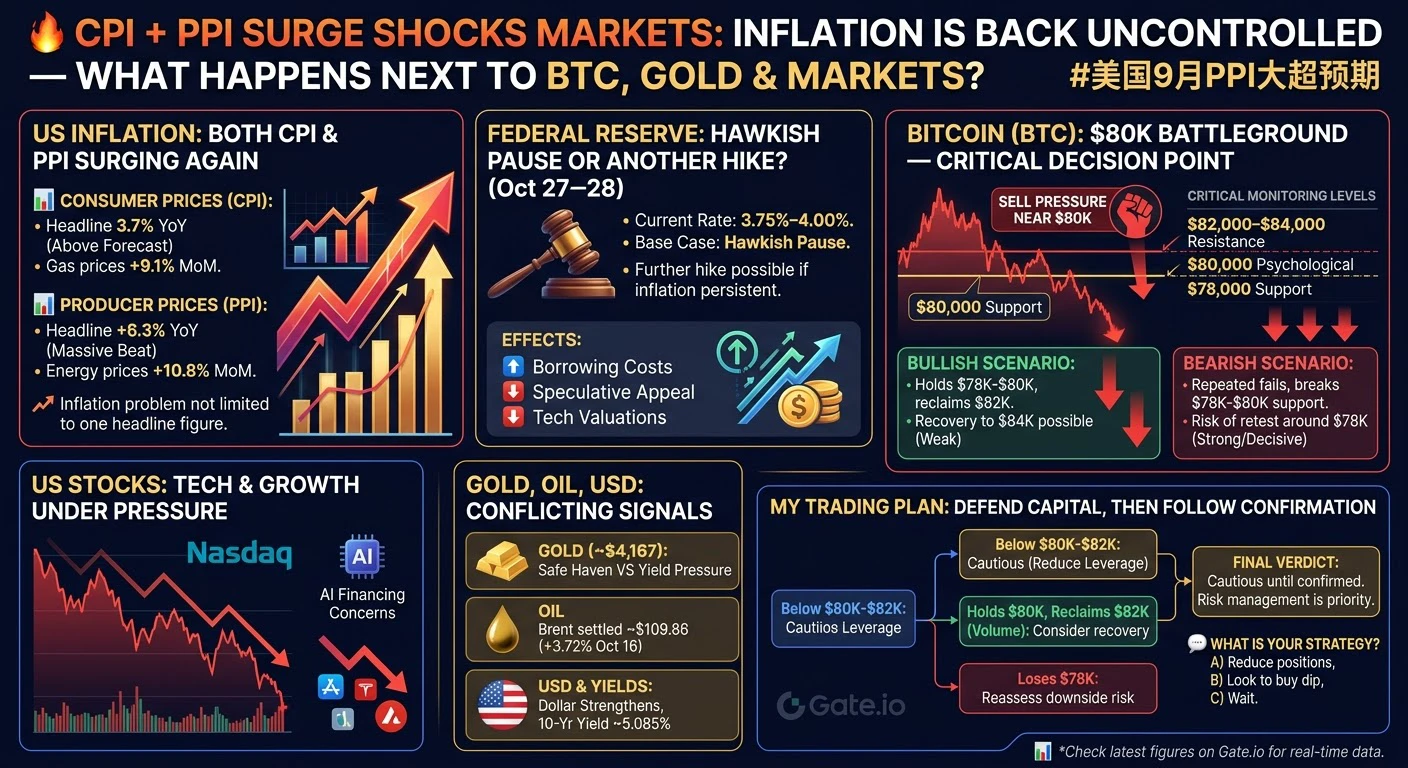
Early October looked bullish. BTC ran toward $87,000, then was rejected near that level on October 5, which triggered a cascade of leveraged long liquidations. The week's high was $84,323.70 on October 12, and the low was $79,841.60 on October 15, right after the hot CPI (3.7% year over year, core 2.6%). That is a 5.6% we