Square
Following
Hot
News
Notifications
Profile
Share your thoughts
placeholder
Article
CRYPTO BEST TRADING
live-cover
LIVE2,207
Many traders expect a pullback after BTC rises, hoping to get a better entry. But a pullback is not always an opportunity; sometimes it can signal that a downtrend is resuming. The key is to assess whether support is holding and whether the overall market trend remains healthy.

First, look at the strength of the support level. If an area has seen rebounds multiple times in the past, it may have strong buying demand. When the price returns to that area, watch closely to see whether buyers step back in.

Second, look at changes in trading volume. If volume gradually declines as the price pulls
BTC-0.67%
Trenches
mihao
m
bade
b
mihao
4Cxj...pump
Market Cap
$.
Change
.
24h Vol
$.
Holders
.
IDOL
I
bade
b
IDOL
0x3b...ab07
Market Cap
$.
Change
.
24h Vol
$.
Holders
.
FOOD
F
bade
b
FOOD
FTu5...pump
Market Cap
$.
Change
.
24h Vol
$.
Holders
.
Sakura
S
bade
b
Sakura
9sFG...pump
Market Cap
$.
Change
.
24h Vol
$.
Holders
.
NIO
N
bade
b
NIO
7SL2...pump
Market Cap
$
Change
.
24h Vol
$.
Holders
.
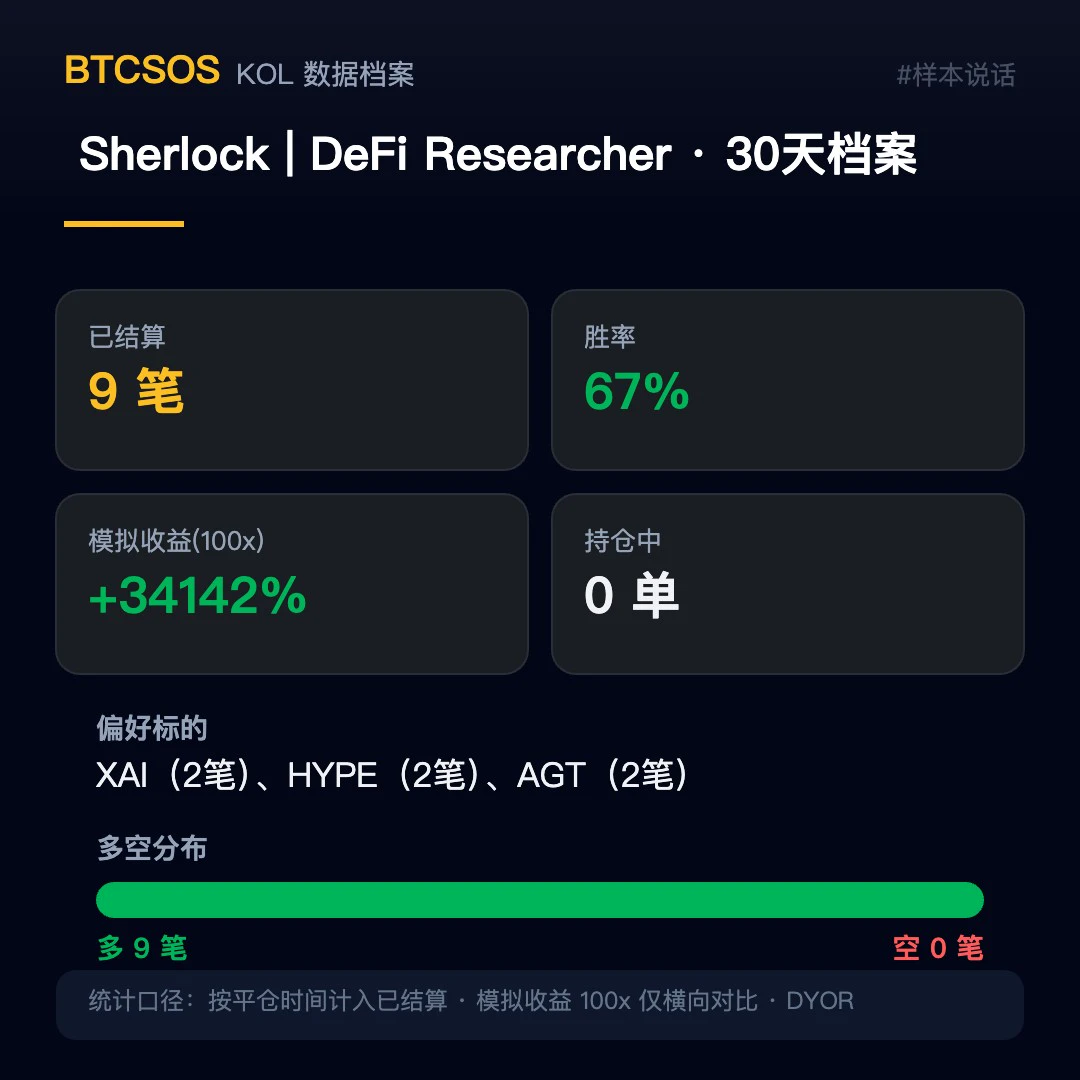
📊 KOL Data Profile | Sherlock | DeFi Researcher
Past 30-day window: 9 settled trades, 6 hits, 67% win rate, simulated return (on a 100x basis) +34142%.
Preferred assets: $XAI , $HYPE , and $AGT with 2 trades each; direction breakdown: 9 long / 0 short—an out-and-out long-only trader. No open positions currently.
Come to think of it, I looked into her around 11-13 too: 5/7 hits and simulated returns of +33398% then; this time, 6/9 hits and +34142%—basically treading water. Steady, sure, but not exactly impressive 😂
Data is based on closing times, with all records documented and available for r
post-image
XAI-2.46%
HYPE+0.33%
AGT-26.77%
BTC-0.67%
$ZEC Recovery Faces Renewed Selling Pressure

$ZEC attempted to regain bullish momentum, but the latest recovery is showing signs of weakness. Buyers are struggling to maintain upward pressure, while sellers appear ready to take control again.

The $908–$911 region remains an important area to watch. Continued weakness could expose lower support zones, while a strong move above resistance would challenge the current bearish outlook.

Key figures

$908.94–$911.38 — Recent price recovery zone

$928.06 — Key resistance and invalidation level

$884.88 — First downside support

$860.10 — Second su
post-image
ZEC+1.16%
  • 2
  • 1
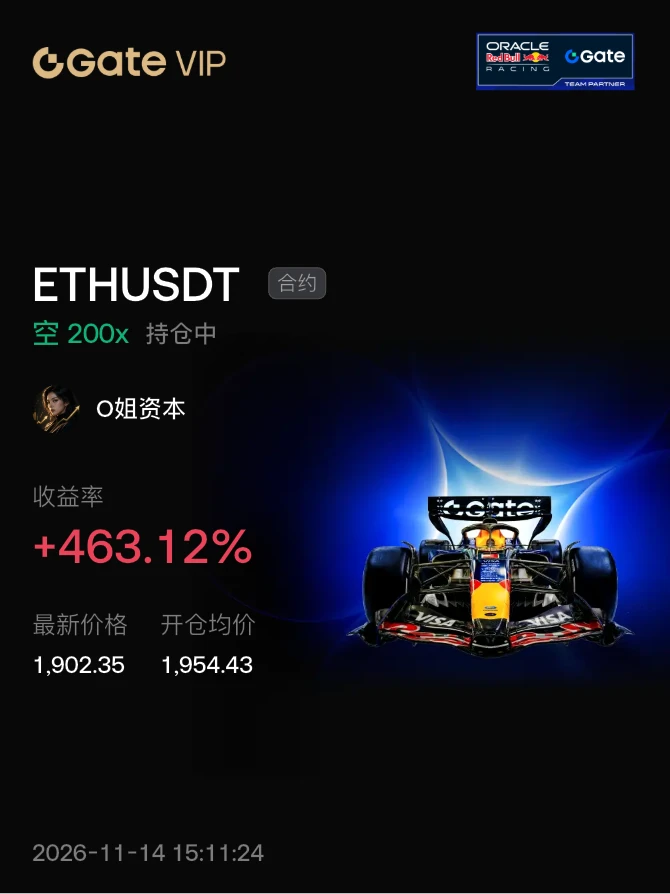
#晒出我的持仓收益 ETH is dropping pretty steadily too. Going live in a bit
post-image
ETH-1.23%
  • 1
  • 1
Do one good deed each day,
Day 7 of picking up litter😁
Bending down isn’t weakness; it’s letting go of arrogance.
Revere nature. As we bow and bend,
we pick up civility and cultivate peace of mind.
Reviewing my live BTC and ETH trading strategies over the past two weeks: 43 trades, 38 profitable, for an overall win rate of 88.4%.

BTC gained a cumulative 19,901.9 points, while ETH gained a cumulative 833.2 points.

The biggest change over these two weeks was that my trading approach followed the market.

In the first week, the market still offered clear opportunities amid volatility and rebounds. I traded both long and short, followed price action, and didn’t pass up opportunities.

By the second week, BTC and ETH began weakening steadily. Rebounds grew increasingly weaker, and overall h
BTC-0.65%
ETH-1.23%
Billion-dollar Bitcoin losses are becoming increasingly common
live-cover
LIVE2,558
You can’t find long pig tails for sale anymore.
post-image
🤑Gate X Master Grid Bot Event
🪙Reward 10$ Bot Trial Fund
🔥FCFS Eligible User

➡️Event Link: https://www.gate.com/campaigns/7022?ref=NEWGIFTS&ref_type=132

- Join & Register on Event
- Get 10$ Bot Trial Fund
- Use it & Make Your Profit
- Done
post-image
After a prolonged period of high intensity, Brother G no longer has the energy and vitality he used to.
post-image
Spot gold lost the $4,000 level this week under pressure from a strong dollar and U.S. Treasury yields, ultimately closing near $3,880. In terms of chart structure, the larger and smaller timeframes are locked in an intense bull-bear tug-of-war: the weekly chart formed a large bearish candle with a long body, erasing the gains from the previous rebound and confirming a broad medium-term consolidation as prices retreat from their highs; on the daily chart, prices broke below several key moving-average supports and are moving within a descending channel, with bears still in control. However, on
post-image
XAU+0.38%
BTC Sellers May Miss Out, Stacks Leader Warns
Muneeb Ali: Bitcoin May Have Already Bottomed
Muneeb Ali, co-founder of Stacks, believes Bitcoin may have passed the bottom of the current cycle and that the market is undergoing a correction early in the uptrend.
⚠️ Personal market analysis only. NFA — manage risk and DYOR.
Educational content, not investment advice or a recommendation to buy, sell, deposit, or withdraw any asset. No paid promotion or referral/affiliate links.
post-image
BTC-0.67%
STX+0.30%
BTC Multi-Timeframe Analysis: How Can Different Timeframes Improve Trading Accuracy?

In BTC trading, many people are used to watching 15-minute or even 5-minute candlestick charts for trading opportunities, but overlook an important point: short-term price movements do not necessarily reflect the market’s true trend direction.

Why do some people correctly predict short-term movements but still end up losing money? One important reason is that they fail to make an overall assessment using multiple timeframes.

First, use higher timeframes to determine the trend. You can use weekly and daily c
post-image
BTC-0.67%
Why is everyone saying Dog King is taking off?
Which Dog King are you guys trading?
How come I’m trading this Dog King?
post-image
Yesterday $XAUUSD
First evening trade
The 3897 long position was adjusted to 3895 and reached a high of 3905.88.
It was just 50 points—or a $5 move—away from triggering the win condition, but unfortunately, the price reversed and triggered the SL.
Second evening trade
Notification: Continue going long at the market price of 3893, with the SL still at 80. At the time, the price had already fallen into the drawdown zone, around 3889.
Ultimately, the 1R win condition was met.
3997 long position
XAUUSD+0.00%
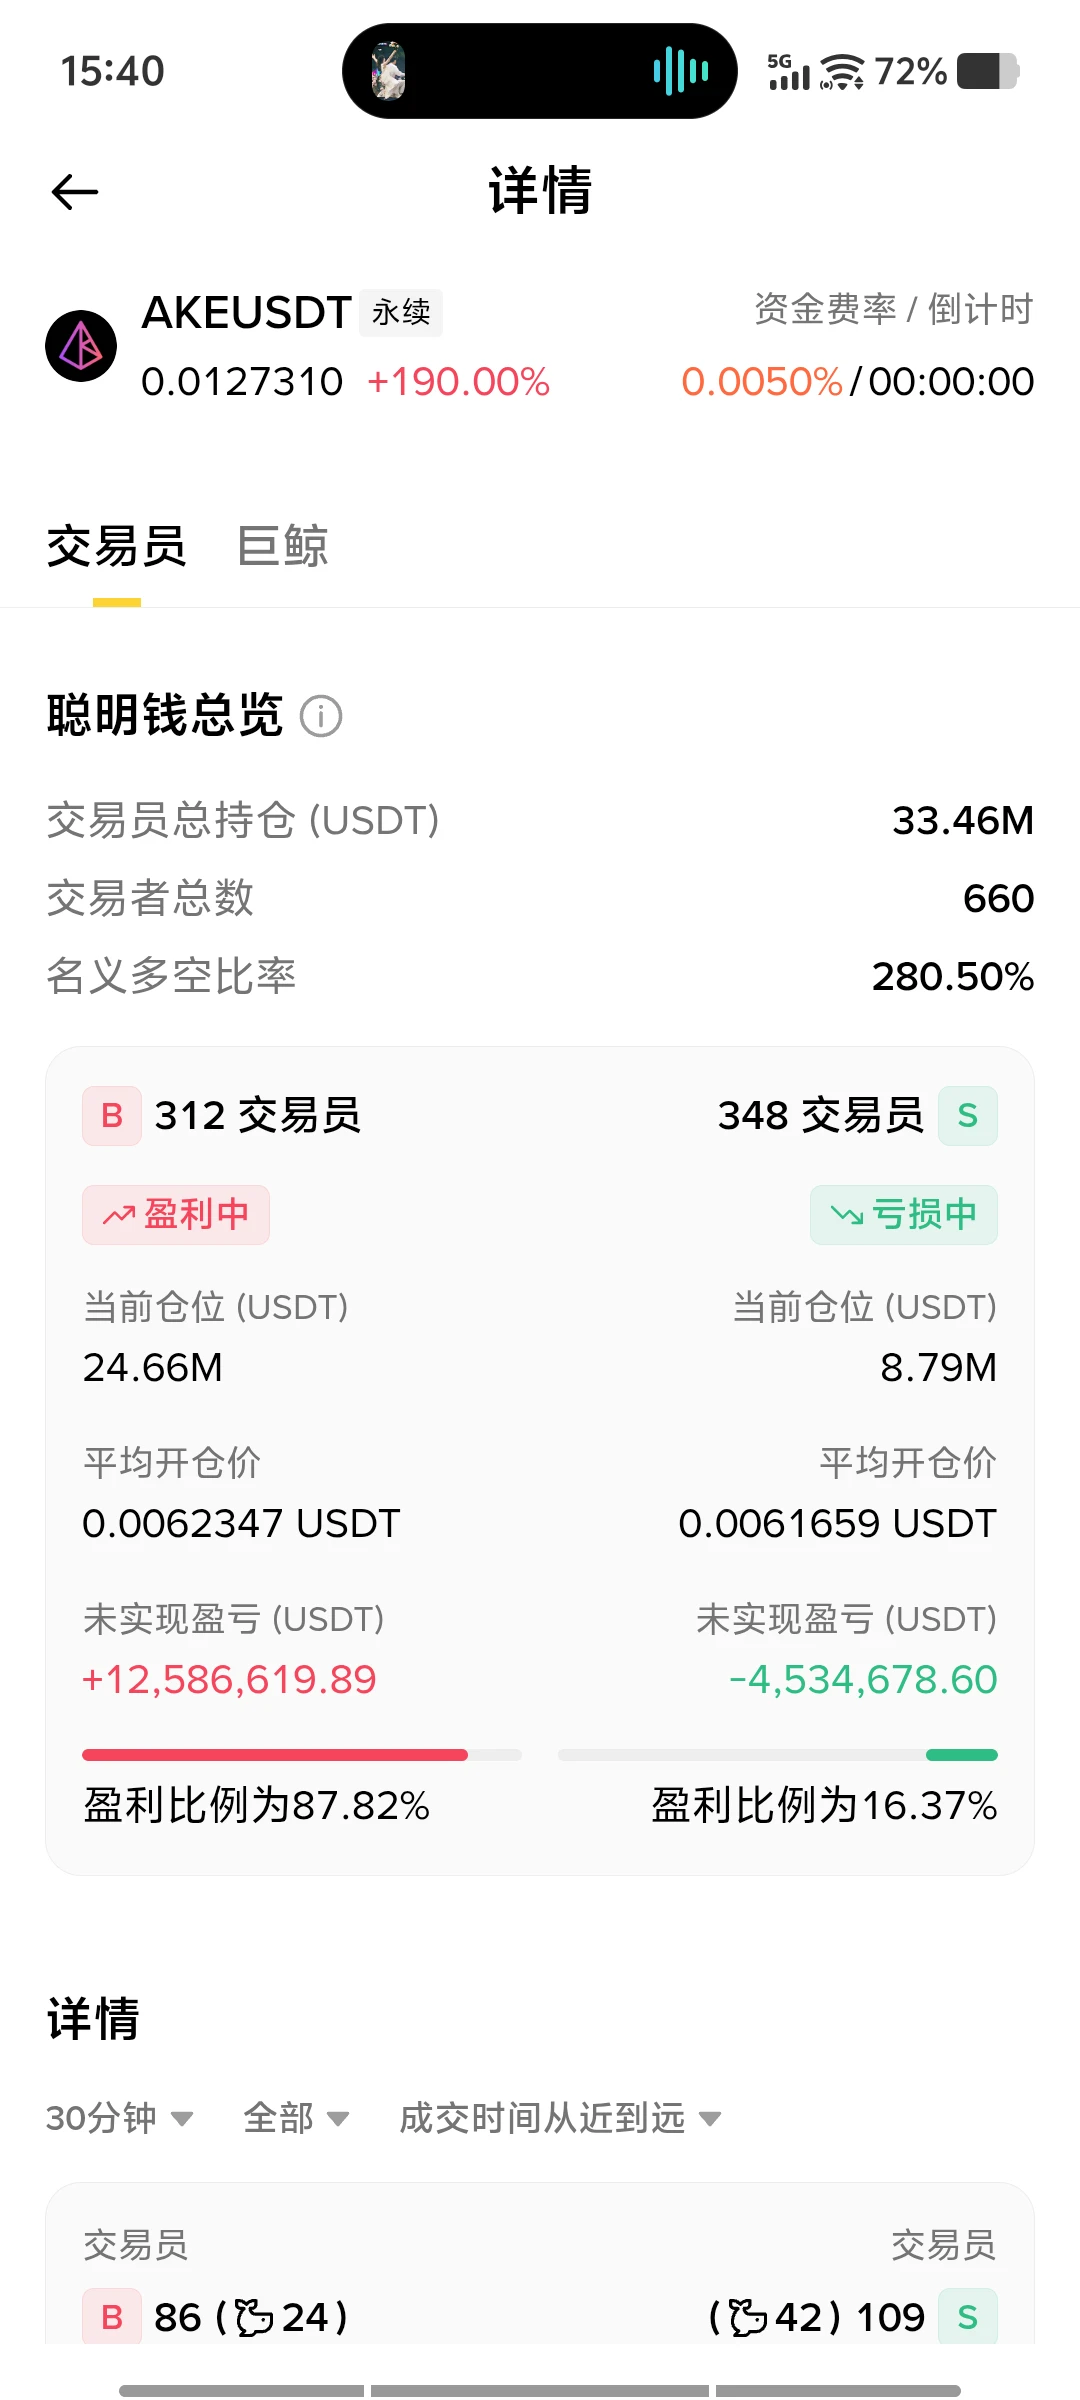
$AKE Look at this monster fighting back during the downturn

Since the last high of 0.89

$CORE there have already been 12 times

it has approached the 60-day moving average but failed to break through

This is also why many big capital players have been worn down and left

Many are also in despair

So $BEAT the entire altcoin sector has lost its way
#比特币跌破7万美元
post-image
AKE+6.07%
CORE+1.11%
BEAT-1.19%
BTC-0.67%
  • 1
How to Set Reasonable Stop-Loss and Take-Profit Levels in BTC Trading?

In BTC futures trading, many people spend a lot of time looking for the best entry point, but overlook two more important questions: If the market outlook is wrong, where should you exit? If the market moves as expected, where should you lock in profits?

In fact, entry determines the start of a trade, while stop-loss and take-profit determine its final outcome.

First, stop-loss levels should be based on something. Don’t arbitrarily set a fixed loss amount; instead, determine the stop-loss level based on important support
post-image
BTC-0.65%
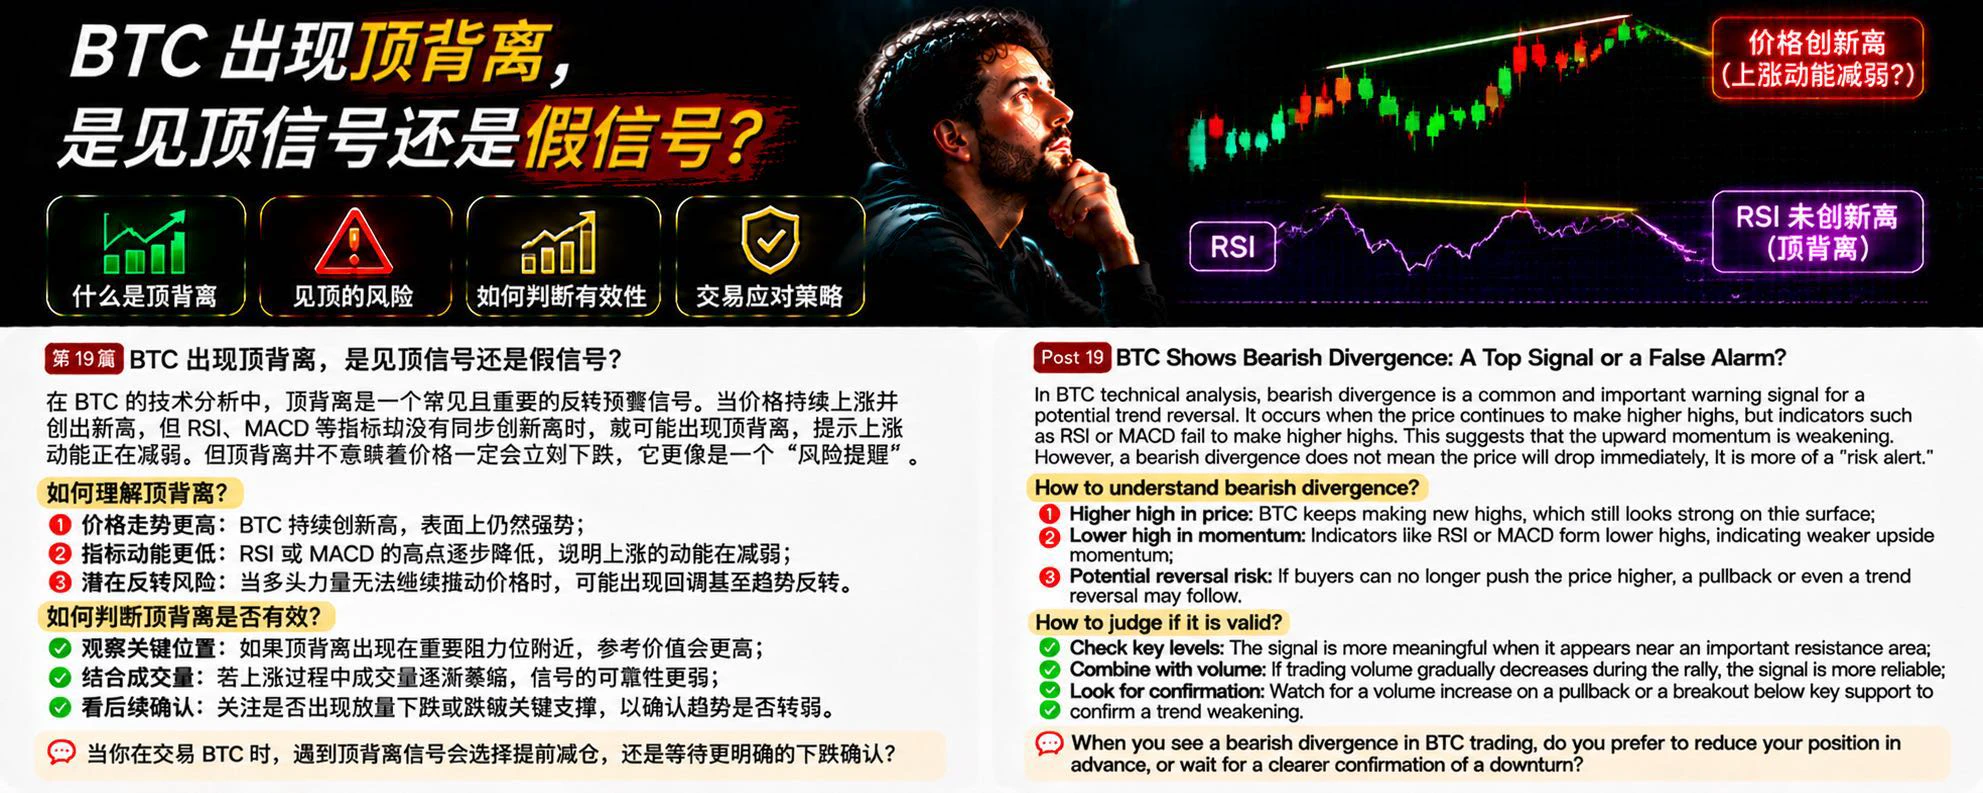
In BTC technical analysis, bearish divergence is a risk warning signal worth watching. Many traders see prices continually making new highs and assume the uptrend remains strong. But if prices keep rising while indicators such as RSI or MACD fail to make new highs in sync, bearish divergence may occur.

What is bearish divergence?

Simply put, it occurs when the price makes a higher high while the technical indicator forms a lower high. This means that although the price is still rising, the momentum driving the rise may be weakening.

Why is bearish divergence worth watching?

First, upward m
post-image
BTC-0.67%
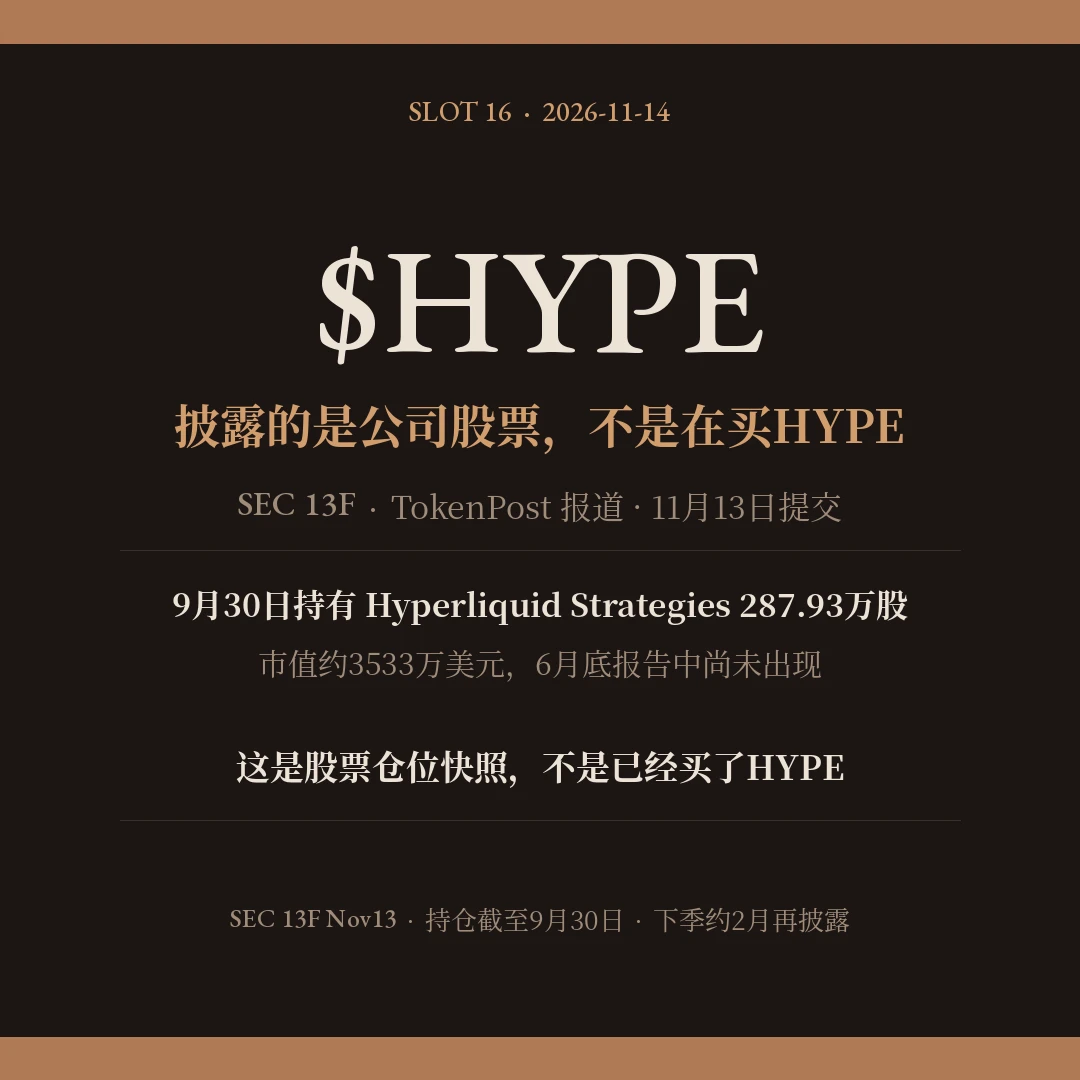
A headline saying “Pension fund buys HYPE” is easy to write. First, let’s see what the filing actually says.
On November 13, the Healthcare of Ontario Pension Plan (HOOPP) of Canada filed its third-quarter 13F holdings report with the U.S. Securities and Exchange Commission. TokenPost then reported based on the filing that, as of September 30 this year, the fund held 2.8793 million common shares of Nasdaq-listed Hyperliquid Strategies, worth about $35.33 million. The company did not appear in its end-of-June report. It is a publicly traded company that treats HYPE as its primary reserve asset.
post-image
HYPE+0.24%
Load More

Join 40 M users in our growing community

⚡️ Join 40 M users in the crypto craze discussion

💬 Engage with your favorite top creators

👍 See what interests you

Trending Topics

GateIPOAccessAnthropic

306.9K Views2.8K Discussing

Gate IPO Access Phase 3 features Anthropic (ANT), with USDT subscription interest starting from 100 USDT. Successful allocations will be delivered as real shares to Gate Stock Accounts. Indicative price: $70–$78/share Subscription: Nov 12–17 (UTC+8) Allocation is not guaranteed. Please manage risk accordingly.

Dr.HanOxfordUnionSpeech

147.3K Views587 Discussing

USOctoberPPIBelowExpectations

461.7K Views1.4K Discussing

View More