Square
Following
Hot
News
Profile

 Mon

20.97k Views98 posts
$MON
Steady climb from 0.020 to 0.024, now compressing just under the daily high. Volume is decent, MAs stacked bullishly. Break above 0.02462 opens the next leg; failure to hold 0.0237 invites a retest of the 5 MA.
• Entry Zone: 0.02340 – 0.02380
• TP1: 0.02460
• TP2: 0.02510
• TP3: 0.02600
• Stop-Loss: 0.02280
Levels are tight. Watch the high.
#MON #GTBurns2.57MInQ2 #PredictWorldCup🇵🇹vs🇪🇸 #VitalikUnveilsLeanEthereum #gStocksTokenizedStocksLive
post-image
MON-0.67%
  • 18
  • 2
🚀 🚀 🚀 𝐌𝐚𝐫𝐤𝐞𝐭 𝐀𝐧𝐚𝐥𝐲𝐬𝐢𝐬 | 𝐌𝐎𝐍/𝐔𝐒𝐃𝐓
Monad Protocol ($MON ) is consolidating within the $0.0248–$0.0260 range, testing key short-term dynamic moving average floors as price action builds a baseline. Buyers are looking to defend local support levels to prepare for a breakout attempt toward overhead supply zones.
📊 𝐊𝐞𝐲 𝐌𝐞𝐭𝐫𝐢𝐜𝐬
• Current Price: ~$0.0256
• 24H Range: $0.0247 – $0.0261
• Market Bias: Neutral / Consolidation 🐂
📈 𝐓𝐞𝐜𝐡𝐧𝐢𝐜𝐚𝐥 𝐇𝐢𝐠𝐡𝐥𝐢𝐠𝐡𝐭𝐬
• Moving Averages: Pressing against the 4H 20/50 EMA cluster ($0.0255–$0.0258), acting as the immed
MON-0.67%
  • 4
Robinhood listed $MON about 13 hours ago. It is down 10% since, sitting at the low of its 24-hour range with RSI at 21.
That is not a contradiction. It is what the float already told you.
Monad has 100B tokens and roughly 10.8B in circulation — 10.8%. FDV is $3.14B against a $306M cap. On October 2, CryptoRank flagged the Q4 unlock at about $521M, then 131.6% of market cap and the largest of the group it reviewed. At today's price that overhang is closer to 170%.
A listing gives a thin market a new door. Doors open both ways. $183M traded in 24 hours against a $306M cap, so this is not an ign
post-image
MON-0.67%
  • 5
  • 2
$MON is up 4.75%, trading around $0.02755.
While several assets are struggling, MON is showing relative strength. The important test now is whether buyers can protect the current move during the next pullback.
Hold the breakout, then continuation becomes interesting.
#MON #Monad #Crypto
MON-0.67%
  • 3
  • 2
$MON PRICE PREDICTION: IS A 1000% RALLY LOADING? 🚀
The #MON daily chart is holding its strongest support trendline since February. Higher lows are forming from $0.019 to $0.034, and buyers defended the demand zone again. Smart money is accumulating while retail waits.
✅ Entry Zone: $0.027 – $0.024
✅ Bullish Flip: Daily close above $0.036
❌ Stop Loss: HTF close below $0.0209
Macro Targets: $0.047 → $0.070 → $0.1 → $0.150 → $0.20 → $0.30
Monad Fundamentals: EVM-compatible parallel Layer 1, 300ms block time, and the fastest new L1 to reach $300M TVL.
Risk Alert: 16.8B MON token (Todays Worth $50
MON-0.67%
  • 2
📊 $MON (MONAD) TECHNICAL ANALYSIS & NEWS ROUNDUP | July 13, 2026
🔸 Current Price Action
MON is trading around $0.020–$0.022, with market cap near $260–267M. The token has been volatile since its November 24, 2025 mainnet launch, currently sitting ~55% below its all-time high of $0.0488 but up over 30% from its all-time low of $0.0162.
📉 Key Technical Levels
Resistance: Recent high near $0.022; a break above $0.041 would be needed to confirm a genuine bullish trend reversal per community-watched levels
Support: $0.020, with a deeper floor near $0.018; a critical psychological test sits at $
MON-0.67%
  • 2
🌅 Weekend Chart Musings: Finding the Rhythm in $MON ‌
As the traditional markets close their gates and the crypto space settles into its classic weekend drift, $MON is presenting a beautifully clean textbook structure. After a volatile week, the chart is letting its hair down, catching its breath, and giving technical analysts a pristine landscape to study.
Here is how the landscape looks as we head into the weekly close:
📊 The Technical Framework
The Granite Floor ($0.028 – $0.030): This continues to be the definitive line in the sand. Every time the price dips into this demand zone, buyer
post-image
MON-0.67%
  • 1
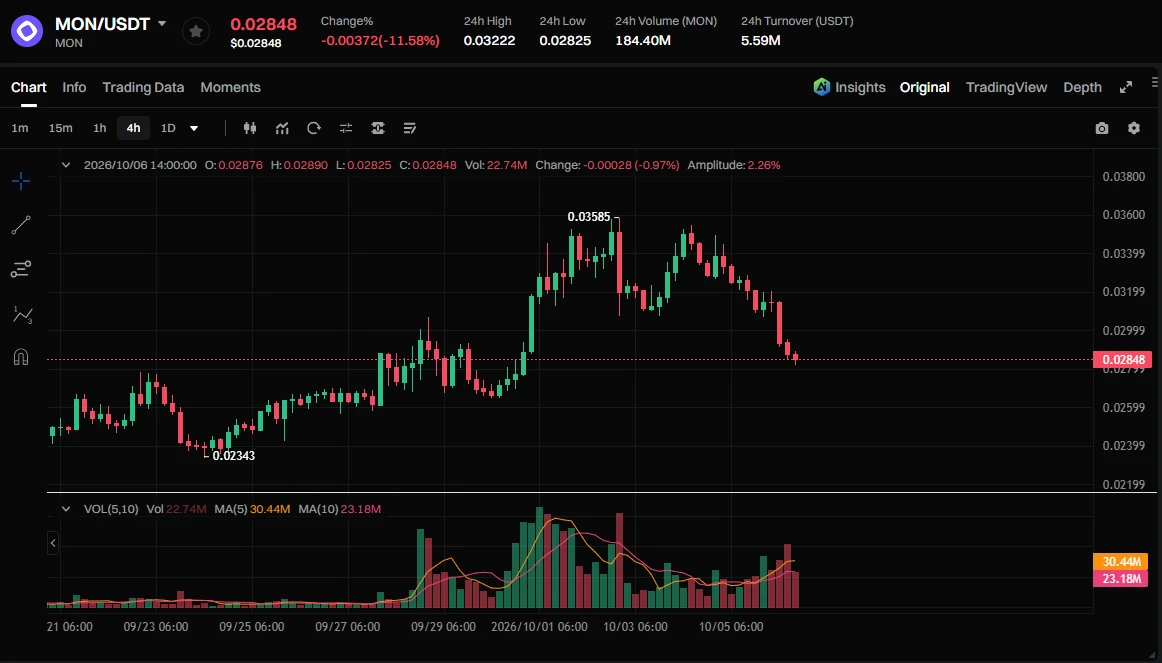
$MON around $0.03333 doesn’t feel healthy right now….. and I’m not going to sugar-coat it…..

This isn’t one of those “quiet accumulation” spots. Price has been leaking, bounces are weak, and every small push up gets sold into. That usually means confidence isn’t there yet.
At $0.03333, this looks more like a distribution / bleed phase, not a zone where smart money is aggressively stepping in. Chasing here is risky.
If you’re holding from higher levels, this is more of a sell / reduce exposure zone, not a fresh buy.
Levels I’m watching:
- Resistance: $0.03341 – $0.03406 (likely sell
post-image
MON-0.67%
Some strong charts out there. My favourites are #pump #aero and #mon for now. Looking for longs on sweeps of local lows and target new local highs...
Any other strong charts I'm missing?
PUMP-0.32%
AERO+2.39%
MON-0.67%
🔥 MON Liquidation Data - Aug 28
📌 Event Details:
- Short Liquidation: $2.1654K at $0.027
📊 Market Notes:
MON recorded a $2.16K short liquidation at $0.027.
🛡️ Disclaimer: This is market data only. Not financial advice. DYOR.
#MON #MarketUpdate
MON-0.68%
Load More