Square
Following
Hot
News
Profile
Share your thoughts
placeholder
Article
$IDOL — VOLATILITY EXPLOSION! 🔥
$IDOL recorded a $5.0005K short liquidation at $0.01950. Despite this bullish liquidation event, price has faced selling pressure after its recent rally. Buyers need to defend the nearby support zone to keep recovery hopes alive. Support: $0.0167–$0.0151. Resistance: $0.0180–$0.0195. Target 🎯: $0.0200 / $0.0230 / $0.0250. Next Move: Reclaiming $0.0195 could attract fresh buying pressure, while rejection may lead to another support test. Pro Tip: IDOL is highly volatile, so secure profits gradually and avoid excessive leverage.$NVDA ‌$AMZN ‌
post-image
IDOL-6.71%
NVDA-4.16%
AMZN-1.55%
  • 1
Morning Market Update
live-cover
LIVE1,945
Trenches
KIM
K
bade
b
KIM
8pjf...pump
Market Cap
$.
Change
.
24h Vol
$.
Holders
.
ZIG
Z
bade
b
ZIG
0x8c...1145
Market Cap
$.
Change
.
24h Vol
$.
Holders
.
GTA6
G
bade
b
GTA6
4kjr...zDnz
Market Cap
$.
Change
.
24h Vol
$.
Holders
.
BTC
B
bade
b
BTC
C5xp...pump
Market Cap
$.
Change
.
24h Vol
$.
Holders
.
IDOL
I
bade
b
IDOL
0x3b...ab07
Market Cap
$.
Change
.
24h Vol
$.
Holders
.
CPI is coming out this week, with the FOMC right behind it on Wednesday—both landing at once. This could get rough. If inflation comes in hot again, rate-cut expectations will get pushed back, and stocks will take the first hit. I’ll put it this way: don’t guess the direction; wait until the data is out. If you think I’m talking nonsense, save a screenshot.
post-image
  • 8
$SPK Something’s off with these numbers. Yesterday I still had an order sitting at 0.0205, waiting for a rebound. Today, one big red candle sent it straight down to 0.0171, down 14% in 24 hours, with $20.1M in trading volume—the volume hasn’t dried up, but the price can’t hold.
Looking back at my trade: the day before yesterday, I saw it inching up from a sideways range around 0.019 and thought 0.020 was support. I entered with 30% of my position at 0.0203 and set a stop-loss at 0.0192. Then, in the early hours last night, it plunged straight through support, triggering my stop. I exited at a
SPK-0.60%
  • 5
  • 2
$PONS ‌
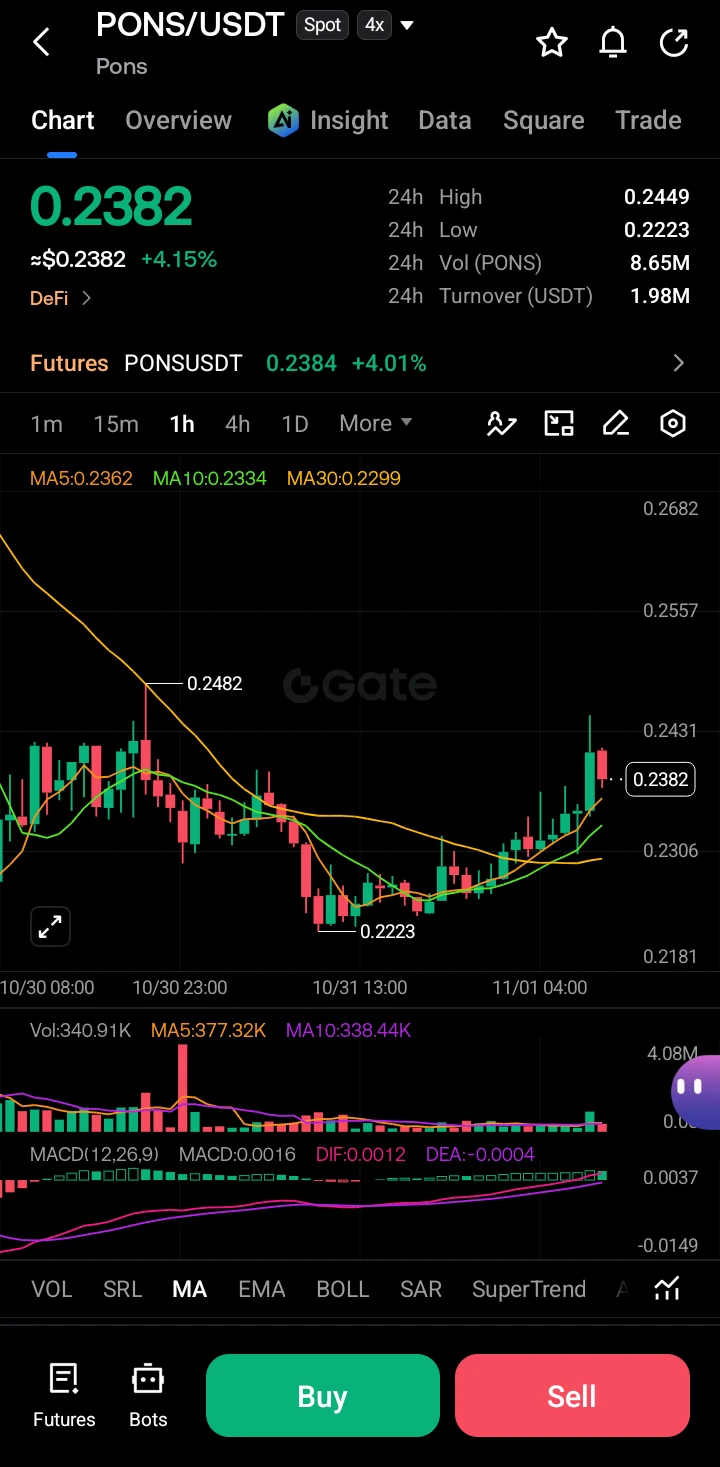
PONS is showing short-term bullish momentum, currently trading at 0.2382 (+4.15%). After a recent dip to 0.2223, the price has formed a V-shaped recovery, breaking above short-term moving averages (MA5, MA10) with rising volume.
Key Level
· Resistance: 0.2449 (24h High) / 0.2482 (Previous local peak)
· Support: 0.2334 (MA10) / 0.2299 (MA30)
Kline Deep Analysis
The 1H chart displays consecutive green candles indicating buyer strength. The price has reclaimed the MA30 line, turning it into dynamic support. The MACD shows a bullish crossover above the zero line (DIF > DEA), and the histo
post-image
PONS+4.32%
  • 7
  • 1
$QQQ
$AAPLB $NVDAB Trump says tech stocks will skyrocket today. Is that true? Then I’m going to buy the dip
post-image
AAPLB
AAPLBApple
Pump.Fun
MC:$3.12KHolders:1
0%
QQQ+0.01%
$BTC — SHORT SQUEEZE INCOMING? 🚀
$BTC recorded a $6.6846K short liquidation at $77,727.80. Bitcoin is approaching an important decision zone where buyers need to step in and reclaim resistance. Support: $77,497–$77,199. Resistance: $77,881–$78,179. Target 🎯: $78,403 / $78,806 / $79,200. Next Move: A confirmed breakout above $77,881 could trigger another short squeeze and push BTC toward $78,400. Losing support could bring another downside move. Pro Tip: Keep an eye on BTC volume and wait for candle confirmation before entering. $INTC ‌$NAS100 ‌
BTC-0.67%
INTC-28.49%
NAS100-2.31%
  • 1
🔥 $SKR Major shorting opportunity: SKR is showing strong bearish momentum after a sharp decline from its previous high. It is currently trading around 0.012930, with sellers continuing to pressure the market. The daily chart shows a clear bearish structure, with consecutive lower highs and lower lows. Buyers are struggling to regain control of the market, and the price could fall further if selling pressure persists. 📉Trade idea: Short $SKREntry: 0.01290 – 0.01350TP1: 0.01000Stop-loss: 0.018159TP2: 0.00500TP3: 0.000051Trade here $SKR : 👇
post-image
SKR-3.71%
XRP market update
live-cover
LIVE2,707
A brief analysis of BTC's short-term trend from the perspectives of Dow Theory, Chan Theory, Elliott Wave Theory, volume-price analysis, order flow, and price action (strategy recommendations)
Comprehensive assessment
The bearish trend remains intact under Dow Theory, but holding above 76,149 is a positive signal
Chan Theory: 76,149 is a candidate first-buy point; a bottom fractal is forming
Elliott Wave Theory: Wave C may have ended; rebound target is 78,500-79,500
Volume-price analysis: 2.3 billion in extremely low volume = both buyers and sellers have stepped aside; wait for confirmation fr
BTC-0.67%
#StrategySTRCNears100ParValue #ShareWeekly
Introduction
Strategy has become one of the most closely watched companies in the financial market because of its strong connection with Bitcoin. The company has developed a unique corporate strategy centered around Bitcoin accumulation, while also introducing financial instruments designed to attract different types of investors.
Recently, Strategy's STRC preferred stock has attracted attention as its market price approaches the $100 par value level. This development is important because it highlights the relationship between preferred stock pricing
post-image
BTC-0.67%
STRC-0.90%
#HYPERalliesAgainstTheMarket

Why Is HYPE Standing Out? A Beginner’s Guide to Hyperliquid’s Market Strength
Is it possible for one cryptocurrency to show strength while the wider crypto market is struggling? Yes. That is exactly why traders pay attention when a token moves differently from the rest of the market.
Hyperliquid’s native token, HYPE, has attracted attention after a strong weekly recovery. However, there is an important detail to understand: short-term price strength does not mean the token is rising every day or that it is immune to market pressure.
Here is what beginners should
post-image
AI
Kimi K3.1 Pro: Text Arena Rank Debut?
Top 20
24%4.17x
Top 10
10%10.00x
$7.01K 24H+1 more
HYPE+0.24%
Good morning, brothers! Let’s work hard together and get grinding!$BTC ‌$GT ‌$ETH ‌$SOL
BTC-0.65%
GT-2.24%
ETH-1.23%
SOL-0.74%
#GateSquareHalloween

Gate Square Halloween: Was It Just a Celebration, or a Chance to Turn Creativity Into Rewards?
What made Gate Square's Halloween Carnival different from an ordinary crypto event?
It was not simply about trading, collecting rewards, or celebrating Halloween. It gave community members an opportunity to share knowledge, express creativity, tell real trading stories, and connect with other people through original content.
With a total prize pool of 25,000 USDT, the campaign brought together social engagement, creative challenges, and trading experiences. More importantly, i
post-image
AI
Kimi K3.1 Pro: Text Arena Rank Debut?
Top 20
24%4.17x
Top 10
10%10.00x
$7.01K 24H+1 more
GT-2.41%
$UNI Long. Entry at 7.08, exit at 7.28, stop-loss at 6.98. That's it. Long zone 7.082–7.102 | Targets 7.161, 7.207, 7.276 | Stop-loss 6.977. Rationale: - 4-hour price is 7.09, above EMA50 at 7.05, with the trend structure still favoring buyers - Risk to the stop-loss is 1.6%, potential gain to the third target is 2.6%, and the final target offers about 1.6R. This is not investment advice; manage your position size accordingly.
post-image
UNI+3.05%
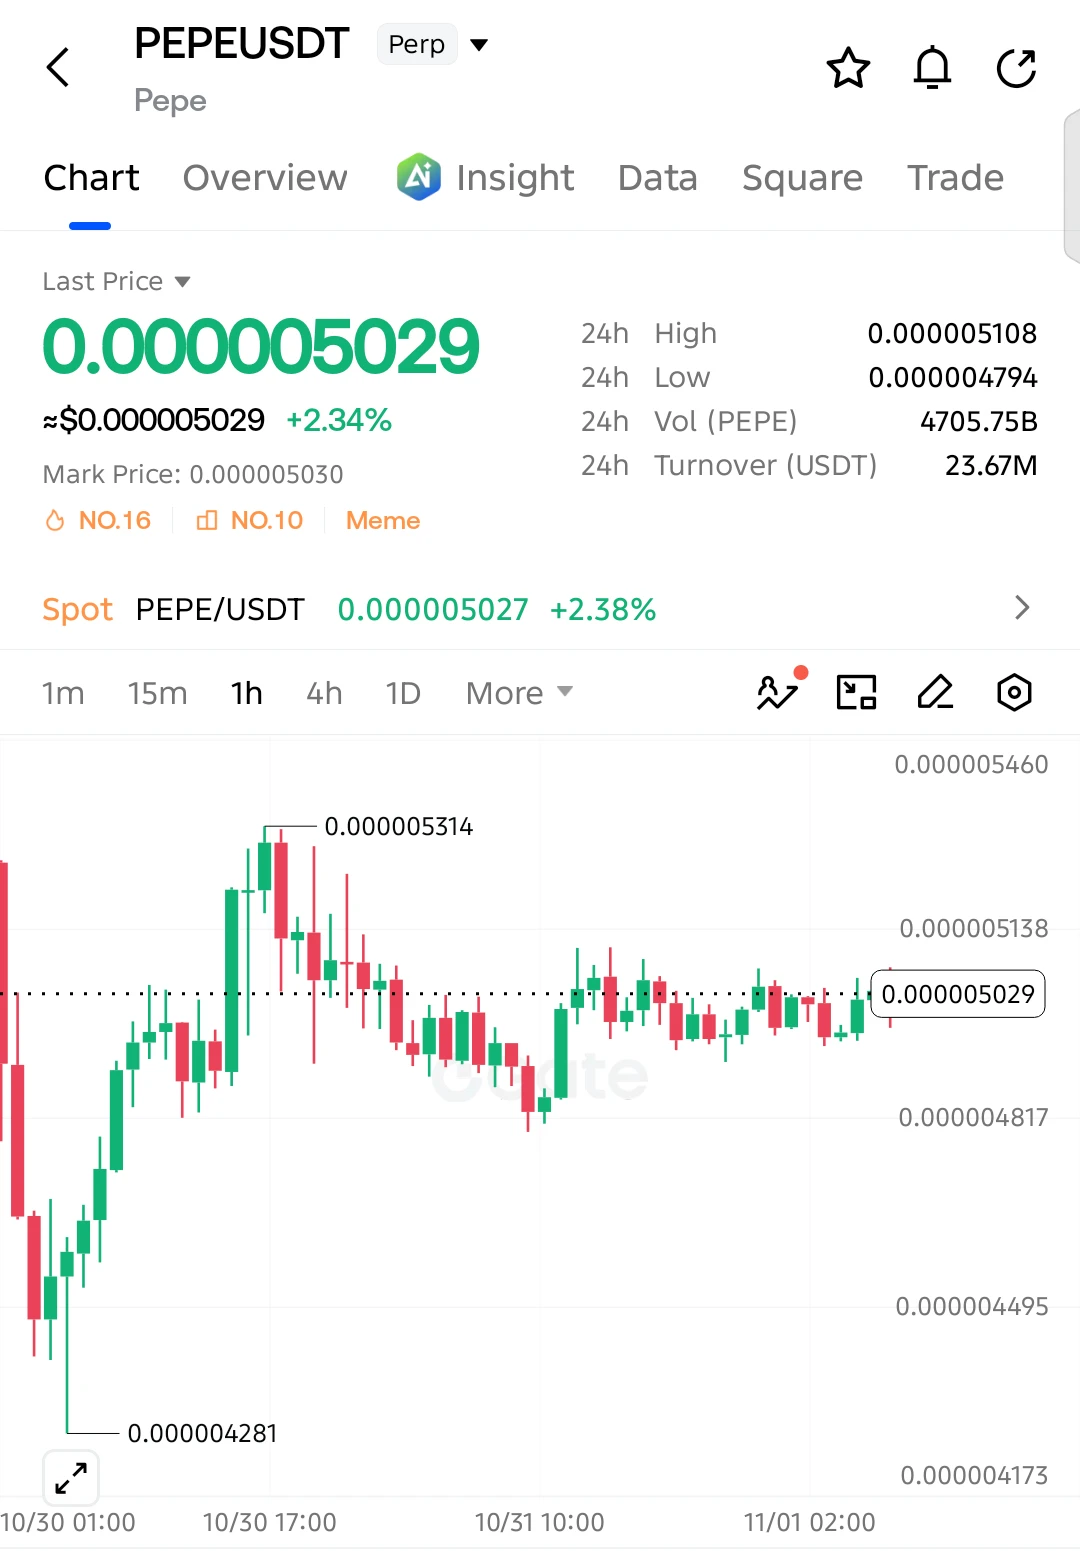
$PEPE LONG SETUP — BREAKOUT LOADING?
Entry: 0.000005029
SL: 0.000004790
TP1: 0.000005108
TP2: 0.000005200
TP3: 0.000005314
Final Target: 0.000005460
$PEPE is consolidating on the 1H chart after recovering from 0.000004281. Buyers are defending the 0.00000480–0.00000490 support zone, while price is testing resistance near 0.00000510. A confirmed breakout above this level could open the door toward 0.000005314 and beyond.
The bullish setup remains valid above 0.000004790. A breakdown below this level would invalidate the recovery scenario.
post-image
PEPE+0.97%
  • 5
  • 1
$AIOT Right now, it’s at 0.0877. It surged to a 24-hour high of 0.0943, then crashed back to 0.0718—a 22-point swing—with a 20.52% gain on the board and 91.8M in trading volume. This isn’t the work of retail traders; someone has already rotated their holdings while you were asleep. There are no hot sectors in the broader market today, and with funds having nowhere else to go, small-cap, high-volatility assets like AIOT have become temporary parking spots for short-term capital. Look at the 24-hour price action: from a low of 0.0718 to a high of 0.0943, it offered no comfortable entry point alo
AIOT-2.28%
  • 10
Load More

Join 40 M users in our growing community

⚡️ Join 40 M users in the crypto craze discussion

💬 Engage with your favorite top creators

👍 See what interests you

Trending Topics

BTC大跌

399.94k Views39.74k Discussing

$BTC briefly fell below $77,000 and remains under pressure around the $77K zone, with its 24-hour decline still above 4%. With risk appetite weakening and Fed uncertainty rising, where is the next key support after losing $80K?

IntelBeatsEarningsButStockPlunges

32.28k Views968 Discussing

StrategySTRCNears100ParValue

39.31k Views4.15k Discussing

View More