Square
Following
Hot
News
Profile
Share your thoughts
placeholder
Article
U.S. spot Bitcoin ETFs saw net outflows of $137.9 million yesterday.
According to data tracked by Farside Investors, institutional funds recorded another net outflow, making short-term market sentiment worth watching.
Combined with news that Arthur Hayes has closed out his altcoin positions, fund flows are signaling caution, but a single day of outflows is not enough to confirm a trend reversal.
Next, watch whether BTC prices can stabilize and whether ETF outflows continue. If funds keep exiting and prices weaken in tandem, pressure from a market correction could increase further.
Rather than
post-image
BTC-0.23%
Why does that number look so alarming every time, yet the stock market keeps grinding near its highs? The total market cap of the U.S. stock market is about 2.5 times GDP, and it’s been around that level for years—it didn’t just show up today. It’s more like a backdrop of long-term expensiveness than a precise market-timing button. People who treated it as a sell signal over the past few years probably got burned more than once. For example, from 2020 to 2021, the ratio kept rising amid low interest rates, an earnings recovery, and ample liquidity, while the S&P 500 climbed with some volatilit
post-image
SPYX-0.53%
SPX-4.14%
Trenches
ZIG
Z
bade
b
ZIG
0x8c...1145
Market Cap
$.
Change
.
24h Vol
$.
Holders
.
YMB
Y
bade
b
YMB
2TKD...pump
Market Cap
$.
Change
.
24h Vol
$.
Holders
.
AGT
A
bade
b
AGT
0x5d...e274
Market Cap
$.
Change
.
24h Vol
$.
Holders
.
CNPY
C
bade
b
CNPY
0xc6...ddd2
Market Cap
$.
Change
.
24h Vol
$.
Holders
.
BIRB
B
bade
b
BIRB
G7vQ...KNwG
Market Cap
$.
Change
.
24h Vol
$.
Holders
.
Isn't this me?
😭😭😭😭
post-image
The probability of the Federal Reserve keeping interest rates unchanged in October is currently esti
live-cover
LIVE1,882
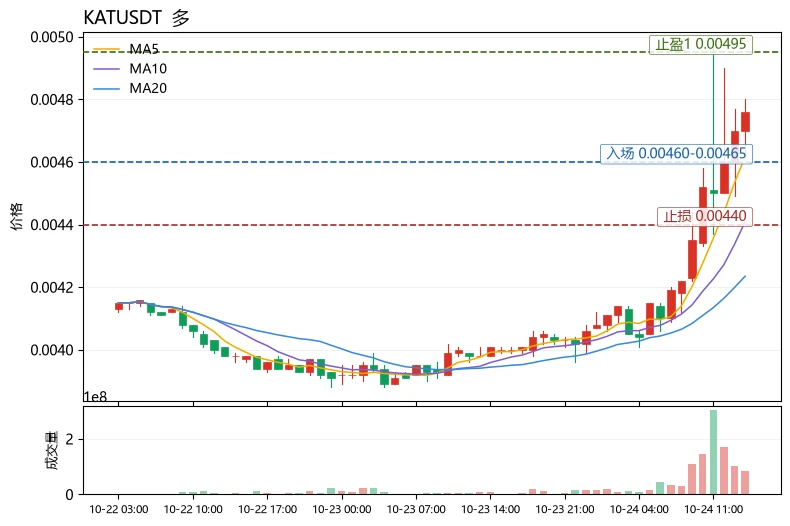
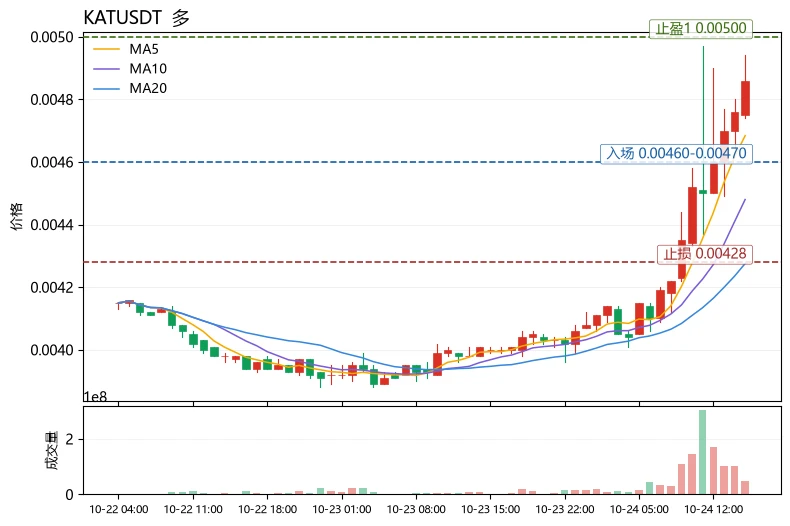
$KAT The current price of 0.00476 has already moved above the upper Bollinger Band at 0.00471113, and the RSI at 84.7 is severely overbought. Is it still worth chasing longs? No—don't chase the price, but the trend structure remains intact, so waiting for a pullback before entering is more reasonable.
Technical breakdown: MA5=0.004616 is above MA20=0.004235, with the short- and medium-term moving averages in a complete bullish alignment. The MACD histogram at +6.453e-05 remains positive, so trend momentum is still on the bullish side. However, the price has broken above the upper Bollinger Ba
post-image
KAT+10.85%
AERO-9.49%
ENA-5.08%
#GateSquareHalloween
The Scariest Thing in Crypto Is Not Halloween, It’s an Unexpected Market Move!
The crypto market sometimes feels like a real Halloween night. Everything looks calm one moment, and the next moment, a sudden price movement changes the entire situation. This is why I believe trading is not just about predicting prices; it is also about patience, discipline, and controlling emotions.
When the Market Becomes Scary
Imagine buying a cryptocurrency after seeing a strong green candle, only to watch the price suddenly turn red. Many traders experience this situation. Fear starts b
post-image
BTC-1.23%
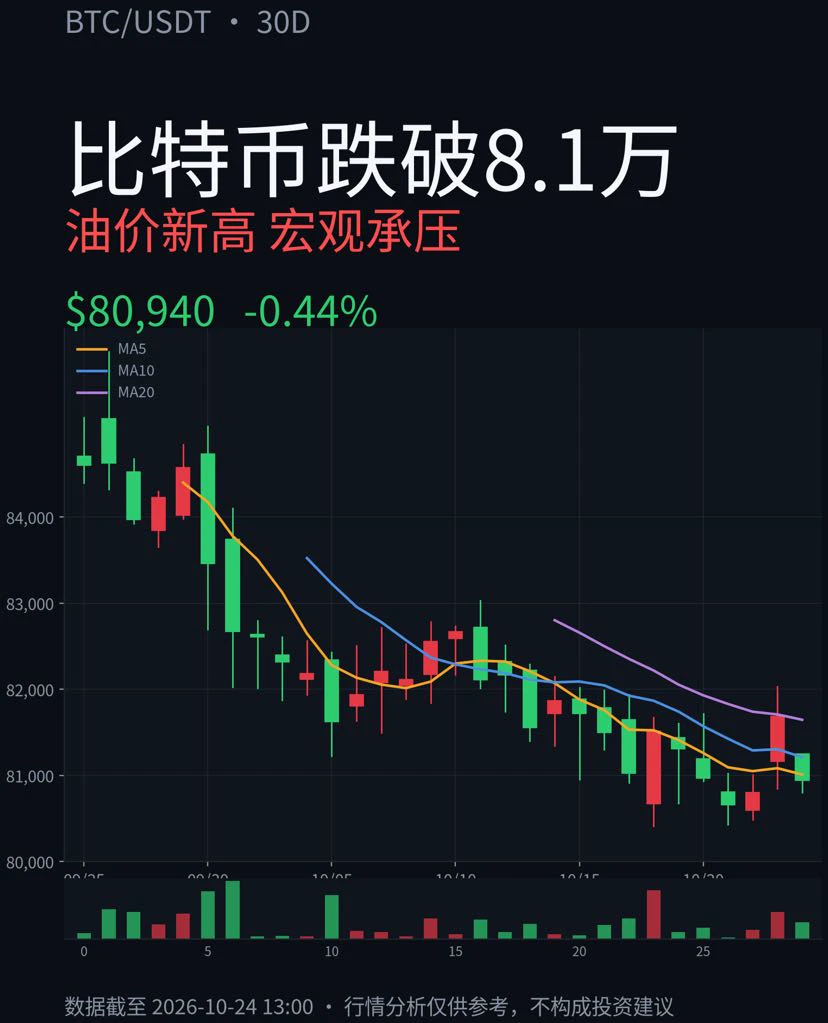
Bitcoin falls below $81k: Oil prices hit a 7-month high as macro pressures return
Market recap: As of 13:00 on October 24, BTC was trading at around $80,940 (24h -0.44%), falling back below the $81k level. Brent crude settled up 3.14% overnight at $116.72/barrel, its highest level in 7 months. The three major U.S. stock indexes all closed lower, with the Nasdaq posting its biggest one-day drop since June, as pressure on risk assets spilled over into the crypto market.
Bull and bear factors:
• Bearish factors: International oil prices surged on concerns over the Middle East situation and supply
post-image
BTC-1.23%
BZ+2.12%
NAS100+0.30%
GLDX+1.21%
PAXG-0.58%
  • 2
Bulls trapped after going long at 4200, don't play dead! Holding on will only wipe you out!
A stop-loss means taking a loss; holding on means risking your life! Being trapped isn't scary—the scary thing is pretending to be dead!
‍$XAU Flash crash, plunging 48 and hitting a low of 3985! Those who chased longs above 4200—are you watching your account balance bleed?
Capital flows are blood-red across the board, major players are fleeing, and panic selling continues! Although it's barely stabilized at 4003, bulls are extremely weak, and another bull trap followed by a sell-off could happen at any
post-image
XAU-0.62%
BTC-1.29%
Guys, no need to worry. President Trump will save the market; the drop is an opportunity for everyone. An opportunity to get low-priced tokens, yet no one thanks “him.” Great Trump!$BTC ‌$SNDK
post-image
BTC-1.29%
SNDK-5.76%
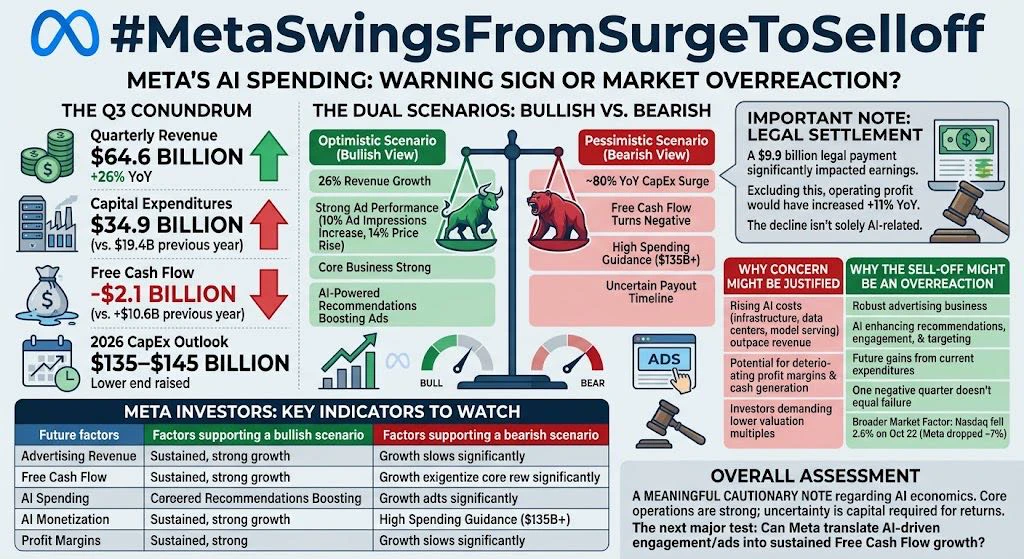
#MetaSwingsFromSurgeToSelloff
Meta’s AI spending: A warning sign, or an overreaction by the market?
The core question here is whether Meta’s AI expenditures are generating the potential for future earnings faster than they are consuming cash today.
The sharp shift in sentiment following the release of its financial results may reflect both a legitimate concern regarding rising costs and a short-term market reaction. Investors might have initially welcomed the strong revenue growth, only to reassess their valuation upon scrutinizing capital expenditures, free cash flow, and management’s plans
post-image
NDAQ-0.64%
October 24 He Yue$ZEC
📉 Direction: Short
📍 Initial position: Enter at the current price, 1200-1220
🎯 Zhiying: 1850-1700
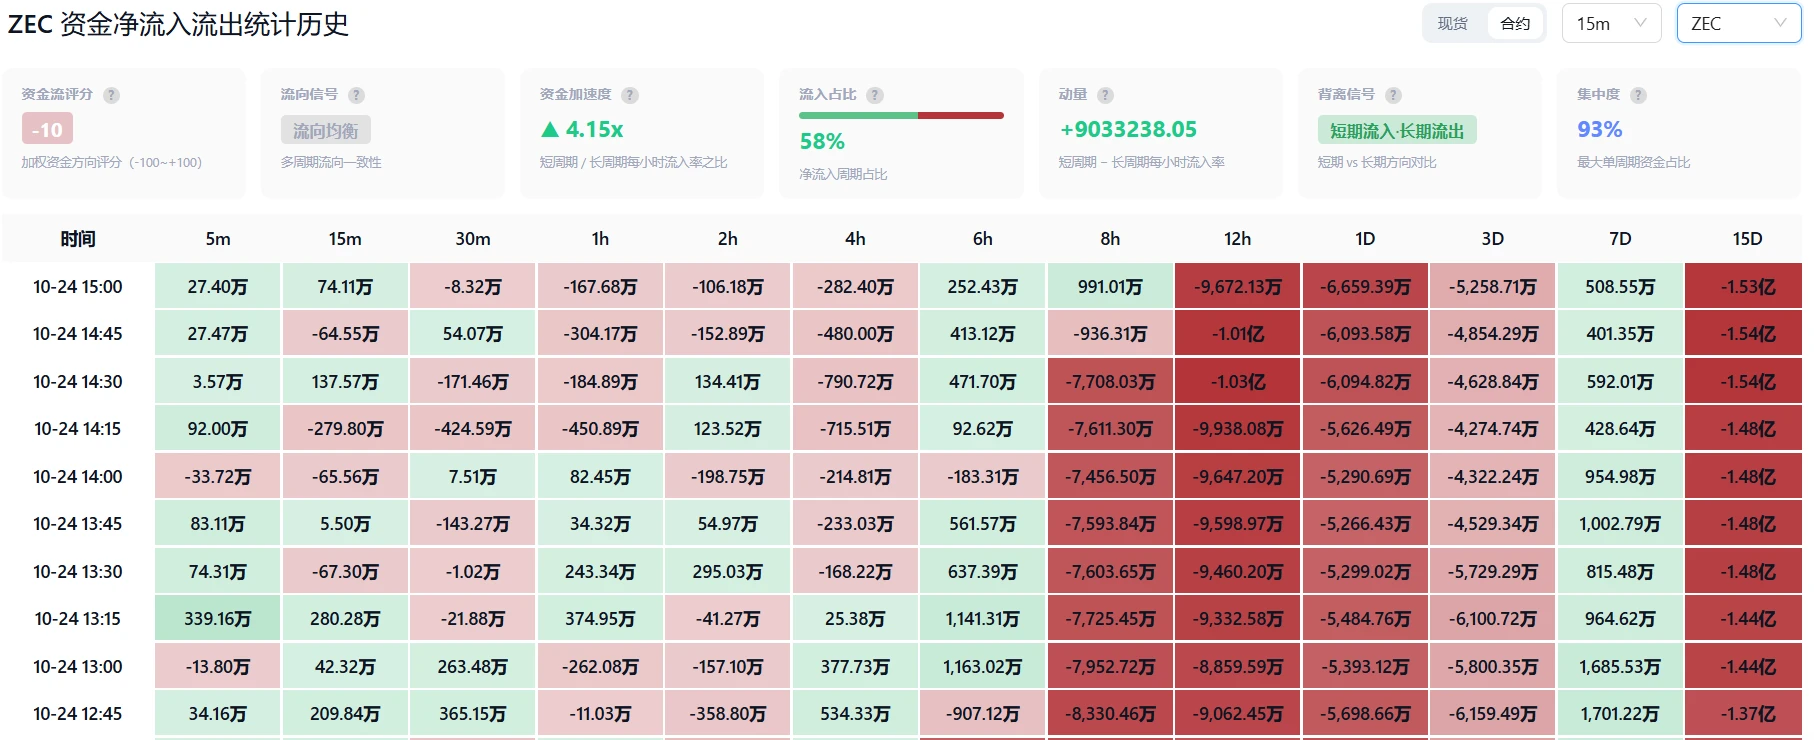
Short-term news headwinds: Although ETFs are a long-term positive, leveraged long positions have been brutally liquidated in the short term (accounting for 81% of liquidations), while the imminent NU7 upgrade has sparked anxiety about selling early-stage assets due to a “soft freeze.” Short-term bearish factors outweigh long-term positives.
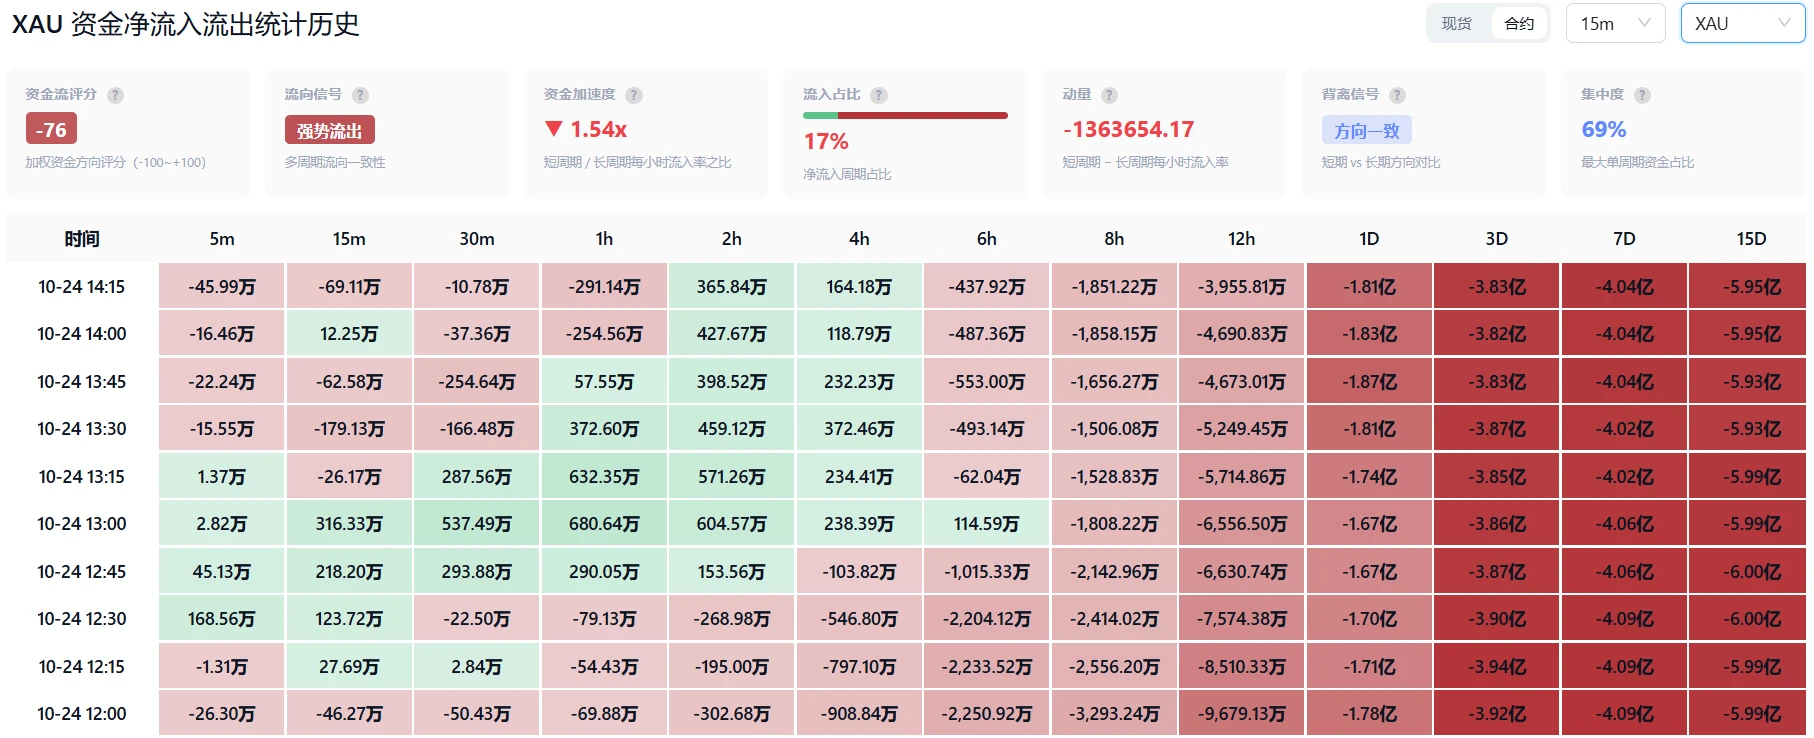
Extremely bearish fund flows: Large net outflows across longer timeframes such as 15D, 7D, and 1D (as high as -153 million over 15D);
post-image
ZEC-5.34%
ETH-1.47%
Many people treat “RSI overbought” as a direct short signal. This is a classic misuse of indicators. Overbought only indicates strong momentum; it does not mean the trend will reverse immediately. A genuine turning point depends on whether the moving-average structure and price position confirm it.
$KA currently shows this kind of strong structure: MA5=0.004684 has clearly crossed above MA20=0.0042755, with short- and medium-term moving averages aligned bullishly; the MACD histogram at +6.943e-05 continues to expand bullishly, with no signs of convergence. The only thing to watch out for is R
post-image
SNDKB
SNDKBSNDKB
Four.meme
MC:$3.87KHolders:1
0%
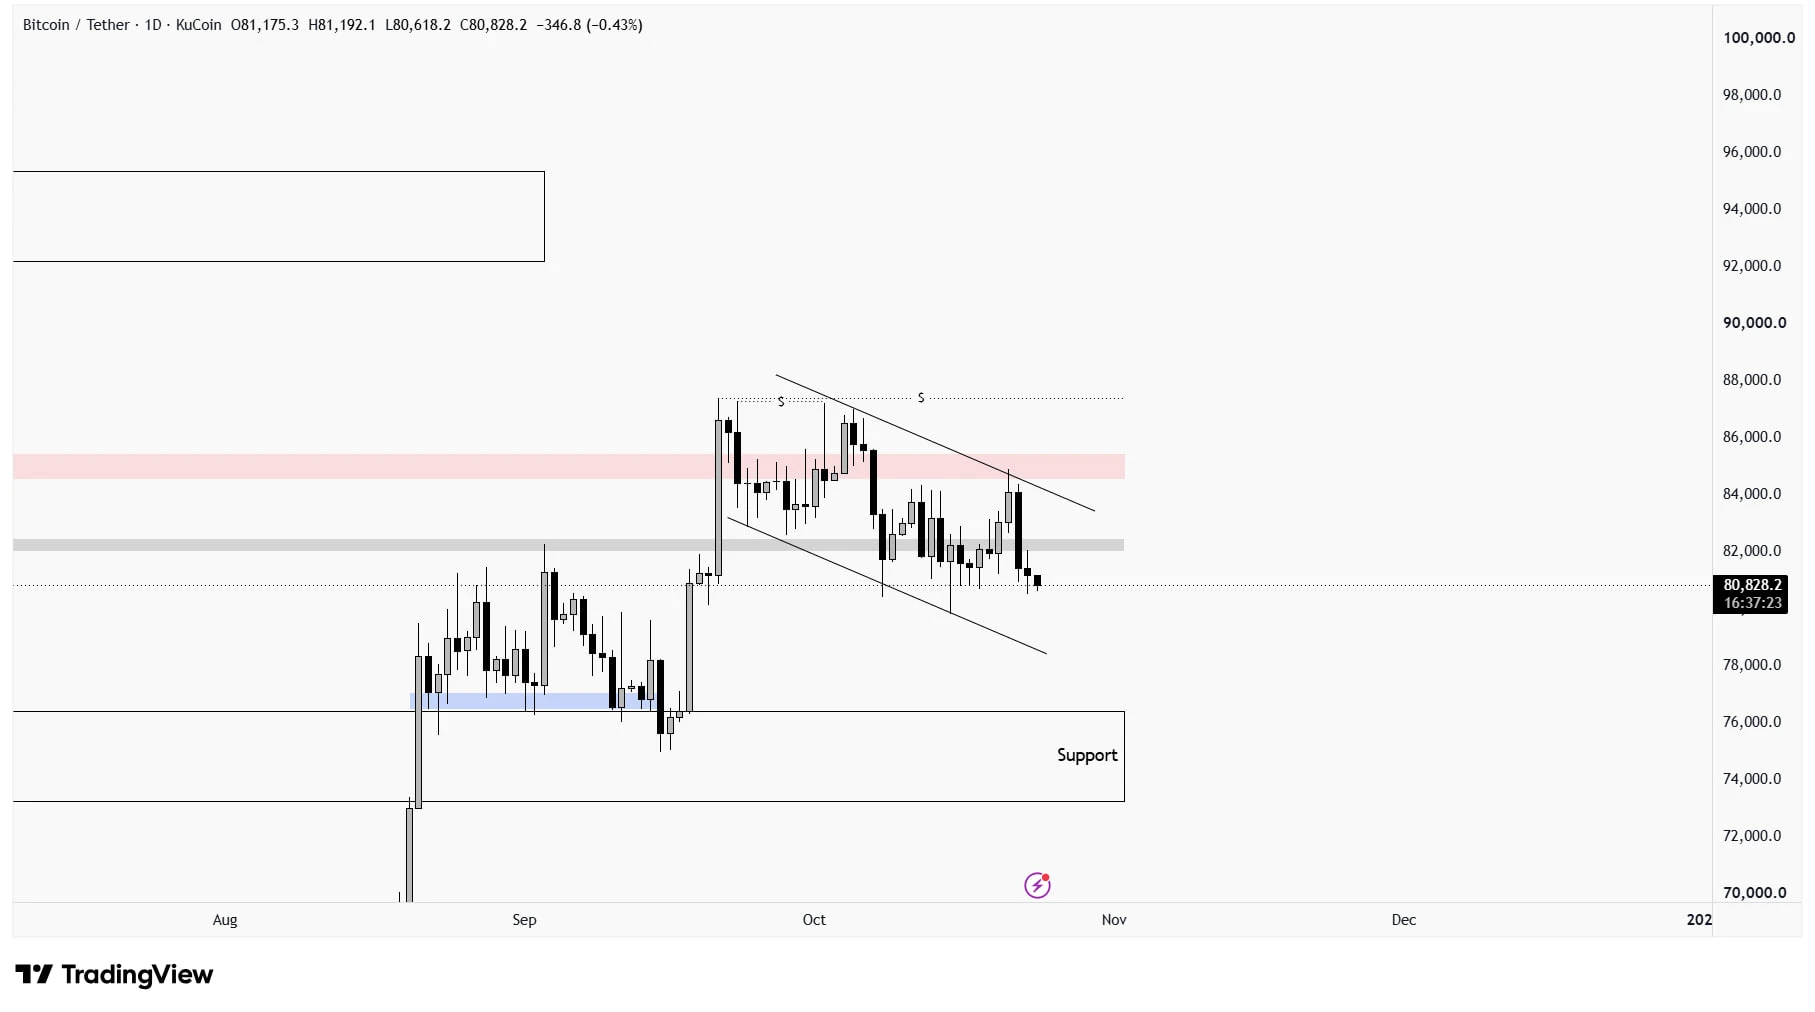
$BTC ISN’T OUT OF THE DANGER ZONE YET.
Bitcoin has retraced deeper, moving back and forth between key support and resistance zones. The price action is getting tighter, and a small flag/channel pattern is taking shape.
The level to watch: $78,500.
If selling pressure continues and BTC breaks down from this structure, a move toward $78,500 could be next.
But don’t count the bulls out just yet. If buyers defend support and push price back above resistance, the bearish setup could weaken quickly.
The next move depends on which side wins this battle.
Will BTC slide toward $78.5K, or will buyers s
post-image
BTC-1.23%
Bro, what I mean is, you’re definitely going to get scammed in an online relationship. You’ll buy a standing-room ticket on a green train from Hangzhou to Guangzhou to meet in person with some girl who’s VIP Level 5 on a dating app. I hope you don’t cry too much when it happens.
Did the limit order automatically stop me out last night? No worries, I'll trade the swings.
P.S. Is this fee for real?
Flipped to a short. Predictions are just predictions, but what I'm best at is still live trading. I'll adjust my strategy dynamically based on real-time market conditions. Shorting with a small 10% position, stop-loss at 2600+. Begging the dog market maker to liquidate me $ETH
ETH-1.47%
$BTC Bitcoin dominance is at a decision point.
Break above 61.5% and Bitcoin keeps leading. Alts stay weak.
Break below 58% and money starts rotating into ETH and alts.
ETH has done well these last 4 months, but that only continues if dominance starts falling from 61%.
BTC-1.23%
Put simply, it’s not that the boss’s tastes have changed; it’s that the boss’s children have grown up.
post-image
#USEarningsSeason 🚨🇺🇸 US EARNINGS SEASON HEATS UP — WALL STREET AT A CRITICAL TURNING POINT! 📊🔥
💥 BIG EARNINGS. BIG MOVES. BIG OPPORTUNITIES!
The US Q3 2026 earnings season is delivering major surprises as investors evaluate corporate profits, AI spending, and the outlook for the next quarter.
📈 WHAT'S MOVING THE MARKET?
🔹 META: Revenue surged 26% year over year, but heavy AI spending raised concerns.
🔹 TESLA: Revenue reached approximately $28.05B, while operating income declined.
🔹 AMERICAN EXPRESS: Investors are watching consumer spending and credit trends.
🔹 SLB: Energy investors
post-image
TSLA-0.62%
AXP-3.70%
SLB+6.99%
BTC-1.23%
Load More

Join 40 M users in our growing community

⚡️ Join 40 M users in the crypto craze discussion

💬 Engage with your favorite top creators

👍 See what interests you

Trending Topics

USEarningsSeason

36.79k Views3.16k Discussing

The U.S. Q3 earnings season is in full swing, with major tech companies including Tesla and Meta reporting results. Market focus is shifting beyond revenue and profit toward AI spending, capital expenditure, margins and forward guidance. Which company’s earnings are you watching most closely?

GateWCTCS9GlobalTradingCompetition

512.92k Views7.77k Discussing

USConsumerSentimentNearRecordLow

701 Views145 Discussing

View More