Square
Following
Hot
News
Profile
Share your thoughts
placeholder
Article
$VVV
UPDATE
#VVV is at strong support level. In this move we can see 50%+ gain here ✍🏻
#VVVUSDT #VVVBTC #BTC #Bitcoin #Nfts
VVV+8.44%
BTC+0.79%
#pi
I just saw a lot of people calling Pi garbage. I don’t want to argue with anyone, but I hope you’ll look at the broader market: Bitcoin is falling📉, and all coins are following suit. As the saying goes, when the nest is overturned, no egg remains intact.
The other coins you bought have also seen their profits pull back to varying degrees.
Isn’t that right, my fellow Pi fans?
PI-0.45%
BTC+0.79%
Trenches
TSI
T
bade
b
TSI
0xa8...1c1e
Market Cap
$.
Change
.
24h Vol
$.
Holders
.
CNPY
C
bade
b
CNPY
0xc6...ddd2
Market Cap
$.
Change
.
24h Vol
$.
Holders
.
AGT
A
bade
b
AGT
0x5d...e274
Market Cap
$.
Change
.
24h Vol
$.
Holders
.
BOOMER
B
bade
b
BOOMER
0x5a...5c00
Market Cap
$.
Change
.
24h Vol
$.
Holders
.
PIERRE
P
bade
b
PIERRE
D3S6...pump
Market Cap
$.
Change
.
24h Vol
$.
Holders
.
A Brief Analysis of BTC’s Short-Term Trend from the Perspectives of Dow Theory, Chan Theory, Elliott Wave Theory, Volume-Price Relationships, Order Flow, and Price Action (Strategy Recommendations)
Comprehensive Assessment
Dow Theory confirms a short-term trend reversal to bullish (both highs and lows are rising)
The Chan Theory center of consolidation is moving up, with a clear third-buy pullback zone
Elliott Wave ①-3-3 is starting, with a target of 83,400-84,800
Buying is returning in the volume-price relationship, but confirmation requires 15 billion+
Order flow: VA is about to be reclaimed
BTC+0.79%
$ETH
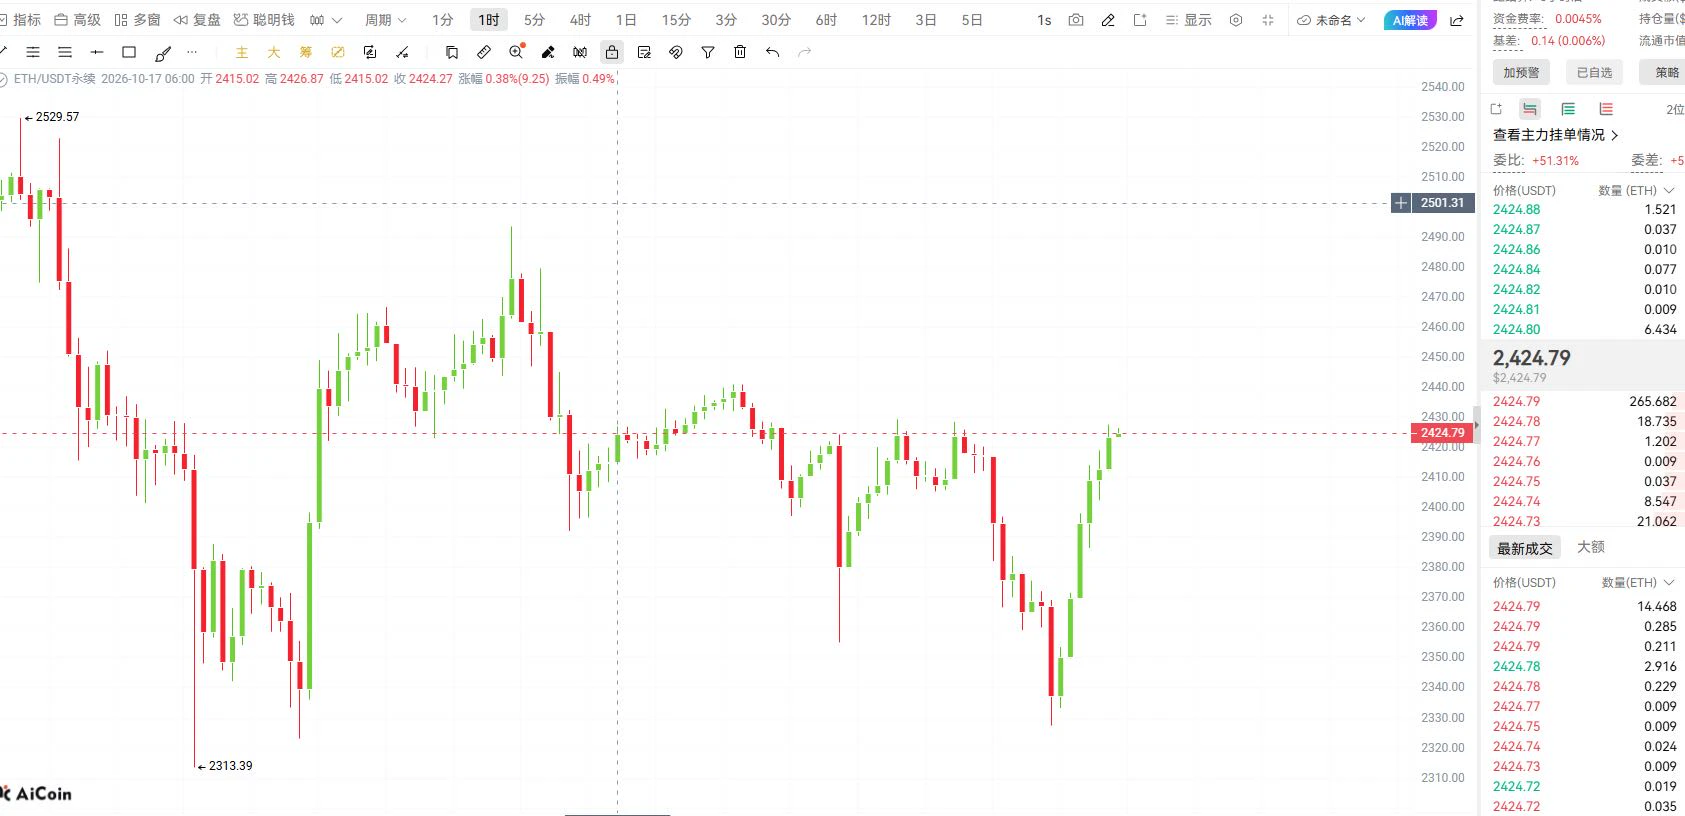
76.4% are crowded into long positions; even as prices fell, they kept cutting losses and exiting, while OI was slashed over the week😏 Shorts have been hammering the market for seven days, and that’s all they’ve got? Buyers are gradually stepping in above 2359. Grinding near resistance isn’t a bad thing; if it breaks through 2430, that’s a window for shorts to cover. I’m leaning bullish at this level.
post-image
ETH+0.20%
live market update
live-cover
LIVE2,060
#BitcoinTops$82K
Bitcoin is trading around the $82,000 area, but it is not comfortably above it. It fell to about $80,000 on October 15 after hot CPI and PPI data, then rallied sharply on October 17. Treat the level as a zone, not a settled breakout. Here is the post in English, with no hashtags, no stars, no tables or charts, and no banned terms.
Bitcoin Price Analysis for Monday, October 19, 2026: Can BTC Hold Above $82,000?
Bitcoin has been the center of attention this month, and the reason is simple. After weeks of trying to climb back toward the upper $80,000s, BTC has been pushed and pu
BTC+0.79%
  • 5
  • 1
#USMemoryStocksExtendLosses
📉 **US Memory Stocks Extend Losses — Is the Technology Sector Facing More Pressure?** 🇺🇸
The US memory stock sector is facing renewed selling pressure as losses continue to extend, bringing semiconductor market sentiment into focus. Memory chip companies play a critical role in the global technology industry, supplying essential components for data centers, artificial intelligence infrastructure, smartphones, computers, and other electronic devices. When memory stocks come under pressure, investors begin to reassess valuations, future demand, earnings expectatio
BTC+0.79%
Goldman Sachs is going deeper into digital assets.
The bank says it’s investing in digital-asset companies and building its own infrastructure for tokenized bonds, money-market funds and real estate.
This is bigger than a Bitcoin narrative.
Traditional finance is building for an on-chain future, and that could become a major catalyst for crypto adoption over time.
$BTC $ETH $SOL
GS-0.52%
BTC+0.79%
ETH+0.21%
SOL+1.05%
Bad Boy Watch: CL Crude Oil 10.19
At the start of the new week, crude oil is still the first thing on the Bad Boy’s radar. CL’s candlestick chart shows the rally losing steam, with a pullback to the 5- and 10-day moving averages looking likely.
On the 4-hour chart, MACD hasn’t shown any divergence yet, so the rally still has support.
Looking at the external environment, the U.S. should be making a move by now, right?
Let’s see if there’s another pullback today, perhaps to around 95.
A pullback in CL could also create an opportunity for U.S. stocks to rebound. If you’re holding a relatively lar
CL-1.51%
#USMemoryStocksExtendLosses #ShareWeekly
US MEMORY STOCKS FACE A NEW TEST: CAN AI DEMAND OUTRUN GROWING COMPETITION?
The recent weakness in US memory and storage stocks has raised an important question for investors: Is the AI memory boom losing momentum, or is the market creating a potential opportunity after an extraordinary rally?
Micron Technology (MU), SanDisk (SNDK), Western Digital (WDC), and Seagate Technology (STX) are under pressure as investors reassess valuations, competition, and the sustainability of AI-driven growth. In my view, this correction is not simply about falling share
MU-5.66%
SNDK-6.90%
WDC-6.91%
STX-7.45%
SK Hynix-3.06%
  • 3
  • 1
#美国9月PPI大超预期
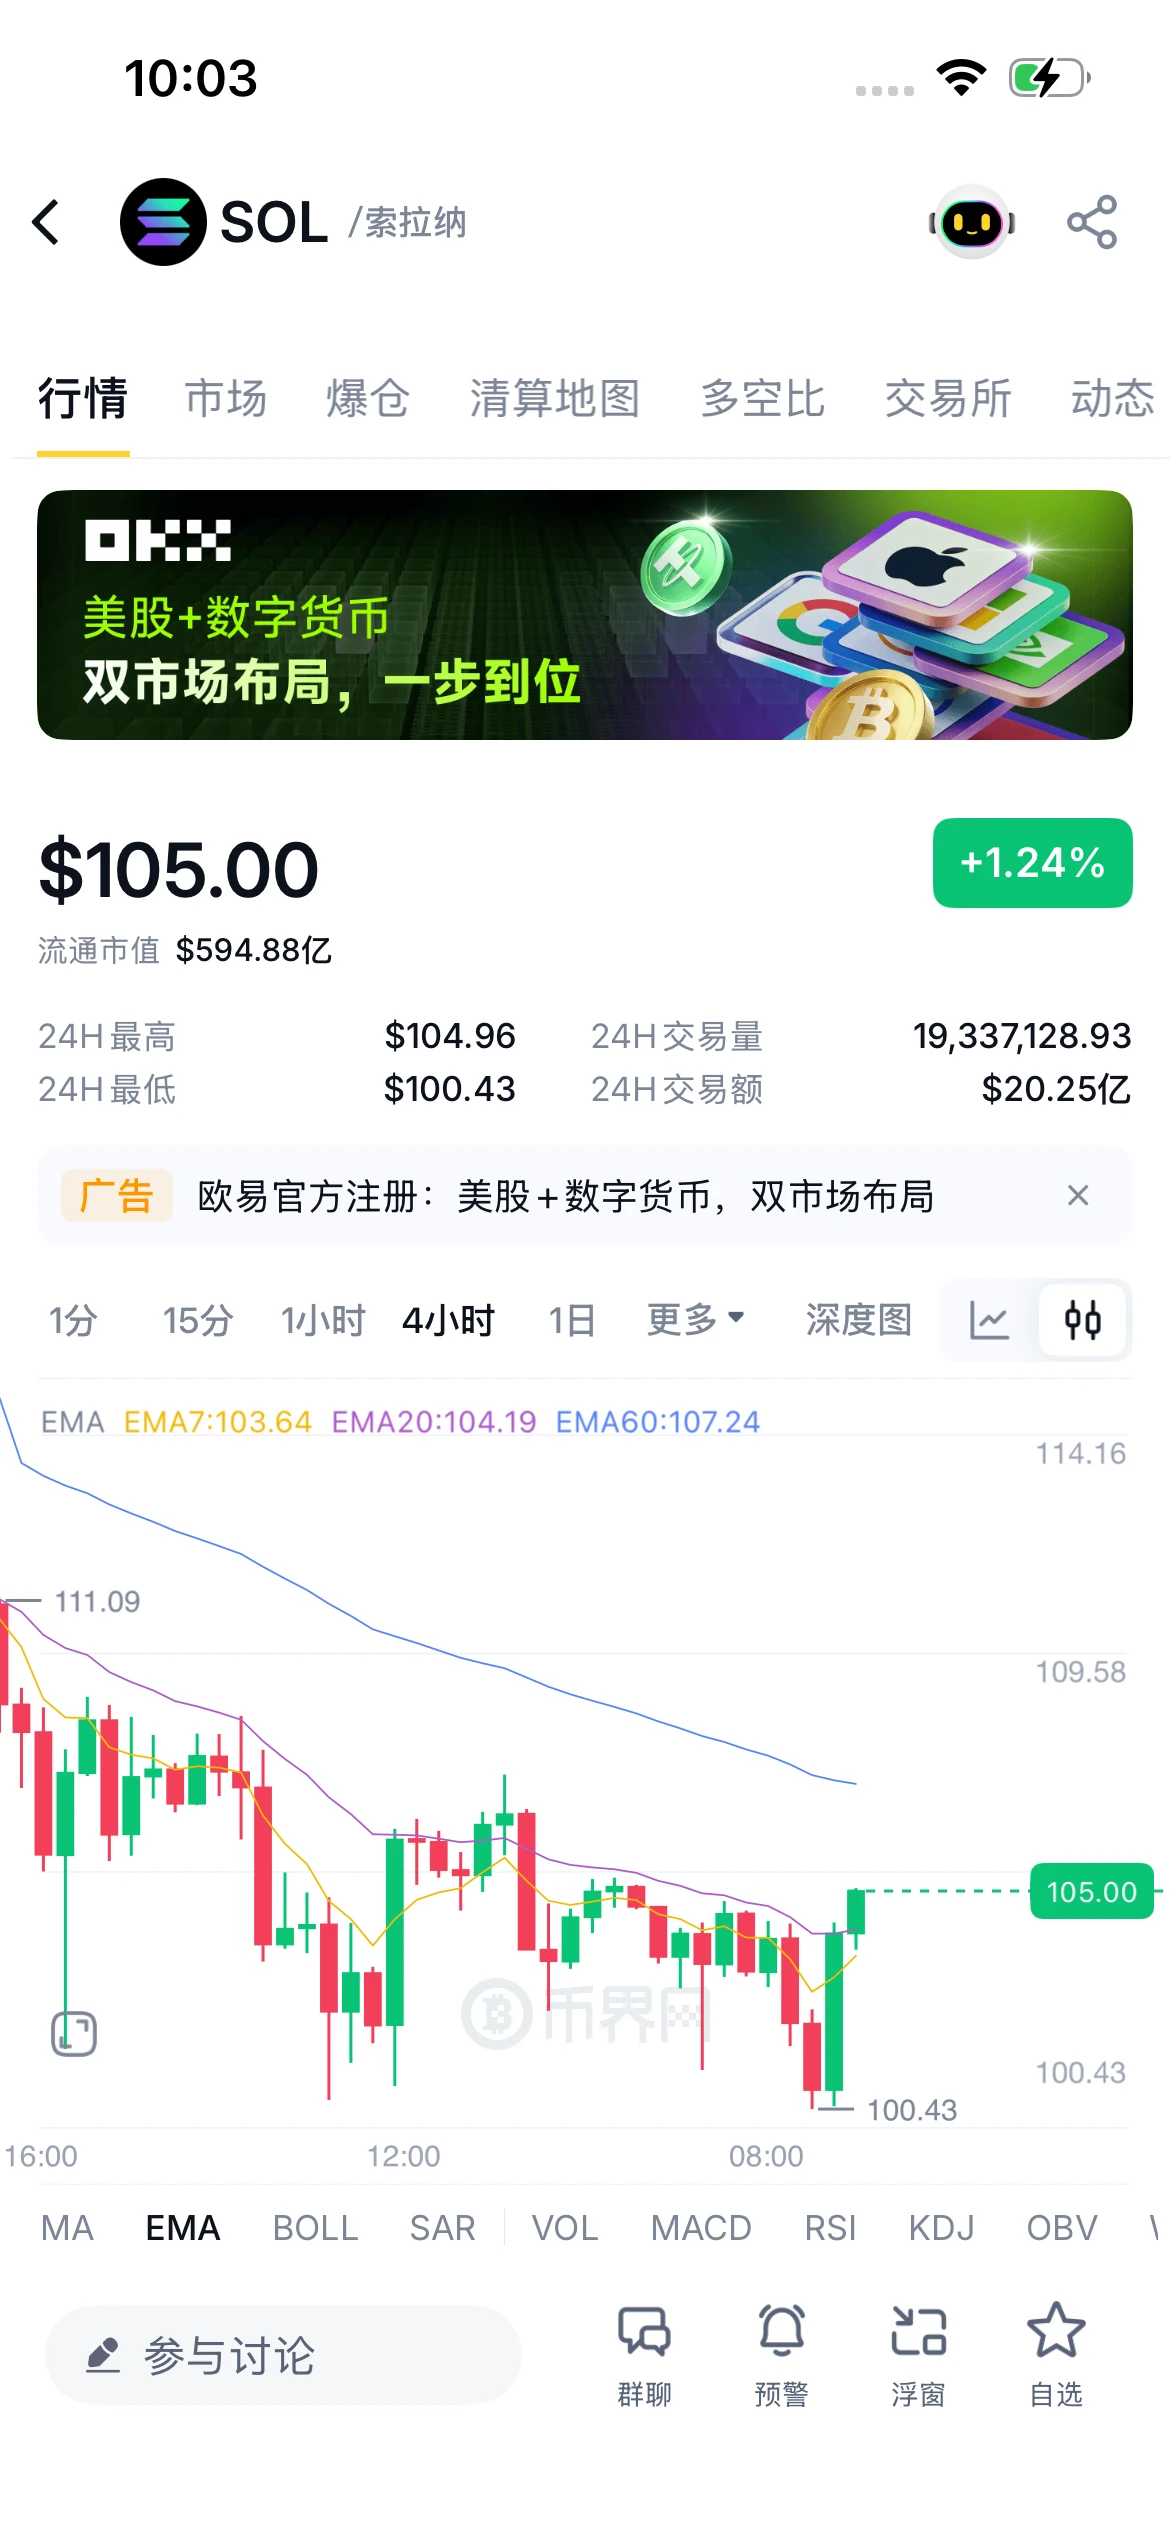
My SOL short at 117.23 is deeply in profit at the current price of 105.00; 107.24 will determine direction.
Market: On the 4H chart, SOL pulled back from 117.23, bounced after bottoming at 100.43, and is now at 105.00 (up 1.24% in 24h). It has moved above EMA7 (103.64), with EMA20 (104.19) close by and EMA60 (107.24) trending down. This is a weak rebound after the drop from 111 to 100; the bearish bias remains until price gets above EMA60.
P&L calculation: 117.23 - 105.00 = a 12.23-point price difference, with unrealized profit continuing to grow.
Key levels: Support at 100.43/10
post-image
SOL+1.02%
10/19 Gold:
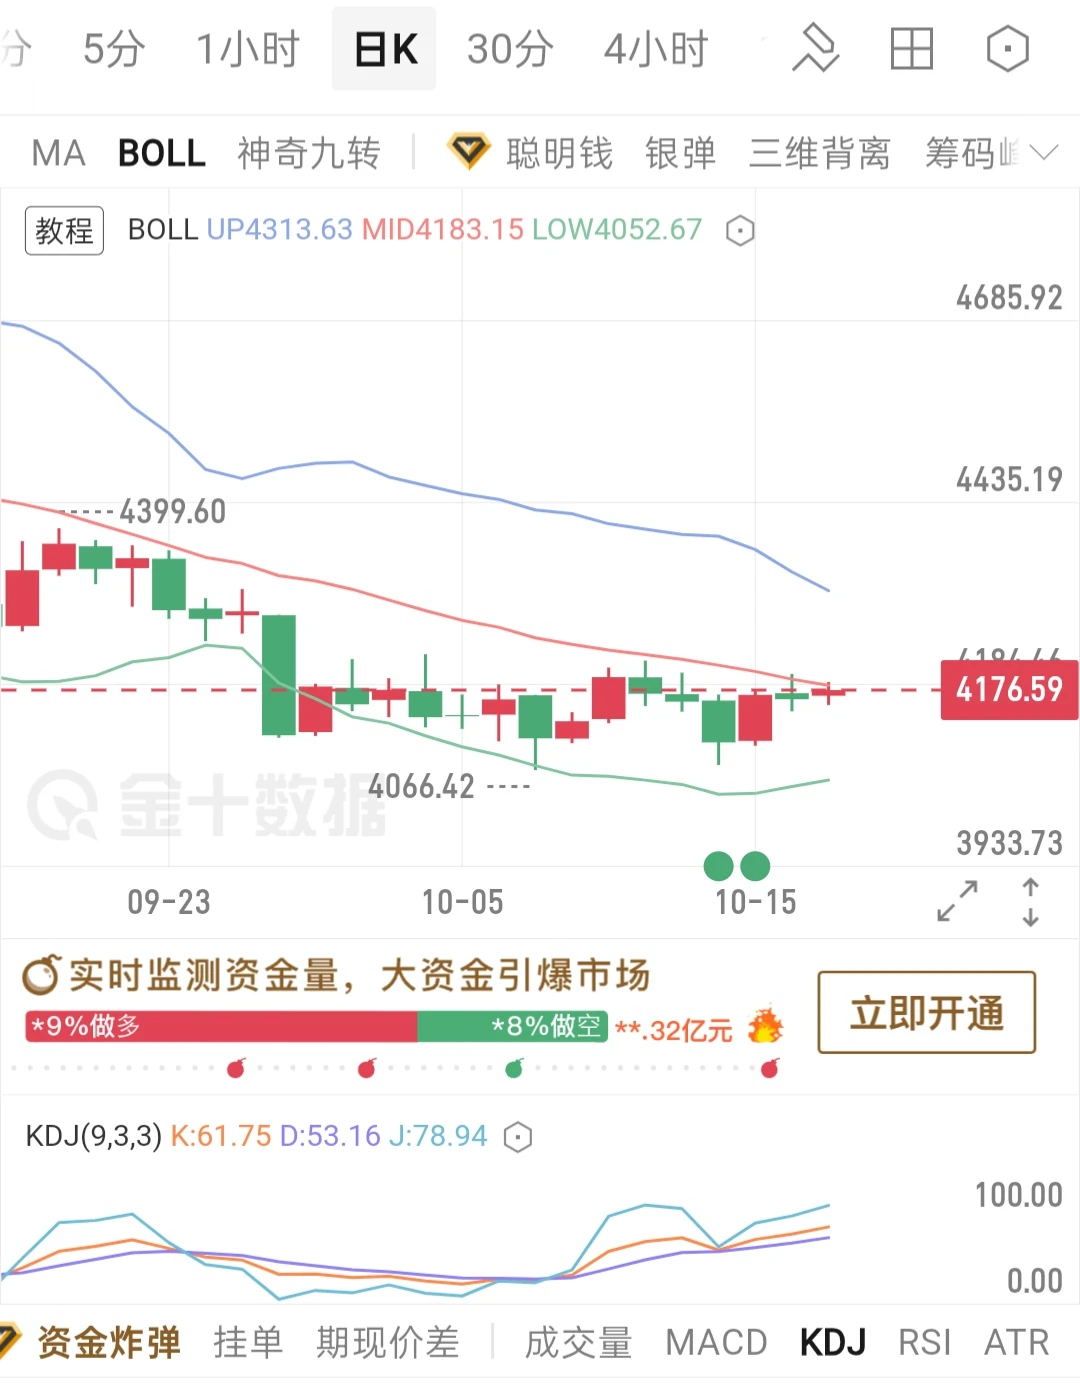
On the daily chart, the current price is trading just below the Bollinger middle band. After the previous decline, a bottom has formed at the lows, and the candlesticks have gradually moved higher, creating a rebound structure from the bottom. However, the price has yet to rise above the Bollinger middle band, which is the first short-term resistance.

KDJ indicator: K=61.75, D=53.16, J=78.94. The three lines are diverging upward and are in bullish territory. The J value is approaching 80, showing slight short-term overbought signs and the possibility of a pullback for consolidati
post-image
GLDX+0.07%
PAXG+0.27%
XAU+0.30%
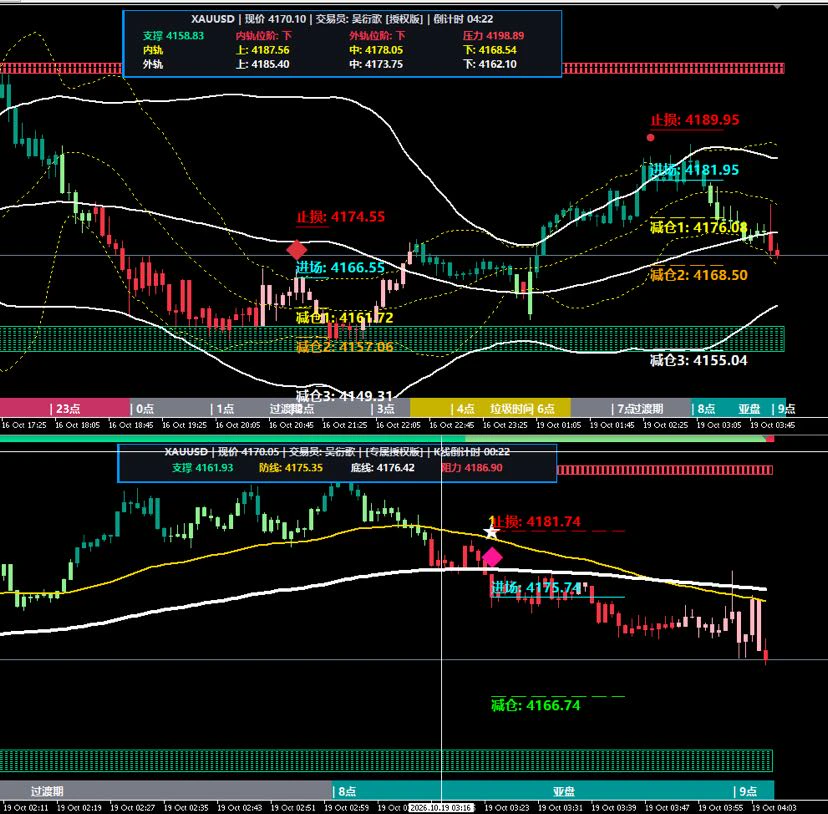
One signal from each this morning: an 81.95 short and a 75.74 short. The first is the new quant running for 5 minutes; the one below is the old one. I’ll test it live for a week before launching.#美国9月PPI大超预期
post-image
🔹A Huge Earnings Week Is Here! Jensen Huang Takes the Stage at GTC as Meta and Tesla Report Earning
live-cover
LIVE2,057
📊 US$170 billion in debt under scrutiny: what it means for the dollar, P2P, and your USDT
Economist Leonardo Vera is calling for a forensic audit before Venezuela renegotiates its external debt. The figure under consideration is no small matter: around US$170 billion. And the fine print of that process matters more than it might seem to anyone who exchanges dollars for bolívars every day.
The problem isn’t just the amount, but the lack of organization: every time the rug is lifted, a new creditor appears. The inventory is spread across sovereign debt, bonds, oil company obligations, bilateral
post-image
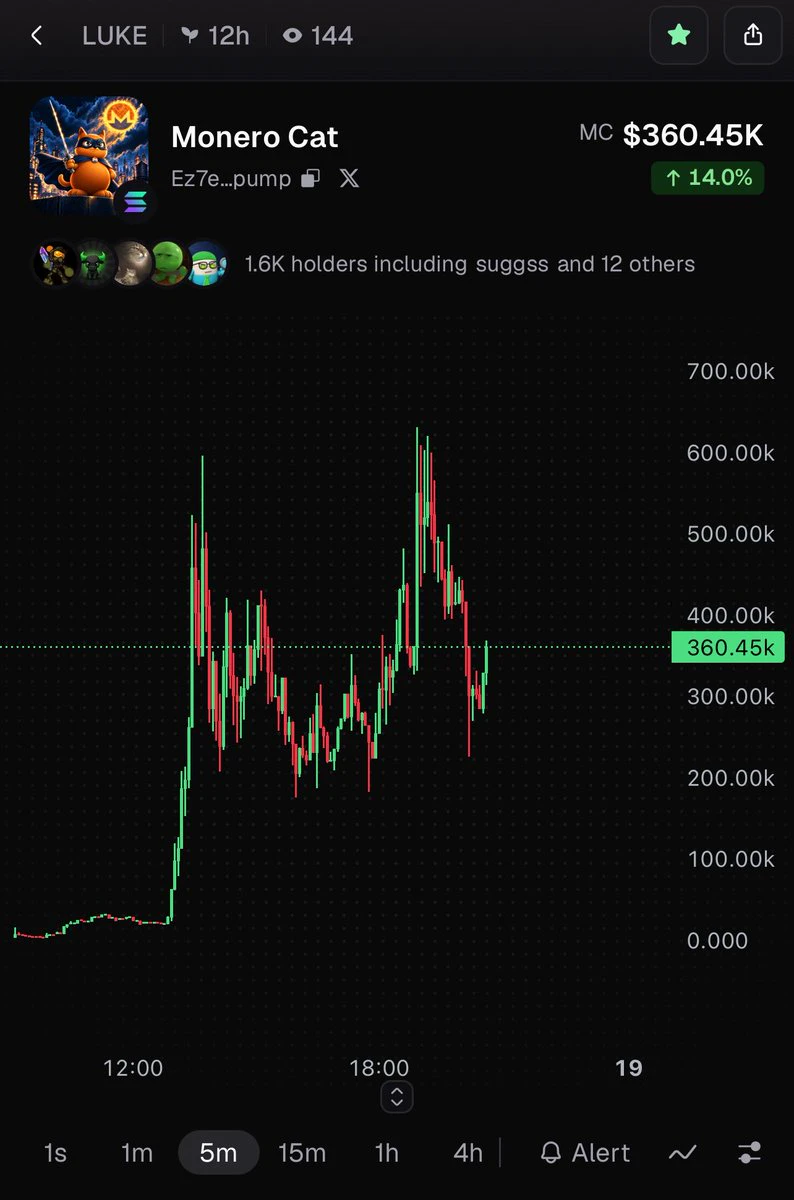
solana:Ez7eEs53hQiXgCGmcbhdX5i1jgg2gC3F6MoeosuVpump
Ez7eEs53hQiXgCGmcbhdX5i1jgg2gC3F6MoeosuVpump
#crypto $sol
post-image
SOL+1.05%
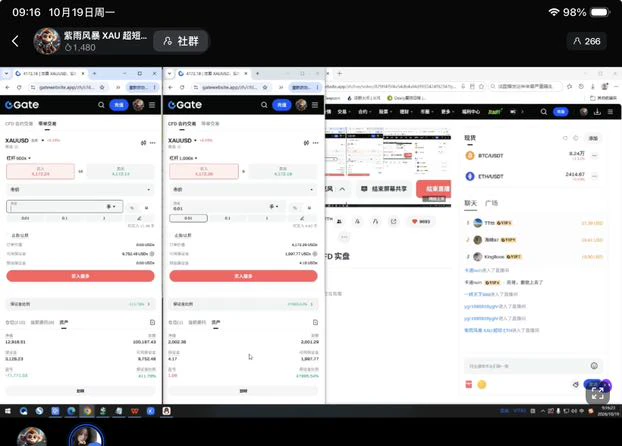
Bring it on🤟🤟
Long-term positions must be fully sized🤏🤏
The small account is up and running, earning ongoing profit sharing
👇👇👇👇👇👇
post-image
#CryptoMarketTurnsGreedy #ShareWeekly
CRYPTO SENTIMENT IS SHIFTING TOWARD GREED: CAN BULLISH MOMENTUM SURVIVE THE NEXT MARKET TEST?
The cryptocurrency market is entering a potentially important phase as investor confidence improves and risk appetite begins to return. When sentiment shifts toward greed, traders often become more optimistic about Bitcoin, Ethereum, and alternative cryptocurrencies. This change can support stronger buying activity, rising trading volumes, and renewed interest in digital assets.
However, rising optimism does not automatically mean that another major rally is guar
BTC+0.77%
ETH+0.21%
  • 3
  • 3
U Jie 10.19 Monday ETH $ETH Trading Plan
Entry: If price rebounds into the 2440‑2480 range and the 1-hour candle forms a long upper wick, with declining volume on the rise, enter a short after signs of stalling emerge.
Stop-loss: If price holds firmly above 2510, breaking through resistance, exit the short and abandon the setup.
First take-profit target: 2430
Second take-profit target: 2405
Market logic: After the previous sharp drop set a low of 2313.39, the current move is a corrective rebound within a downtrend, not a trend reversal. 2501 is a key resistance level from earlier, while 2465-
post-image
ETH+0.20%
#加密市场情绪转向贪婪 Bitcoin’s October stagnation was mainly caused by a depletion of corporate and ETF buying
I. Analysis of the two main headwinds
1. A significant decline in corporate buying power
Publicly listed companies have lost their appetite for accumulating coins, and large-scale purchases on the open market have nearly stalled, weakening a previously stable source of institutional support.
2. ETF funds are seeing net outflows
Major spot ETFs are facing investor redemptions, with funds continuing to flow out and directly draining a key source of liquidity driving prices higher.
II. Current ma
BTC-0.96%
  • 1
Load More

Join 40 M users in our growing community

⚡️ Join 40 M users in the crypto craze discussion

💬 Engage with your favorite top creators

👍 See what interests you

Trending Topics

USSeptemberPPIBeatsExpectations

91.35k Views1.94k Discussing

US September PPI came in at 6.3% YoY, well above the 5.3% market expectation, pointing to renewed producer-side inflation pressure. Weekly jobless claims were 199K, broadly in line with forecasts. Could hotter inflation further reduce room for rate cuts, and what does it mean for $BTC, US stocks, and gold?

GateWCTCS9GlobalTradingCompetition

37.87k Views6.86k Discussing

GateBTCAndETHFuturesVolumeRanksTop3

53.8k Views1.98k Discussing
View More