Square
Following
Hot
News
Profile
Share your thoughts
placeholder
Article
#ZECPlungesOver14%in24Hours
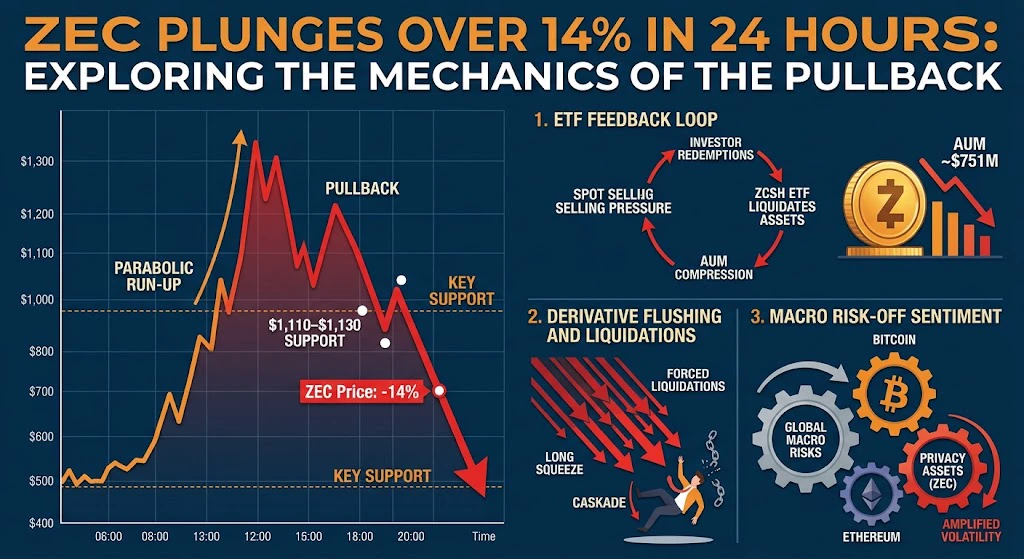
This pullback in ZEC looks like a textbook example of a high-beta asset experiencing a healthy, albeit sharp, de-leveraging phase after a parabolic run-up.
A breakdown of the underlying mechanics driving this movement reveals several key factors:
1. The ETF Feedback Loop (Inflows to Outflows)
When Grayscale’s ZCSH spot ETF launched, it acted as a major structural tailwind, absorbing a significant percentage of the circulating supply and pushing prices higher as capital rushed in. However, spot ETFs are a double-edged sword:
* The Mechanics: When investors redeem sh
post-image
ZCSH
ZCSHZCSH
Pump.Fun
MC:$4.36KHolders:1
0.18%
ZEC-0.58%
  • 6
  • 1
$RAY bullish alignment remains intact; I only have one bottom line on the -2.3% pullback
$RAY is currently at 2.3483, with a 24h pullback of -2.3%. My judgment remains unchanged: buy the dip, with a bullish outlook.

The daily RSI is strong at 65.0, and MA7 remains above MA30 with the bullish alignment intact; the MACD golden cross above the zero line has only formed for 2 days, and the red histogram has flattened but has not turned green. It has already gained 62.02% over 30d, and the current price is sitting at the 30-day range level of 0.837. This is a pullback in profit-taking, not a tren
RAY-7.81%
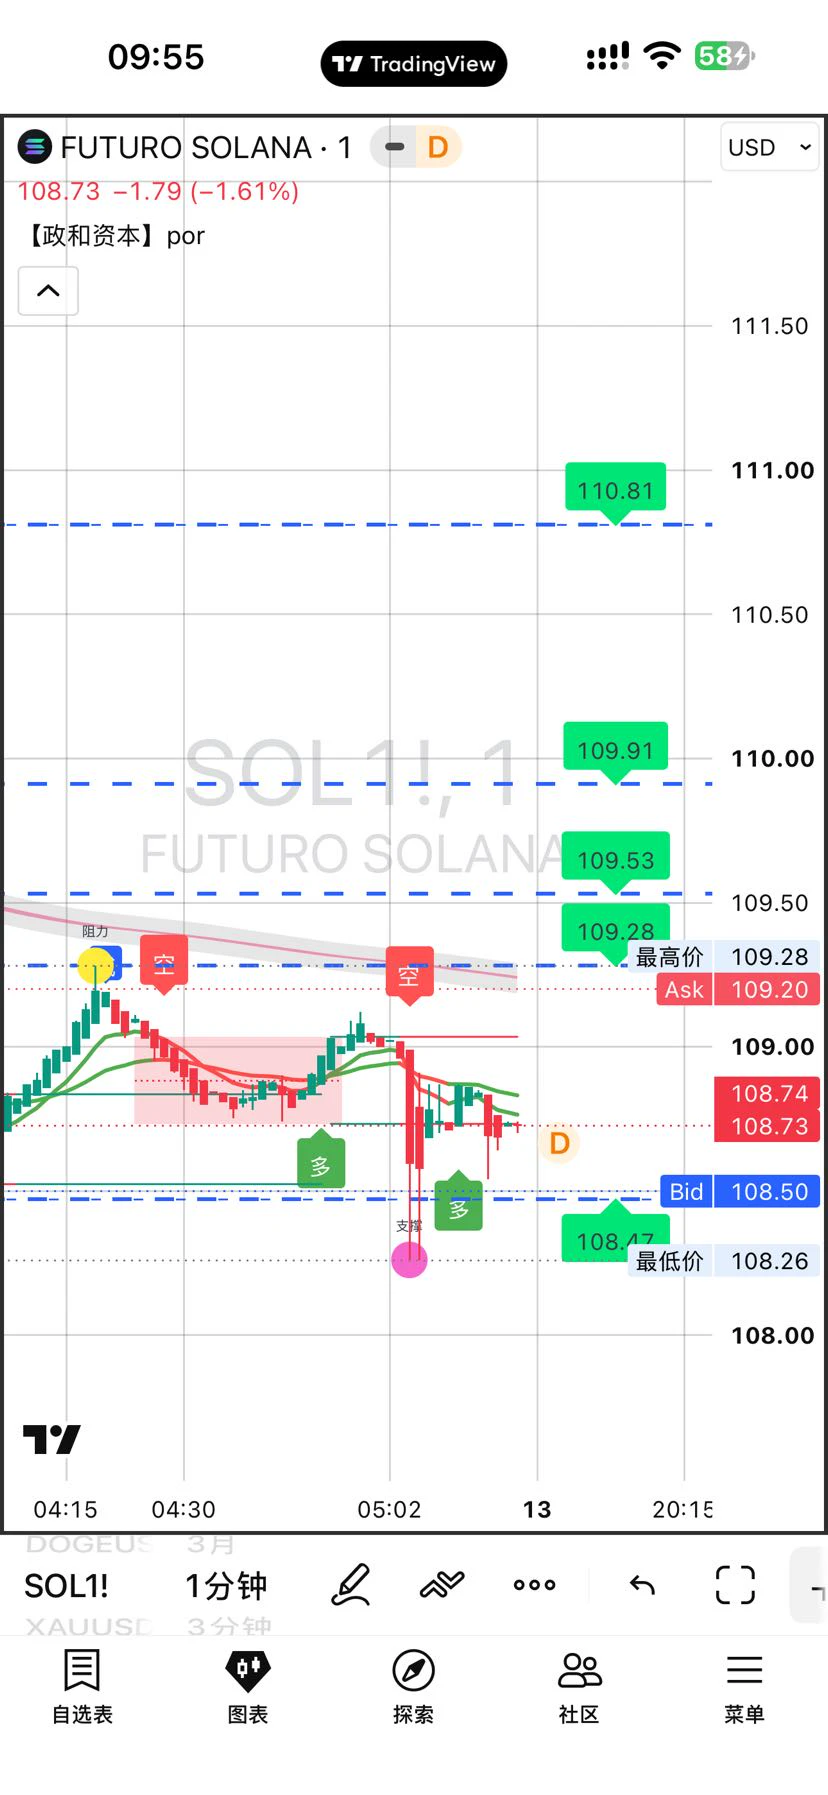
October 10, 2026 (Saturday) SOL Futures Analysis Reference
SOL is currently trading roughly in the $109–$110 range (recent high around $112, low around $105–$108). Weekend liquidity is low; after a clear pullback from the early-October high of around $122–$123, it has entered range-bound consolidation.
Brief Market Background
• After surging to around $123 on October 2, SOL continued to retreat, broke below $115 this week, and is currently ranging between $108–$112.
• Technical outlook: Short-term weakness and consolidation, with strong correlation to BTC; watch support levels.
• Key levels
post-image
SOL-0.23%
Crypyo Market update
live-cover
LIVE199
$UNITREE At first, the timing was off—I got caught by wicks and lured into longs. Later, I figured out the pattern and recovered everything. Another lesson is not to trade short-term too frequently: the more short-term trades, the more mistakes. I would have made more by simply holding the short.
UNITREE+2.63%
new market update
live-cover
LIVE298
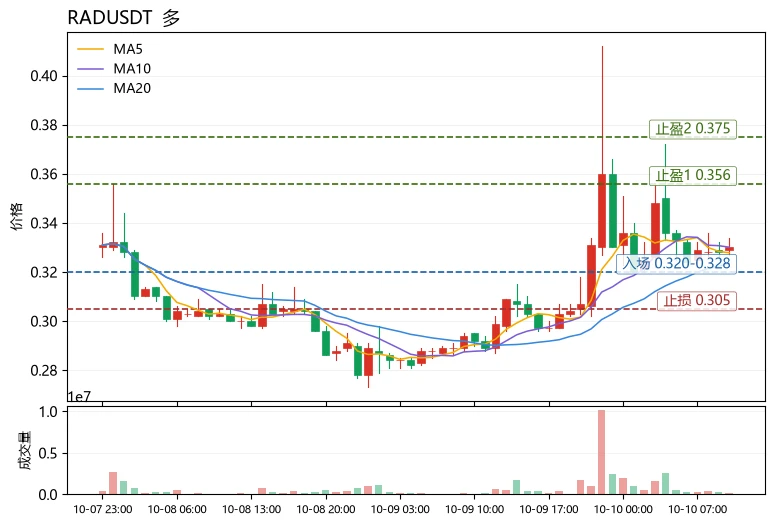
$RAD Conclusion first: Short-term bias is bullish, but this is a catch-up trade driven by greed, so do not chase highs; focus on buying dips.
The Fear & Greed Index stands at 64, in the greed zone, indicating that risk appetite for the broader market remains strong, but this is no longer an environment for blindly going long at lows. BTC’s recent impact on altcoins has been more of a “liquidity-draining rotation”—capital is rapidly rotating among a few strong sectors. RAD is up 13.79% over 24h, with a trading volume of 10.1M USDT, making it a typical beneficiary of sector rotation. However, th
post-image
PIXEL+39.65%
#SimpleEarnUSDTLimitedTime11%APRWriting
#余币宝USDT享11%年化
Gate Idle Funds Treasure × Coin Treasure Phase 2: Put Your Idle USDT to Work With Annualized Returns of Up to 11%
In a market where cryptocurrency prices can change rapidly, successful fund management is about more than identifying the next trading opportunity. It is also about knowing how to manage the capital you are not currently using.
Many crypto investors keep USDT available to buy Bitcoin during market corrections, enter promising altcoin positions, or respond to sudden market movements. However, when those funds remain unused for a
post-image
BTC+0.54%
  • 4
An Analysis of BTC’s Short-Term Trend from the Perspectives of Dow Theory, Chan Theory, Elliott Wave Theory, Volume-Price Relationships, Order Flow, and Price Action
Key evidence: Yesterday’s forecast of C-5 (79,500-78,500) has not yet materialized—the October 9 low was only 81,549 (a higher low than 80,316), followed by a rebound reclaiming 82,700. However, Delta on the rebound day was only +37 million (10.2 billion in volume but almost zero net buying)—a typical short-covering weak rebound rather than a bullish counterattack. The real test lies above: 83,650-84,350 is occupied by an 8-level
BTC+0.54%
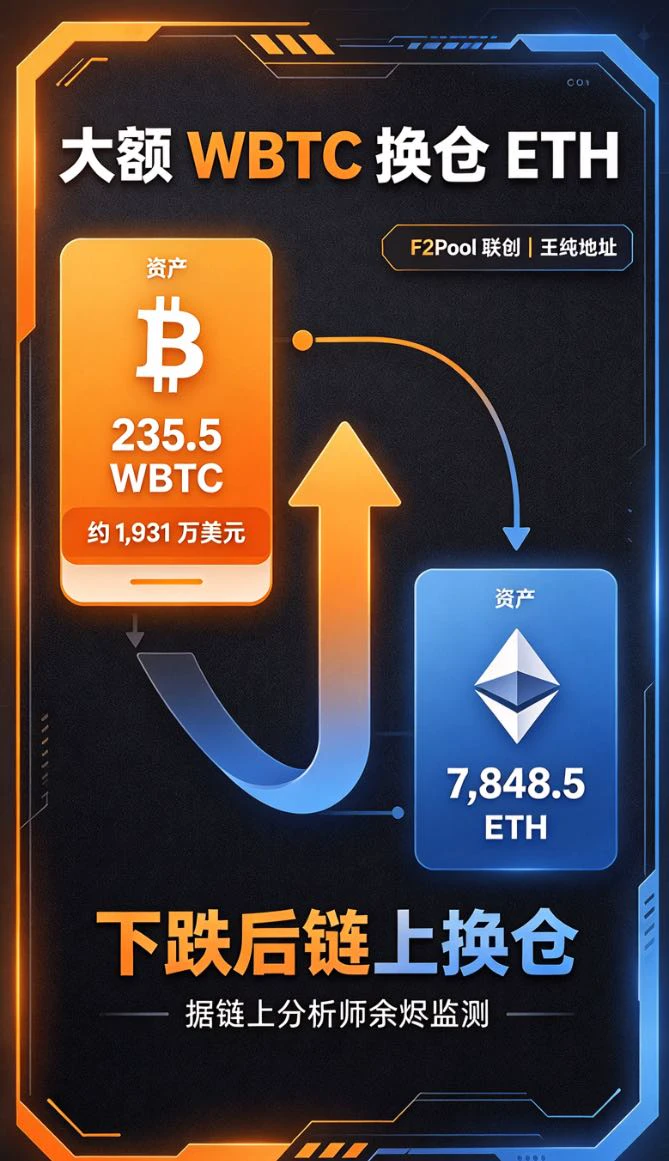
On-chain analyst Ember reported that after the overnight drop, the address of F2Pool co-founder Wang Chun sold 235.5 WBTC ($19.31 million) on-chain in exchange for 7,848.5 ETH.
post-image
WBTC+0.41%
ETH+0.23%
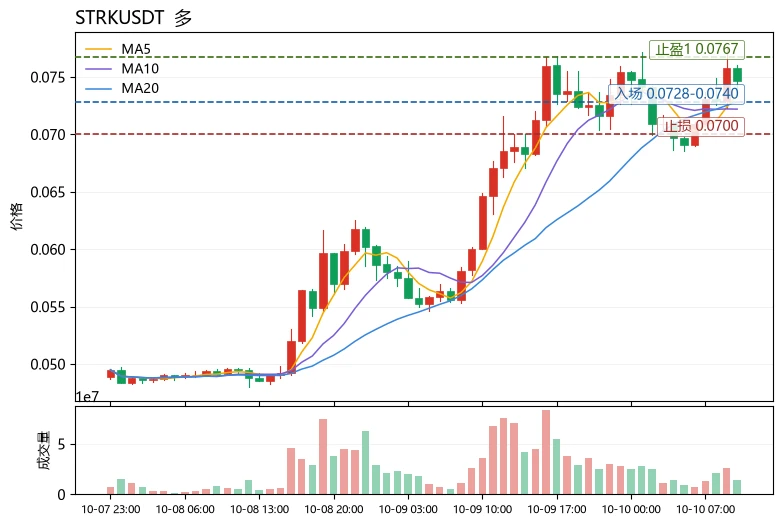
$STRK Current price is 0.07462, with resistance at the upper Bollinger Band at 0.07671 and support at MA20 at 0.07284. It has surged 20.06% over 24h, with a trading volume of 59.4M USDT, making it the highest-volume and most solidly rising among the three candidate tokens.
A side-by-side comparison shows relative strength: although $GM has risen 16.81%, its trading volume is only 6.2M, while the funding rate of -0.0186% indicates that shorts are still resisting; $ORCA has fallen 5.06% against the trend, with MA5 already breaking below MA20, showing clear weakness. $STRK 's 59.4M trading volu
post-image
ORCA-8.06%
A 9-year whale cashes out at 250x! F2Pool big shot aggressively buys $32 million, $ETH the long-short showdown is about to begin!
Others are fearful while I am greedy, but with the whale's scythe and the big shot's bullets flying together, which side are you on?
A 9-year-dormant whale transferred 2,903 ETH to Coinbase, sounding the alarm on selling pressure! But F2Pool co-founder Wang Chun continued adding to his position, withdrawing over $32 million in total. Whale distribution and institutional accumulation are colliding fiercely! On the ETH 1-hour chart, price bottomed at 2405 and recover
ETH+0.27%
  • 5
  • 1
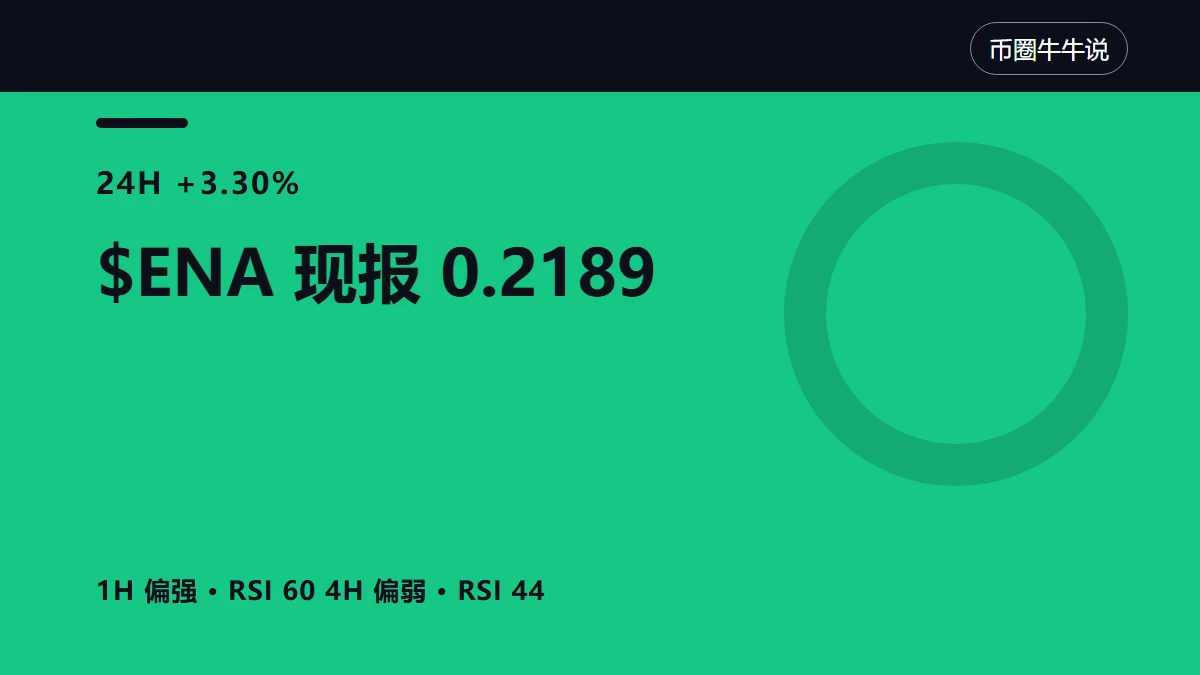
$ENA Short-Term Shift: Why Has the 4-Hour Chart Still Not Capitulated?
$ENA 24-hour +3.30%, current price 0.2189. On the surface, this is merely a rise and fall, but the real conflict lies in the timeframes: the 1-hour chart is relatively strong, while the 4-hour chart is relatively weak. When two charts give opposing answers, the least useful approach is to pick the one you prefer and believe it completely.
Let’s return to the 24-hour range: low 0.2104, high 0.2212. Where the current price of 0.2189 sits within this range directly affects the meaning of the same signal. Near the high, strengt
post-image
ENA+3.52%
What Does Bitcoin's Real Earnings Data Reveal?
When Bitcoin's realized profit data tells a different story from the panic on the market, it's worth taking a closer look.
BTC recently dropped to $80,500, sparking speculation that holders were capitulating and selling at a loss. But Santiment's analysis points to something entirely different: the entire network realized billions more in profits than losses.
⚠️ Personal market analysis only. NFA — manage risk and DYOR.
Educational content, not investment advice or a recommendation to buy, sell, deposit, or withdraw any asset. No paid promotion or
post-image
BTC+0.54%
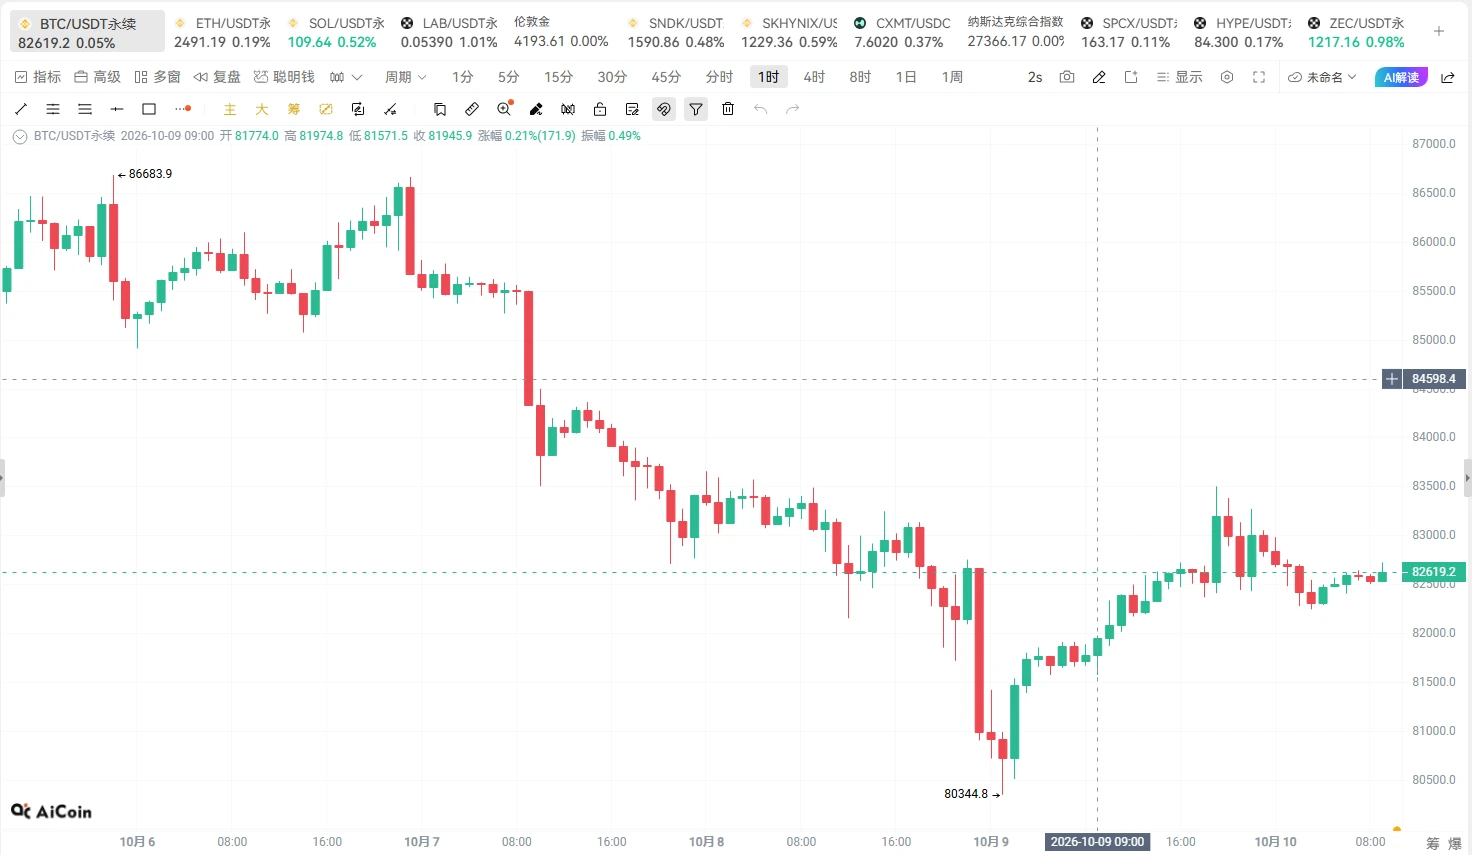
Starlink|BTC|October 10 Today’s Outlook
Direction: Remain bullish; look for a recovery over the weekend
Entry: Buy on a pullback near 82000–82500
Target: First look at 83000–83500; if it breaks through and holds, then look at 84000–84500.
Defense: If it falls below 80300, reassess the bullish structure.
BTC has stopped falling and rebounded near 80344, with the high already reaching around 83500. The current price is fluctuating around 82500.
BTC has indeed been under fairly obvious pressure recently, but overall, it has begun a slow recovery. After a short-term drop of two or three thousand p
post-image
BTC+0.55%
ETH+0.27%
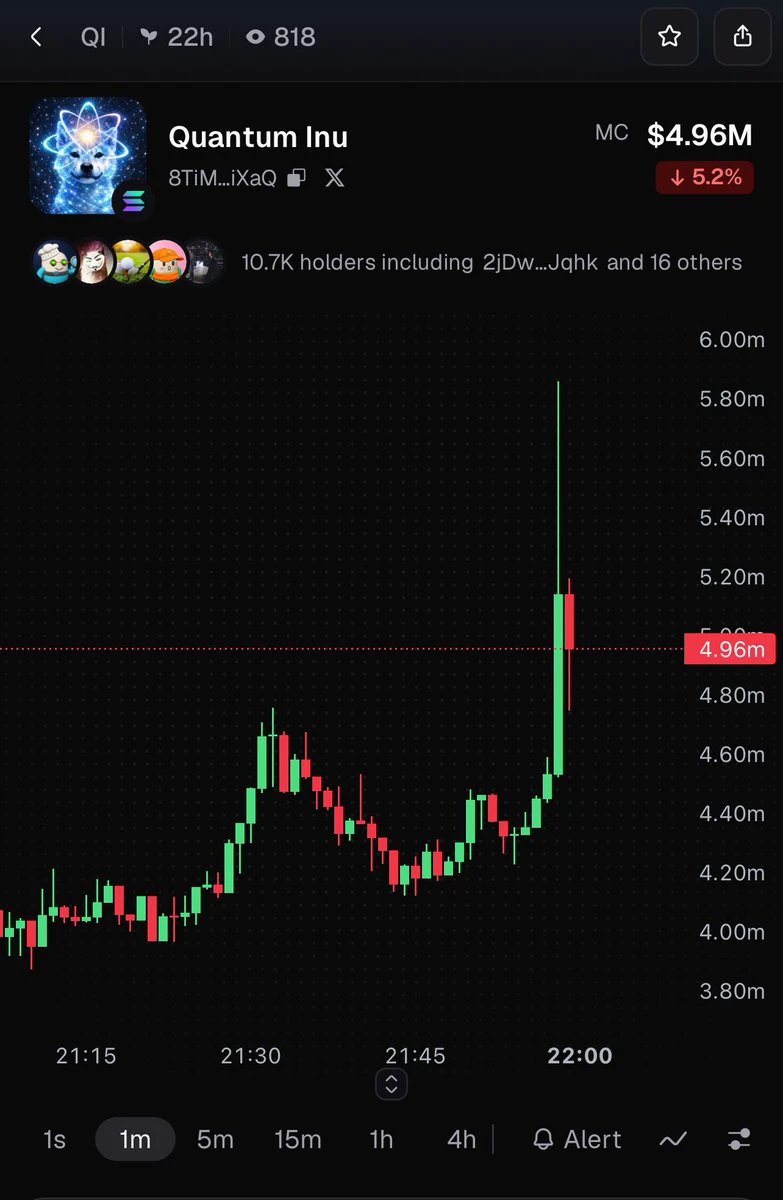
solana:8TiMkgvsrat9tM2esko8zVTt99LZLpefUM4SnZaziXaQ $5.8 million wow 😮
8TiMkgvsrat9tM2esko8zVTt99LZLpefUM4SnZaziXaQ
#crypto $sol
post-image
SOL-0.23%
🌅 **Good Morning & Happy Saturday, Crypto Family!** ☕📈
Wishing everyone a peaceful, productive, and successful Saturday! 💚✨ A new day brings new opportunities to learn, grow, and make smarter decisions in the crypto market. Let’s start this weekend with a positive mindset, patience, and a clear trading plan.
🌍 **📊 Crypto Market Update — Saturday, October 10, 2026**
The cryptocurrency market continues to offer opportunities for traders and long-term investors, but weekend trading requires extra attention. With traditional financial markets largely closed, crypto prices can still move sharp
post-image
BTC+0.54%
ETH+0.23%
Bad Boy Watch: RKLB 10.10
Little Rocket closed at $68.21 in U.S. trading, down 0.28%, with an intraday high of $69.25 and a low of $66.98.
After several consecutive days of declines, Little Rocket finally showed some relief, with the candlestick chart also forming a doji.
Looking at the intraday chart, although it opened high and fell, it quickly bottomed out and encountered strong resistance around $67. Late in the session, it even rose to around $69 before closing slightly lower.
Next, we will see whether it can stop falling and rebound next week. In any case, before there is clear news abou
RKLB-1.17%
#GateWCTCS9GlobalTradingCompetition 🚀 Gate.io WCTC S9 Global Trading Competition – Registration is LIVE!
Cross every market boundary. Climb to the absolute peak of trading.
A massive 6,000,000 USDT prize pool is waiting for the world’s best traders.
This is not just another contest — this is WCTC S9, Gate’s biggest global trading showdown.
Three Epic Tracks Launching Together
🏆 Team Competition – Build your squad and dominate as one
🥇 Individual Competition – Prove you are the strongest solo trader
⚔️ Event Contract PK – Head-to-head contract battles for glory
Trade Almost Everything
Spot •
  • 3
Load More

Join 40 M users in our growing community

⚡️ Join 40 M users in the crypto craze discussion

💬 Engage with your favorite top creators

👍 See what interests you

Trending Topics

GateAtTOKEN2049

38.2k Views21.25k Discussing

Gate brought a series of major events to TOKEN2049 Singapore! From the official launch of Gate Money to the F1 Red Bull driver meet-and-greet and the Gate Gala, we witnessed a new chapter of "One Gate, Borderless Finance." Which moment from TOKEN2049 stood out most to you?

LedgerLossesNear90Million

38.26k Views93 Discussing

GateWCTCS9GlobalTradingCompetition

33.05k Views4.45k Discussing

View More