Share your thoughts
placeholder
Article
$FIL The major breakout pattern looks very strong—professormike will help you make money..!!! Like $NEAR
, we’ll make a lot from this trade!! Entry 1.05–1.08, stop-loss 1.01, take-profit 1.12–1.16–1.20, go long $FIL 👇BitcoinMarketCapTopsTesla
post-image
FIL+21.02%
  • 1
crypto night update
live-cover
LIVE1,917
Good night 😴
Iykyk
post-image
  • 2
Staring at the charts got annoying; turning them off actually made things clearer. When my eyes stopped watching, my heart stopped panicking too.
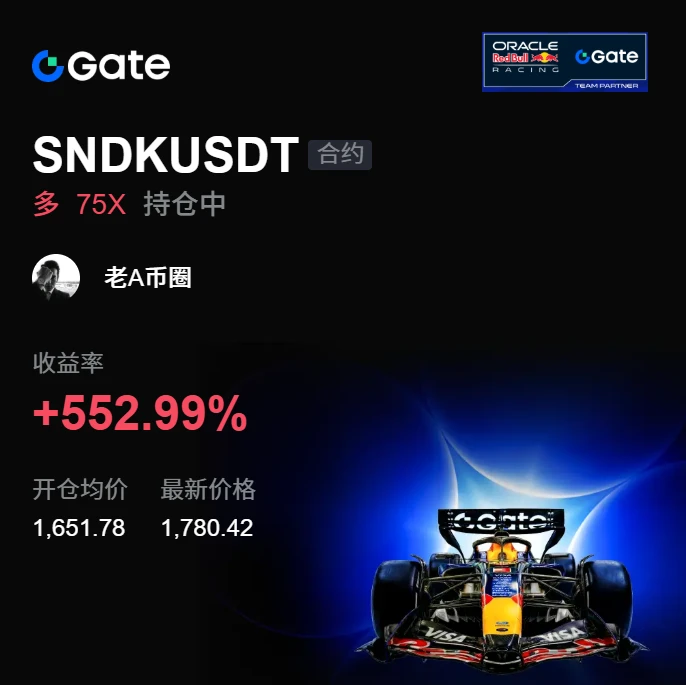
During the bottoming phase, $SNDK held its level, while funds quietly entered. I only suggested trying a small position—don’t chase.
Later, it rose from 1651.78 to 1780.38, +552.99%. I nailed this move; the waiting wasn’t in vain, and I got the rhythm right.
If you’re not confident about a token, taking a look is clear-headed, but buying a position is foolish. Staying out isn’t a sin; opening positions recklessly is the mistake.
I took 80% profit on
post-image
SNDK+2.73%
ZEC+2.18%
BNB-0.18%
Insiders are quietly loading SYMBOL while the crowd still sleeps on this setup.

$BNB /USDT - LONG

Trade Plan:
Entry: 766.9 – 769.3
SL: 756.7
TP1: 776.6
TP2: 782.3
TP3: 790.9

Why this setup?
Why now? The daily trend is already bullish, but the 1h ATR of 4.745492 signals that a decisive expansion is finally brewing. The 15m RSI sitting at 51.71 confirms the 1h price of 768.1 is resting in a neutral zone, not an overbought trap. The entry zone between 766.9 and 769.3 aligns perfectly with that 1h price, giving us a precise point to deploy capital. The first target at 776.6 and the second ta
BNB-0.18%
PEPE back in the spotlight, up 22.5% in seven days: volume only 1.21x
🔥 Old meme making a comeback—$PEPE has climbed onto CoinGecko’s trending searches, currently at 4.19e-06, up 9.1% in 24 hours. The meme sector is once again being led by familiar names, with the hype backed by real capital.

My view: bullish, but don’t chase—buy the dip at 3.94e-06 and cut losses below 3.83e-06.

Bullish rationale: first, the MACD golden cross above the zero line has expanding red bars, while RSI at 61.4 is not overbought; second, positioning is not crowded, with a 22.5% gain over seven days and a 30-day
PEPE+10.58%
Watching the market until I got annoyed, I actually saw things more clearly after turning it off; without staring at the screen, I no longer felt anxious. Anxiety comes from having no plan, and losses come from overthinking.

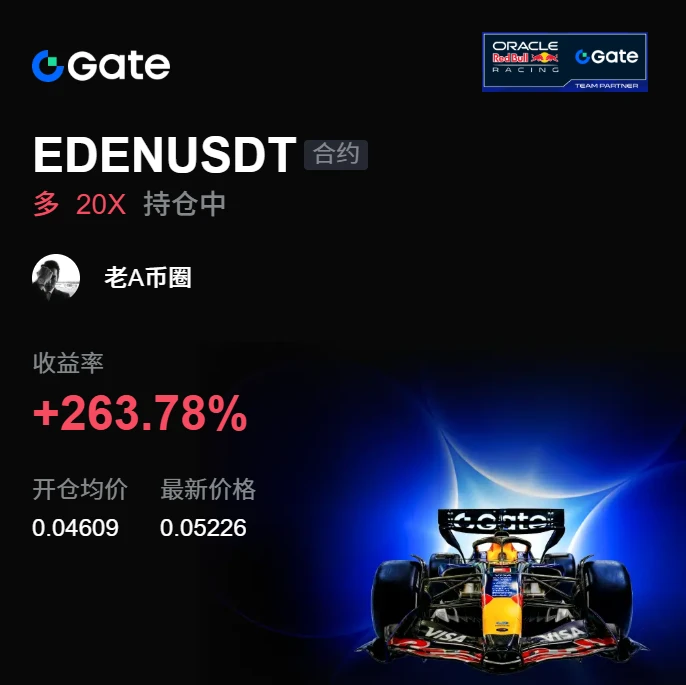
While the market was bottoming out intraday, I watched $EDEN . It held after the pullback, buying strengthened, and I judged it wasn't a bull trap, so I suggested scaling in.

It then pushed all the way to 0.05223. From 0.04609, that’s +263.78%. It feels so good—the price action was truly sluggish at first, but the result is truly satisfying.

Take profit on 80% first,
post-image
EDEN+0.15%
SNDK+2.73%
XRP+2.78%
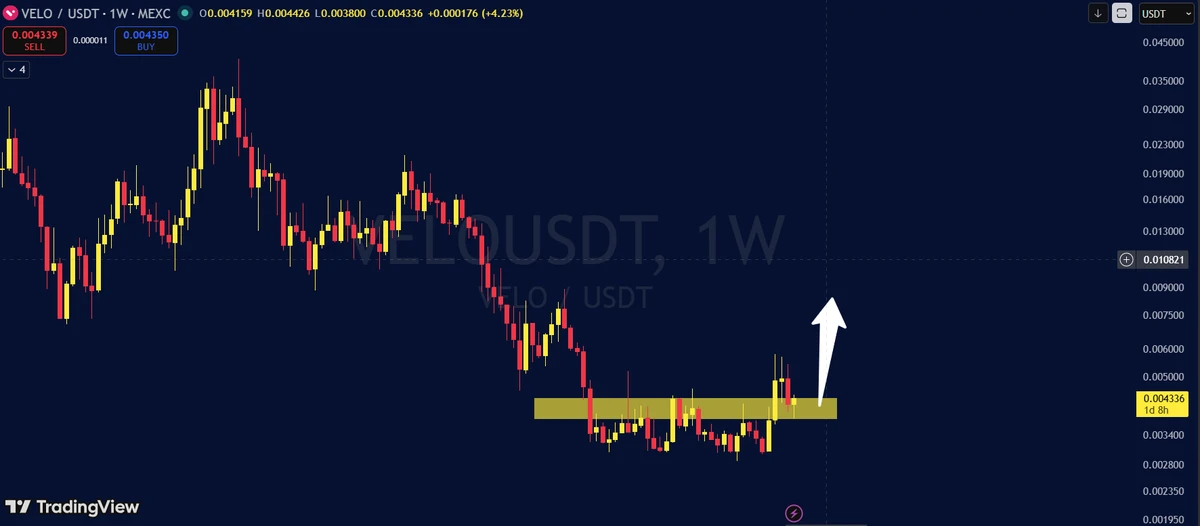
It looks like $VELO is gonna treat us with a 100%+ rally in the next few days.
So far it looks like the wyckoff accumulation is playing out super fine.
post-image
VELO+0.97%
  • 1
Insiders are calling $BR /USDT a quiet breakout nobody is watching yet.

$BR /USDT - LONG

Trade Plan:
Entry: 1.12064 – 1.15784
SL: 0.96069
TP1: 1.27315
TP2: 1.36243
TP3: 1.49635

Why this setup?
Why now? The 1D trend is bullish and the 4h bias is long, so momentum is already aligned. The 1h price sits at 1.13924, which also marks the entry reference, meaning the setup is live at this exact level. The 15m RSI at 67.61 shows room to run before overbought territory, while the 1h ATR of 0.074397 tells us volatility is expanding enough to fuel a real move. The first target sits at 1.27315, with
BR+20.86%
The established public chain $AVAX has pumped. Based on the pattern of ecosystem correlations, $JOE should pump as well. AVAX is currently undergoing a weekly-level rebound and has already broken through the daily resistance level. Under normal circumstances, JOE could be accumulated, but its trading volume is too low, so it can only be treated as a shitcoin for a gamble.
post-image
AVAX+18.09%
JOE+10.88%
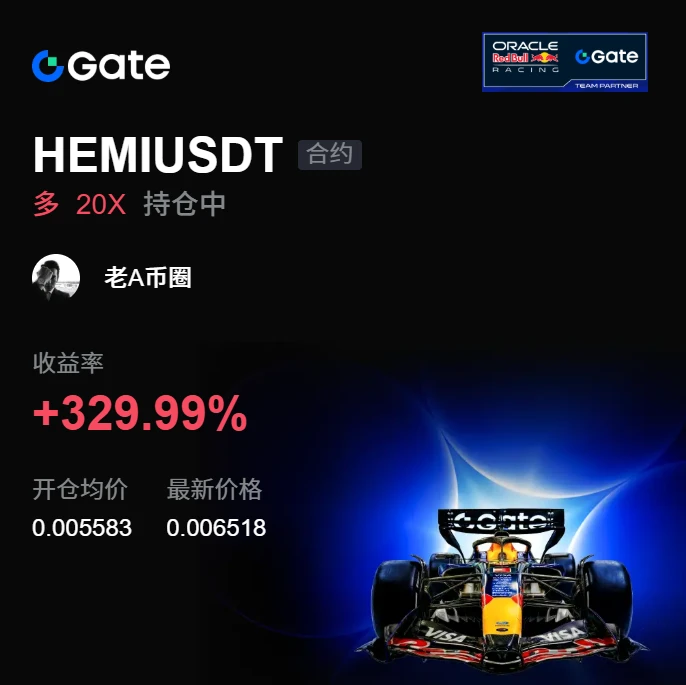
Watching the market nonstop got exhausting; turning it off actually helped me see things more clearly, and with my eyes off the screen, my heart stopped racing too. A few days ago, I glanced at $HEMI before bed. Funds were quietly entering, it was bottoming out without breaking down. I didn’t call for a charge, only suggested opening a long with a small position to test the waters and following up after it held steady. When I opened the chart in the morning, it went from 0.005583 to 0.006519, delivering +329.99% straight away. Feels good, brothers. It was really sluggish before, but the breako
post-image
HEMI-2.46%
BTC+0.50%
XRP+2.78%
#Gate广场中秋团圆局 Bitcoin’s move above $81,000 is not just a price breakout. Three different data streams are now moving together: $577M of combined spot ETF inflows, a fresh CFTC regulatory filing that adds another institutional-market catalyst, and miner selling that shows supply-side behavior remains active. The key for the next phase is whether demand can continue absorbing available supply at higher prices.
① ETF flows have turned into a major demand signal. On September 18, U.S. spot Bitcoin ETFs recorded $433M of net inflows, while Ethereum spot ETFs added another $144M, bringing the combine
post-image
BTC+0.50%
ETH+0.69%
Everyone's hunting pumps while SYMBOL quietly sets a trap below.

$ADA /USDT - SHORT

Trade Plan:
Entry: 0.2291 – 0.2307
SL: 0.2394
TP1: 0.2228
TP2: 0.2180
TP3: 0.2108

Why this setup?
Why now? Because the daily trend is stuck in a range, meaning the real move is likely to snap lower any moment. The 15m RSI at 61.6 shows the price still has bearish momentum room before it oversold, so sellers are far from done. With the 1h ATR at 0.003053, expect sharp swings that can accelerate a short once momentum kicks in. The entry zone between 0.2291 and 0.2307 aligns with the 0.2299 reference, giving
ADA+3.75%
  • 3
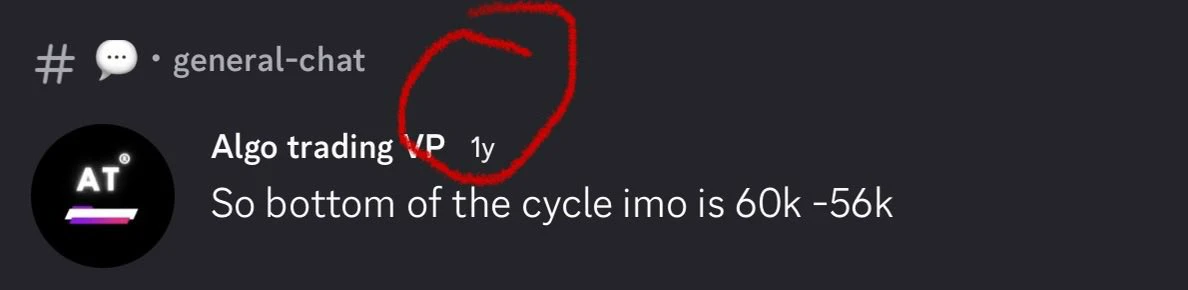
1 year back announced when price was at 123k
I can tell you 100k plus will come In a year if you ask for my macro stance
110-115k
#bitcoin
Over here don't buy and try to catch nothing.. You'll get better prices than 82k buy
post-image
BTC+0.50%
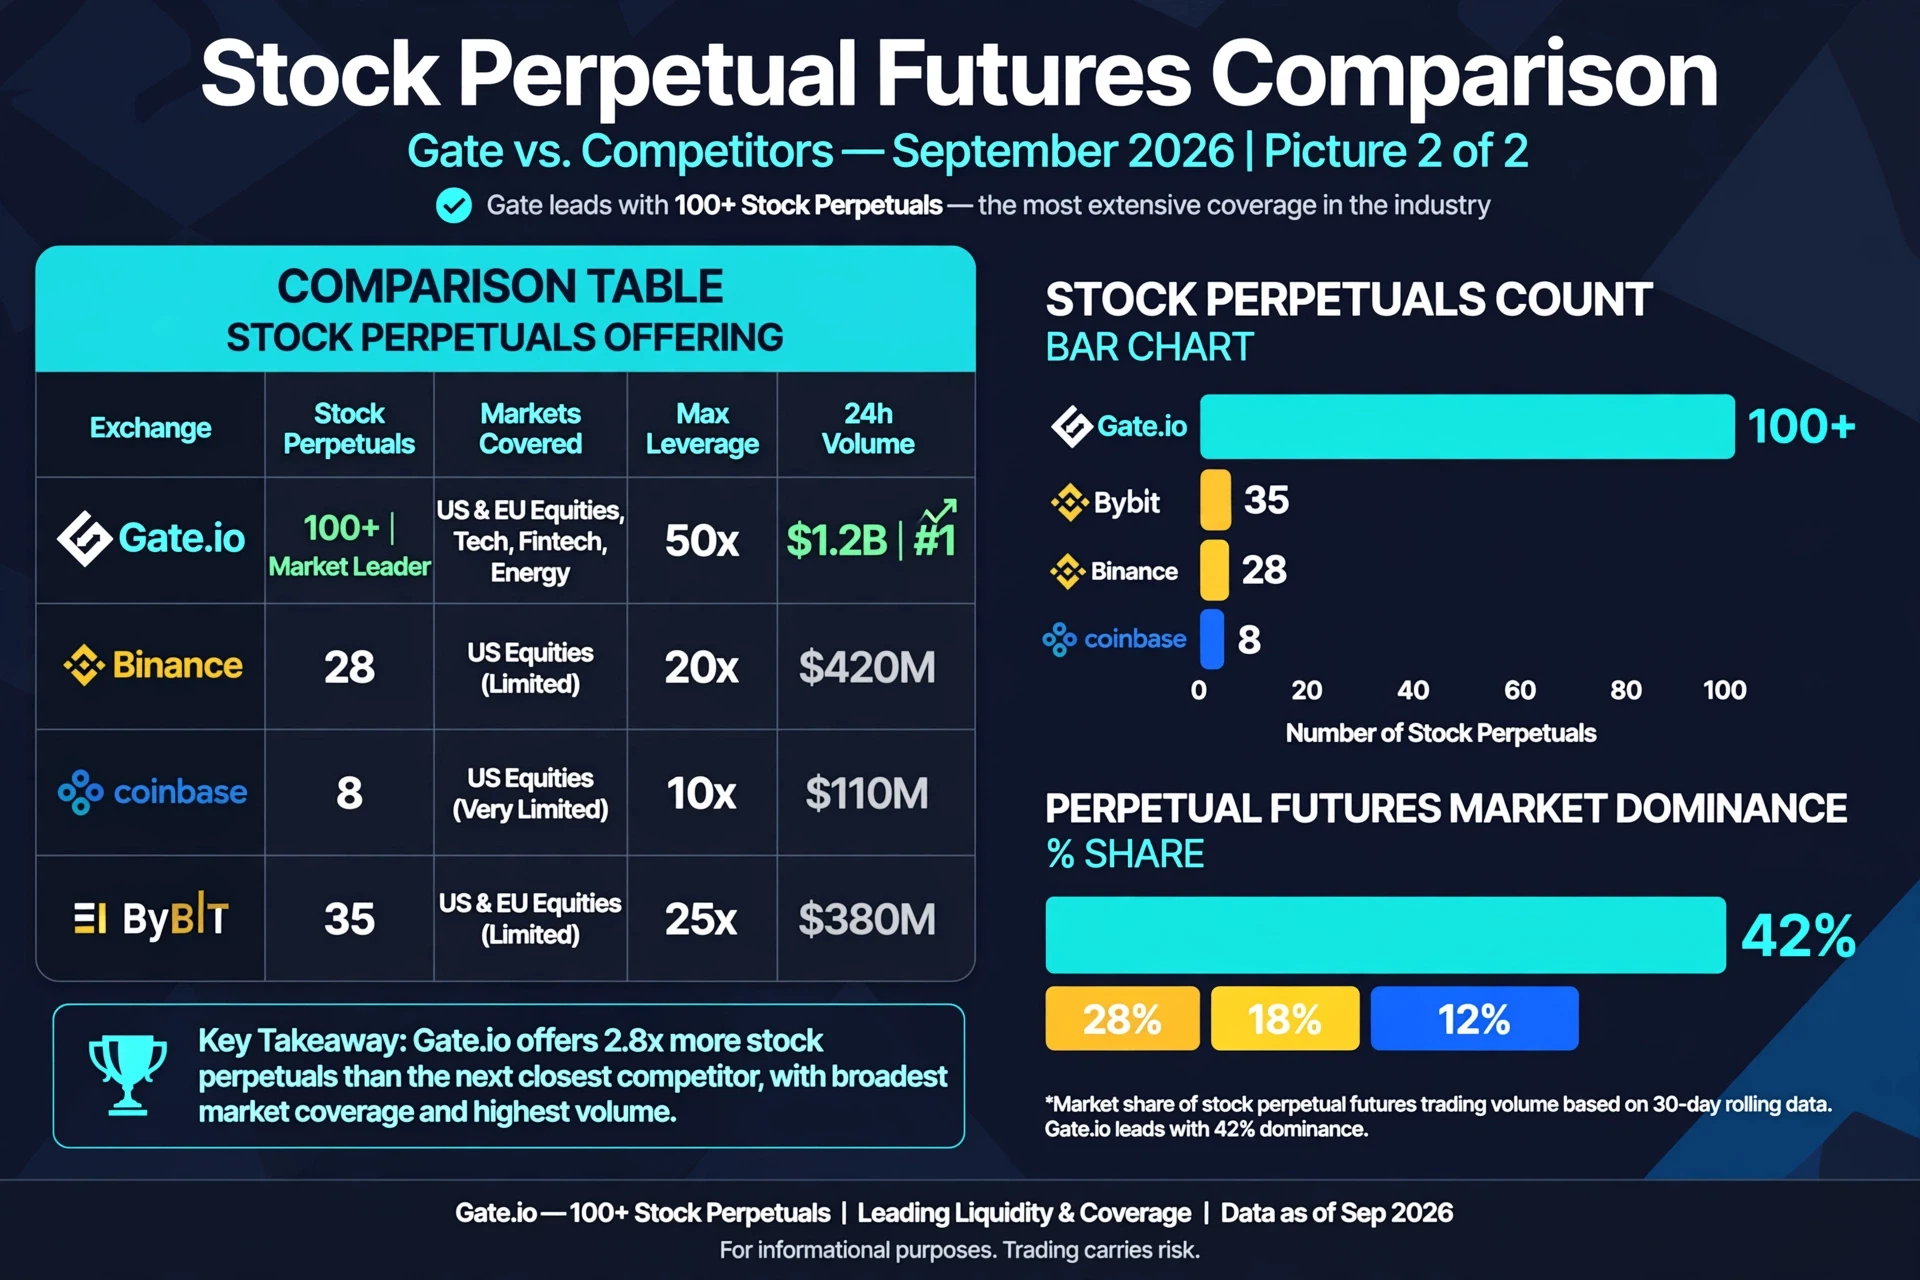
#GateTopsStockPerpetualCoverage
The expansion of stock-related perpetual trading is becoming an important development in the evolving digital asset market, giving traders another way to gain exposure to traditional market themes through crypto-based trading infrastructure.
Gate continues to expand the range of markets available to active traders, and stock perpetuals represent an interesting bridge between traditional financial markets and the flexibility of crypto derivatives.
Stock perpetual contracts can provide traders with access to price movements without requiring direct ownership of t
post-image
Insiders are calling this the breakout that rewrites the highs for SYMBOL.

$NEAR /USDT - LONG

Trade Plan:
Entry: 3.5971 – 3.6427
SL: 3.4011
TP1: 3.7840
TP2: 3.8934
TP3: 4.0575

Why this setup?
Why now? The daily trend is firmly bullish, setting the stage for a sustained move higher. The 1h ATR of 0.091158 confirms that volatility is expanding enough to fuel a real impulse, not just a weak grind. With the 15m RSI resting at 52.81, momentum is neutral enough to prevent an immediate squeeze but primed to flip overbought on the next leg up. The entry zone between 3.5971 and 3.6427 aligns perf
NEAR-2.69%
My March post already warned that another panic-driven drop would form a bottom range! Those who read my post should all have gotten in by now, right?
If you haven't gotten in yet, don't rush! Remember not to chase the highs! Maybe I'll come back to pick you up after the National Day holiday!
If it shoots straight up like this, the plunge will also come very quickly#牛市进行中… #山寨币热点 Never rush to chase the rally
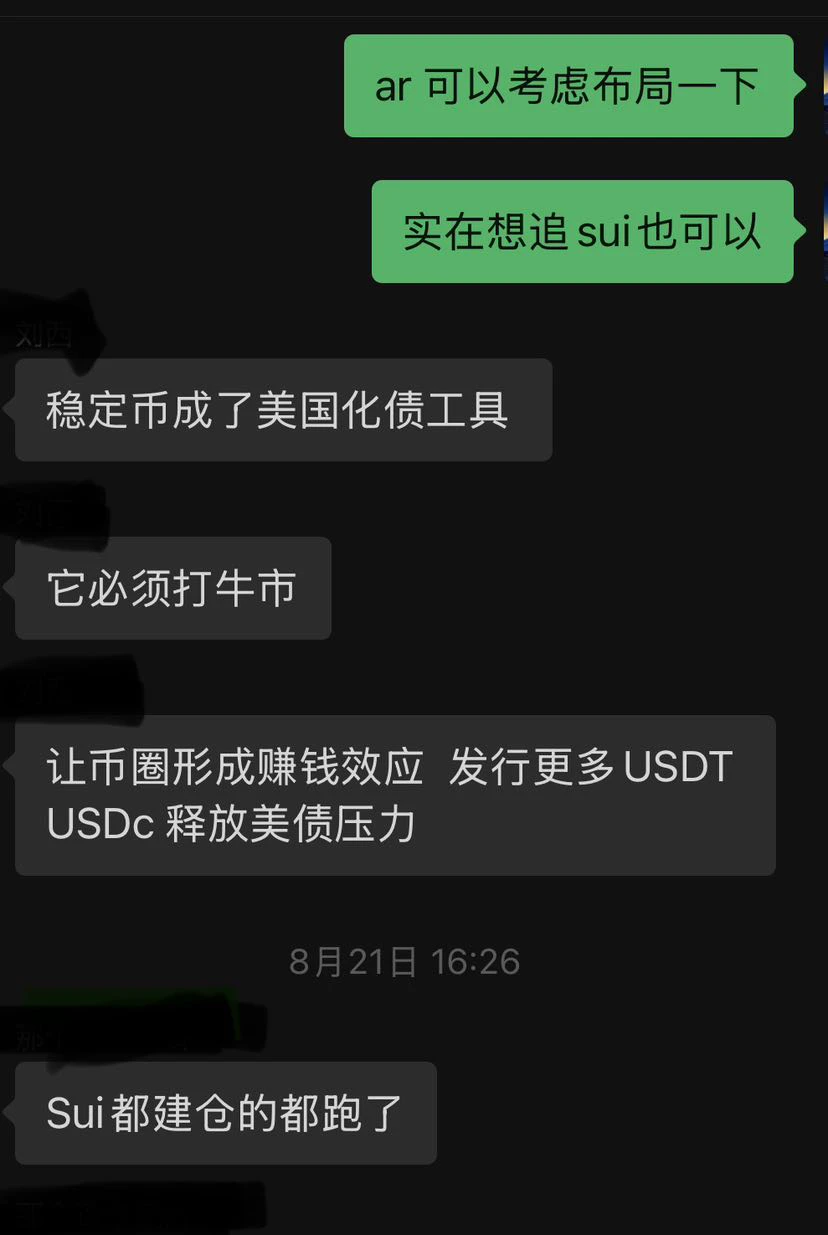
Started dollar-cost averaging into AR in June, then chased the breakout in August! It has already more than doubled!
Follow me, and next I'll share several promising projects at their low
post-image
Nobody is talking about this $PEPE /USDT setup hiding in plain sight

$PEPE /USDT - SHORT

Trade Plan:
Entry: 0 – 0
SL: 0
TP1: 0
TP2: 0
TP3: 0

Why this setup?
Why now? The daily trend is range, which means price is coiling and a directional breakout is overdue. The 15m RSI sits at 77.33, signaling overbought exhaustion that often precedes a sharp reversal. The 1h ATR is 0.0, showing near-zero volatility compression before a potential explosive move. The entry zone at 0 defines the precise trigger for the short bias. TP1 and TP2 are both 0, confirming the target structure is locked. The inv
PEPE+10.68%
  • 1
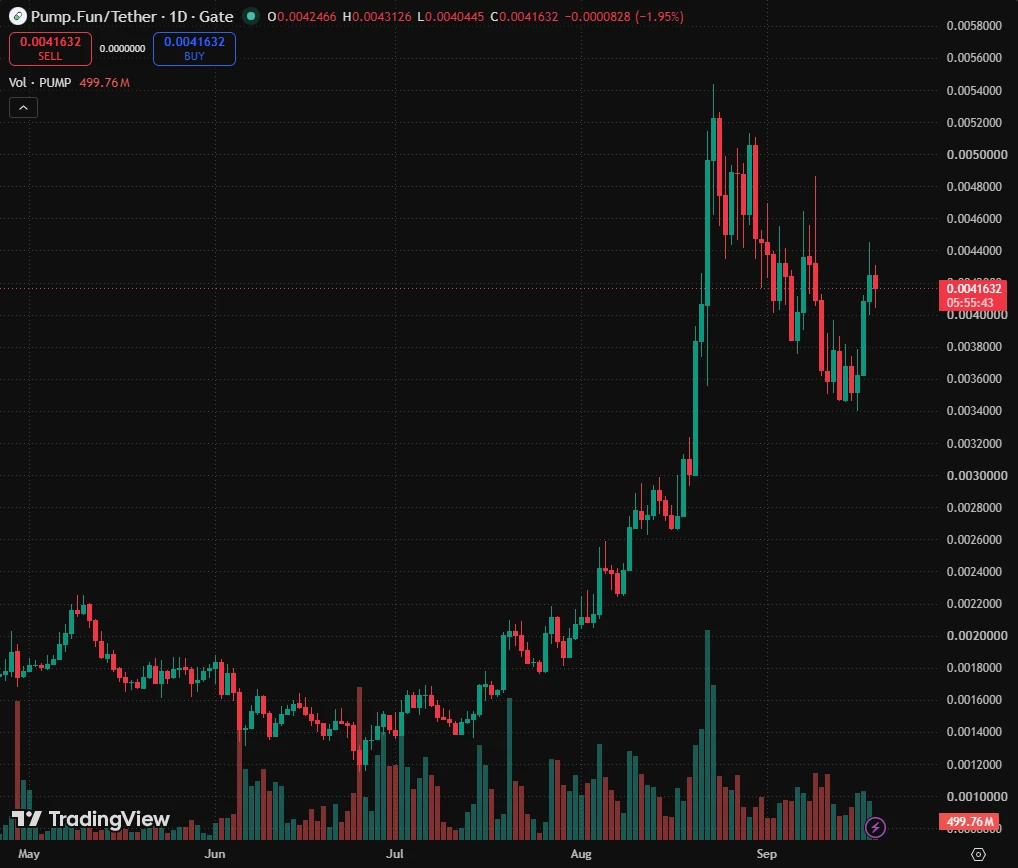
$PUMP pumpusdt
We’re looking at the PENDLE chart on the daily timeframe
If we get a weekly close above the volume area marked on the chart — the red line — that would be a very important signal for me and would make me more bullish on the continuation of this move.
PENDLE has also picked up some solid momentum over the past two days, and I’ve marked the upcoming targets on the chart.
There’s also a bearish scenario to consider: if the 0.033 support gets lost, my bullish scenario would temporarily enter a time-correction phase, and I’ll update the chart again at that point.
Overall, I personal
post-image
PUMP-4.06%
market trend BTC
live-cover
LIVE88
Load More

Join 40 M users in our growing community

⚡️ Join 40 M users in the crypto craze discussion

💬 Engage with your favorite top creators

👍 See what interests you

Trending Topics

JapanRealEstatePowerChipStocksRise

59.64k Views4.48k Discussing

Japan's Nikkei extended gains on Sept 18, with real estate, power, and semiconductor sectors leading. Gate covers over 12,800 global stocks and ETFs, offering one-stop USDT trading across US, HK, Korean, and Japanese markets. [👉 Read more](https://www.odaily.news/en/newsflash/518749)

USAIConceptStocksRally

34.36k Views996 Discussing

GateTopsStockPerpetualCoverage

38.62k Views2.59k Discussing

View More