




Square
Following
Hot
News
Notifications
Profile
Share your thoughts
placeholder
Article
Why might your account's overall risk be far higher than expected even when you've only made a few trades?

Many traders review their positions one by one but overlook a more important question: Do these trades share a common source of risk?

Suppose you hold long positions in BTC, ETH, and SOL at the same time. On the surface, you hold three different assets. But if all three are affected by a broad market downturn, shrinking liquidity, or declining risk appetite, these trades could all lose money together.

These are three frequently overlooked issues in portfolio risk.

I. Correlation risk:
post-image
BTC-0.67%
ETH-1.26%
SOL-0.77%
(NEW STREAMER) BTC PREDICTION
live-cover
LIVE1,313
Trenches
ZIG
Z
bade
b
ZIG
0x8c...1145
Market Cap
$.
Change
.
24h Vol
$.
Holders
.
BTC
B
bade
b
BTC
C5xp...pump
Market Cap
$.
Change
.
24h Vol
$.
Holders
.
GM
G
bade
b
GM
0x13...7777
Market Cap
$.
Change
.
24h Vol
$.
Holders
.
Diamond
D
bade
b
Diamond
5VCE...pump
Market Cap
$.
Change
.
24h Vol
$.
Holders
.
STONK
S
bade
b
STONK
6GmA...UNgx
Market Cap
$.
Change
.
24h Vol
$.
Holders
.
11.7 Market Analysis

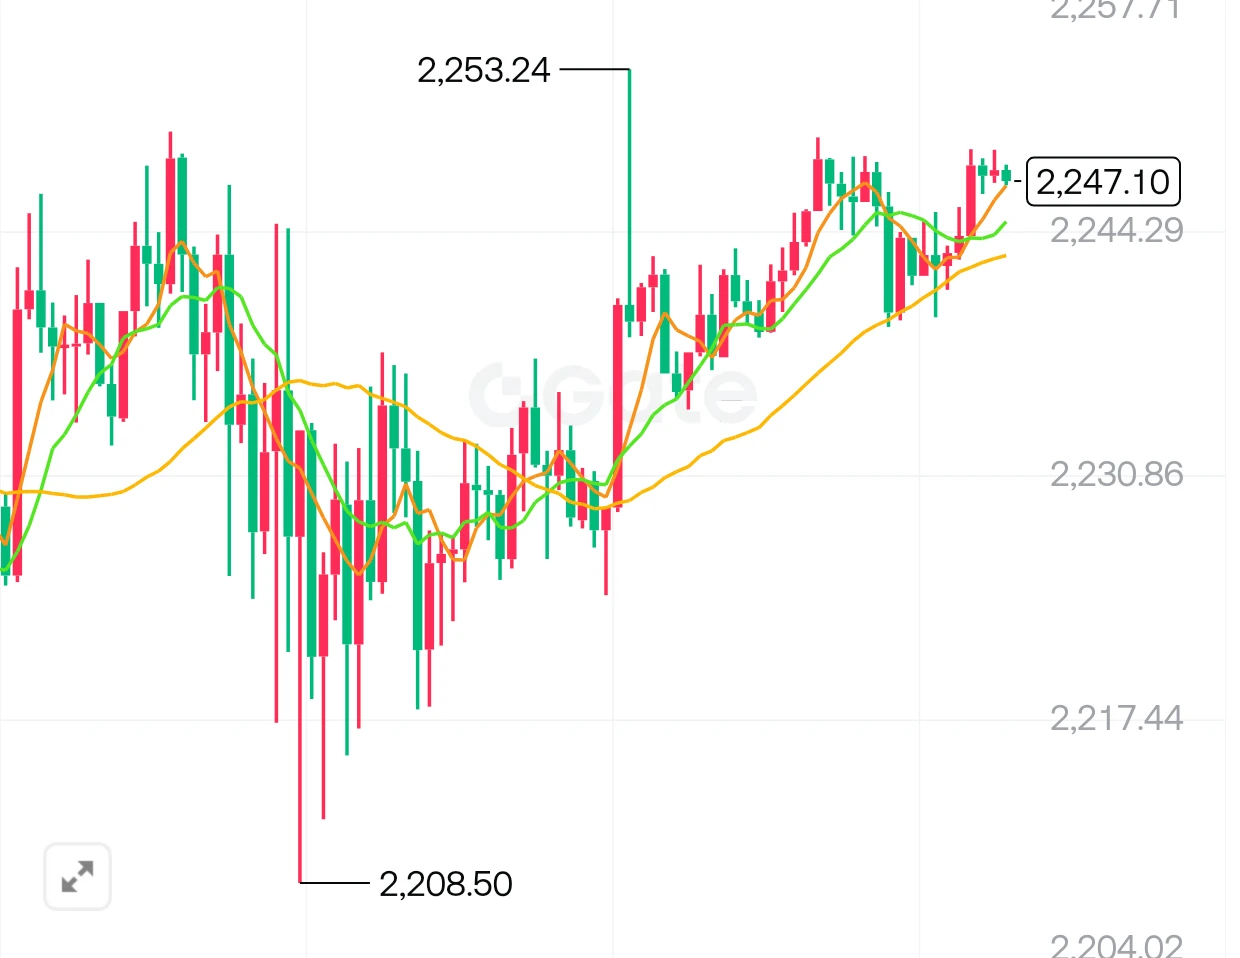
ETH Strategy Reference Setup
Rebound range: around 2260--2280
Level: 2300
First target: 2220, second target: 2170

New jobs, the unemployment rate, and wages all came in above expectations. Combined with upward revisions to previous figures, this sharply raised rate hike expectations. U.S. Treasury yields climbed, weighing on risk assets.
Fortunately, the bearish news was priced in; U.S. tech stocks rebounded and panic eased.

2205 is short-term support. Conditions for a sustained sharp decline are not yet in place, and the market is mainly expected to fluctuate within a
post-image
Why Do You Need a 100% Gain to Break Even After a 50% Loss?

In cryptocurrency trading, many people think that when an asset falls 50%, a 50% price rebound is enough to restore their original principal.

But this is a common mathematical misconception.

Losses and the gains needed to break even are not symmetrical. The greater the loss, the higher the return needed to restore your funds to their original level. That is why controlling drawdowns is more important than trying to make up for losses afterward.

First, why doesn't a 50% gain make up for a 50% loss?

Suppose you initially invest 1,0
post-image
🔴 $SOL SHORT SETUP — BEARS STILL HOLDING CONTROL!

$SOL is struggling to recover after a sharp sell-off, with price consolidating below key resistance.

Entry: 89.95
SL: 91.65

TP1: 89.20
TP2: 88.29
TP3: 87.30
Final Target: 86.50

Sellers still have the upper hand as buyers struggle to push price above 90.50–91.00. A breakdown below 88.29 could trigger another wave of selling toward 87.30 and lower.

Invalidation: A sustained recovery above 91.65 weakens the bearish setup.

Based on the supplied spot chart, not a live quote. Price is currently consolidating, so the short setup is speculative
SOL-0.77%
#BTCReclaims76000CanItHold #BTCBackAbove80K #ShareWeekly

BITCOIN FALLS BACK BELOW $80,000: IS THIS A HEALTHY RETEST OR THE START OF ANOTHER CORRECTION?

Bitcoin's recent recovery above $80,000 has lost momentum, bringing the market back to an important technical decision point. After rebounding from its recent low, BTC briefly climbed toward $80,949, raising hopes that buyers were preparing for another bullish move. However, the latest price action suggests that sellers are still defending higher levels, and the market has not yet established a convincing recovery.

Current Bitcoin Market Ov
BTC-0.67%
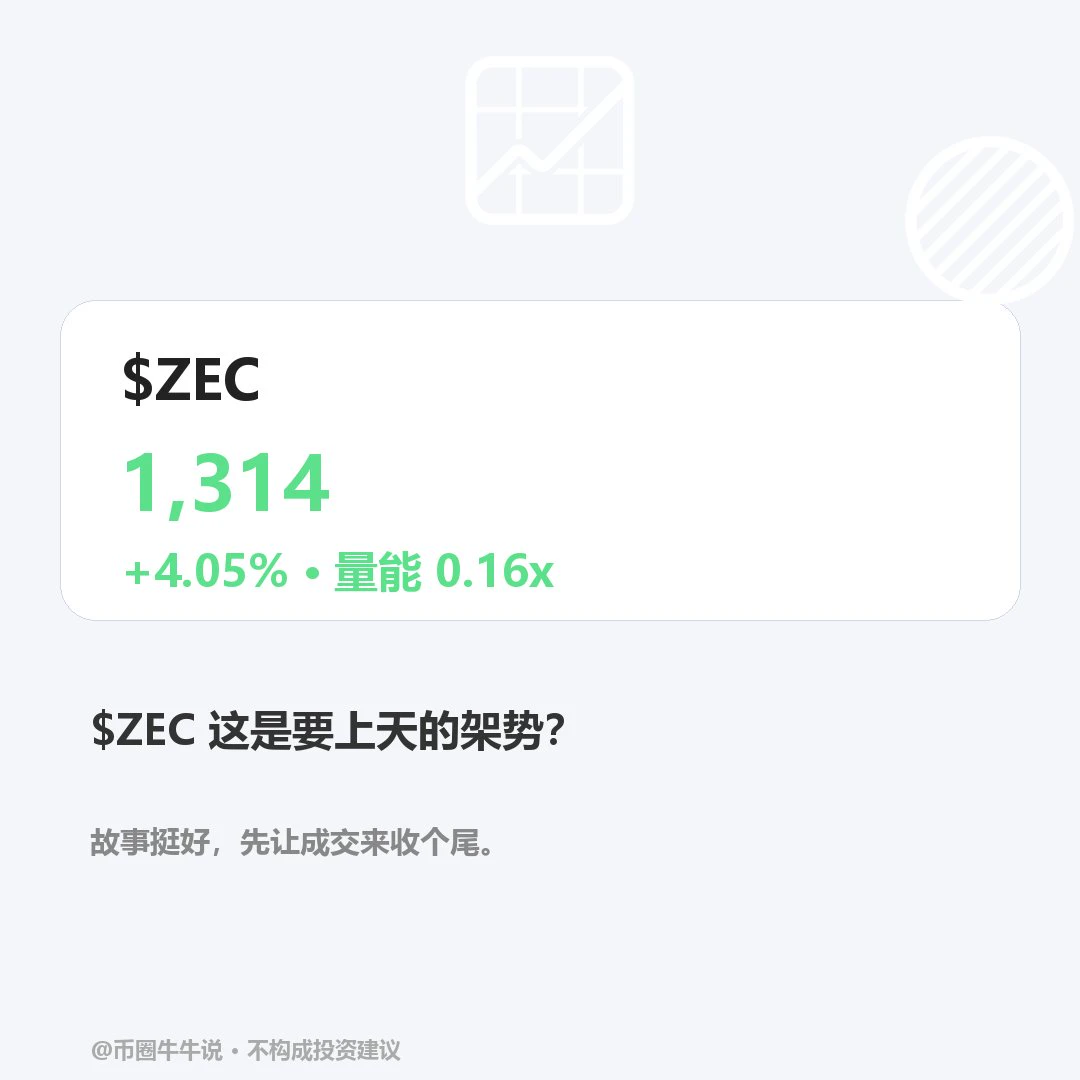
$ZEC Currently at 1313.5, up 4.05% over 24H, with a range of 1247.89–1387.89 and trading volume of 88.555 million. The 1H outlook is weak (RSI 37.63, price below EMA20 at 1324.64); the 4H outlook is strong (RSI 52.77, price above EMA20 at 1291.47). The volume ratio is 0.16. Holding above the 1387.89 resistance could signal further gains, while falling below the 1247.89 support would weaken the short-term outlook. Key levels to watch: whether 1387.89 holds, and whether price can recover after losing 1247.89. The two timeframes remain at odds, so short-term changes should not be taken as a trend
post-image
ZEC+1.16%
WTF
ITS SATURDAYYYYY
GM
post-image
📣 November 6 Daily Top Posts: Good insights deserve to be seen
When will heavy AI investment deliver returns? Does an index rebound mean the market is strengthening? After making a bad trading call, how should you reassess your thinking?
These 8 posts cover everything from market analysis to trading reflections. Let’s take a look at what creators are observing👇
🔹 @赚钱吃肉肉: Ongoing AI investment: Can profits and cash flow keep up?
https://www.gate.com/zh/post/status/curated/25443255
🔹 @龙抄手: Rebound or reversal? A video anal
GateSquare
📣 November 6 Daily Top Posts: Good insights deserve to be seen
When will heavy AI investment deliver returns? Does an index rebound mean the market is strengthening? After making a bad trading call, how should you reassess your thinking?
These 8 posts cover everything from market analysis to trading reflections. Let’s take a look at what creators are observing👇
🔹 @赚钱吃肉肉: Ongoing AI investment: Can profits and cash flow keep up?
https://www.gate.com/zh/post/status/curated/25443255
🔹 @龙抄手: Rebound or reversal? A video analysis of BTC / ETH
https://www.gate.com/zh/post/status/25417274
🔹 @币靠普: Beyond the AI growth story, what else are investors watching?
https://www.gate.com/zh/post/status/curated/25443260
🔹 @云享财富讲堂: Tech stocks under pressure: What else needs to be confirmed before the Nasdaq rebound?
https://www.gate.com/zh/post/status/25442782
🔹 @山顶Ryak: Understanding PoSEC and asset verification from the user’s perspective
https://www.gate.com/zh/post/status/25427269
🔹 @阿炼CryptoView: BTC / ETH strength and key levels after the pullback
https://www.gate.com/zh/post/status/25443539
🔹 @初心实盘: After a trading mistake with SanDisk, reassessing mindset and judgment
https://www.gate.com/zh/post/status/25433936
🔹 @分析师Ansem: How do news events affect market sentiment and short-term volatility?
https://www.gate.com/zh/post/status/curated/25437719
🎁 Selected authors receive 3 days of traffic support + featured content
💬 Which post gave you a new perspective?
Visit the original post to share your questions, additions, or differing views. You’re also welcome to recommend yourself or others for great content in the comments.
The next top post might be yours.
The author’s views are for reference only and do not constitute investment advice or a promise of returns.
‍#每日神贴 #Gate Square
repost-content-media
BTC-0.67%
ETH-1.26%
NDAQ+0.28%
INDEX+0.00%
Nasdaq plunged 5.52%, Nvidia and AMD tumbled together! Is the AI sky really falling?

U.S. stocks had a terrifying night on Thursday! Nasdaq plunged 5.52%, the S&P 500 fell 4.36%, Nvidia dropped over 9%, and AMD plunged 17%! Yesterday’s AI darling stocks are now lining up for the market’s “price reckoning.” Is this short-term deleveraging, or is the AI feast starting to wind down?
I don’t think this decline can be simply understood as an ordinary correction. In the past, just hearing the keywords AI, chips, or data centers was enough for the market to want to strap a rocket engine to stocks. N
AMD+11.55%
  • 33
When a trading strategy starts to fail, should you adjust its parameters or stop trading?

The real danger isn’t that a strategy loses money, but that you don’t know why it’s losing and keep changing its parameters in an attempt to repair the returns curve.

A strategy may once have worked, but the market won’t always behave the same way.

A trend may turn into a range, liquidity may decline, trading costs may rise, and entry signals that once worked may gradually lose their edge.

So how should you tell?

Step one: Determine whether it’s a normal drawdown or a change in the strategy’s assumpt
post-image
#10月非农数据聚焦 #BTCETH #WCTCS9

BTC contract trading strategy (latest reference price: around 76100)

BTC long at lower levels
Entry range: 75050~74750
Take-profit reference: 76500~77500
Stop-loss reference: 74300

BTC short at higher levels
Entry range: 77160~77460
Take-profit reference: 76400~75000
Stop-loss reference: 77860

ETH contract trading strategy (latest reference price: around 2240)
ETH long at lower levels
Entry range: 2205~2185
Take-profit reference: 2250~2305
Stop-loss reference: 2145

ETH short at higher levels
Entry range: 2305~2325
Take-profit reference: 2240~2185
Stop-loss
post-image
BTC-0.65%
ETH-1.23%
In BTC trading, many traders have had this experience: the price suddenly breaks through an important resistance level, and they think an uptrend has finally begun, so they immediately enter by chasing the rally. Before long, the price quickly falls back into its previous range, or even triggers their stop-loss. This phenomenon is commonly known as a fake breakout.
So, how can you identify a fake breakout?
First, watch trading volume. A genuine breakout usually needs some volume to support it. If the price breaks through a key level but trading volume does not increase significantly, market pa
post-image
BTC-0.67%
Can BTC hold $76,000? Will the next bull market start again from here?

If BTC really can stabilize around $76,000, I believe market sentiment will improve significantly. But what I'm more concerned about is whether this rally has staying power.
I think there are three key areas to watch.
First, price structure: Can it form higher lows, rather than seeing every rebound pushed down by selling pressure?
Second, fund flows: Are institutions and spot markets continuing to buy, rather than activity being limited to the futures market?
Finally, the macro environment: Fed policy, the dollar's traject
BTC-0.67%
  • 23
#WCTCS9 #$XAU
Gold at $4,100: Why Reclaiming It Matters More Than Hitting It

Gold is sitting just below a level that matters. XAUT, the gold-backed token I'm using as a spot proxy on Gate, last traded around $4,060.60 on the live snapshot, with a 24-hour range of $4,045.40 to $4,124.90. The latest completed daily candle closed at $4,073.30, up about 0.56% on the day and roughly 1.65% over seven days. The live 24-hour figure is slightly negative (about -0.54%), so the two readings disagree depending on the window. That gap is itself a signal: the market is undecided and buyers have not yet pu
XAUT+0.30%
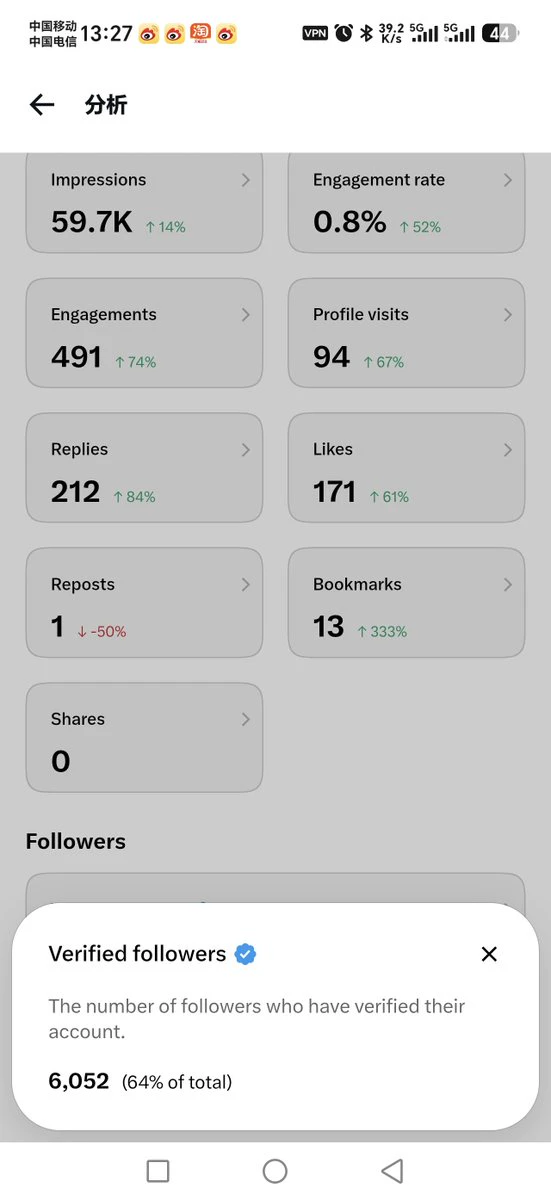
Blue V already has 6K followers,
and we're just 470 away from surpassing 10K total followers.
Let's push a little harder
and aim to reach our goal within 3 days—
a month and a half ahead of schedule!
You got this🌺🌺🌺
post-image
#BTCETF资金持续流出 For now, continued ETF net outflows look more like short-term risk aversion and deleveraging than institutions collectively exiting Bitcoin. But the concentration of outflows in BlackRock's IBIT also shows that some large investors are adjusting their allocations.

Why this doesn't look like a collective institutional retreat
Outflows were highly concentrated: From November 2–5, cumulative outflows were about $869.8 million, of which IBIT alone accounted for about $806.5 million.
There were both inflows and outflows: On November 4, there was a net inflow of about $128 million, wi
BTC-0.31%
IBIT-0.30%
BLK+0.60%
  • 3
$LYN Actually, I see 100x potential in buying the dip on this coin. It’s up threefold, and its market cap is only 7 million. The trading tactics are exactly the same as those of early-stage KAE!!!
post-image
LYN-0.44%
In cryptocurrency trading, many people watch BTC price movements every day, but often don’t realize that what’s really worth paying attention to is a few key price zones: support and resistance.
What is support?
Simply put, support is an area where buying pressure may gradually increase as the price falls. When BTC approaches an important price range and rebounds multiple times, it suggests there may be strong buying demand in that area.
What is resistance?
Resistance is the opposite: an area where selling pressure may increase as the price rises. If BTC rises to a certain level multiple times
post-image
BTC-0.67%
new stream crypt
live-cover
LIVE1,677
Load More

Join 40 M users in our growing community

⚡️ Join 40 M users in the crypto craze discussion

💬 Engage with your favorite top creators

👍 See what interests you

Trending Topics

USAIStocksHitHard

15.28k Views3.64k Discussing

U.S. stocks sold off sharply on Thursday, November 5 (UTC). The Nasdaq closed down around 5.5%, entering correction territory, while the Philadelphia Semiconductor Index plunged roughly 12%, with chip stocks including $NVDA and $AMD posting steep losses. Beyond profit-taking, investors are growing concerned about the pace of AI data center construction, capital spending, and future returns on investment. The key question now is whether the AI sector’s lofty growth expectations need to be repriced. Where do you think the next opportunities will emerge: chip stocks, tech giants, or other sectors?

USNonfarmPayrolls

22.89k Views4.24k Discussing

StakeOnLaunchpoolToShare450KVLX

2.02k Views771 Discussing

View More