Square
Following
Hot
News
Notifications
Profile

YunxiangWealthLectureHall

vip
Guanlan | Yunxiang Research Institute · Yunxiang Wealth Lecture Hall Live at 10:30 / 20:00, Strategy Reminders + Point Analysis Proprietary Team: Follow Indicators · Quantitative · Intelligence · Asset Management Stay grounded, unify knowledge and action (Strategies are for reference only and do not constitute investment advice. The market carries risks, and follow-up risks are at your own risk.)
Market AnalystCrypto Market ResearcherFutures Trading Strategist
16
Following
16.2k
Followers
1.4k
Liked
Pin
The essence of trading: Complete real-market training closed-door course!
live-cover
420 views07-06 13:28
Ended • No Replay
【Nonfarm Payrolls Are In: Crypto and Gold Weaken in Tandem—What Is the Market Trading?】
After the nonfarm payrolls report, the market is temporarily interpreting the data as “employment remains resilient, cooling rate-cut expectations.” A stronger dollar and rising Treasury yields first weighed on risk assets such as BTC and ETH, as well as gold.
Many people may wonder: if the market is seeking safety, why is gold falling too?
Because what may be driving the market this time is not simply safe-haven sentiment, but interest rate expectations. Higher real interest rates and a stronger dollar rai
post-image
Looks set to keep falling tonight; short ETH at 2230/2250, stop-loss 2268$ETH ‌
ETH-1.23%
【U.S. October Nonfarm Payrolls: What to Expect From Tonight’s Market?】
The screenshot shows October nonfarm payrolls expected to come in at around 65,000, the unemployment rate at 4.2%, and month-over-month wage growth at around +0.3%. The release field still shows “--,” so for now we can only analyze scenarios—not treat the results as fact before they’re released.
What the market is really trading is not the absolute payroll figure, but how the actual number compares with expectations and whether it could change expectations for Fed rate cuts.
If employment is significantly stronger than expe
post-image
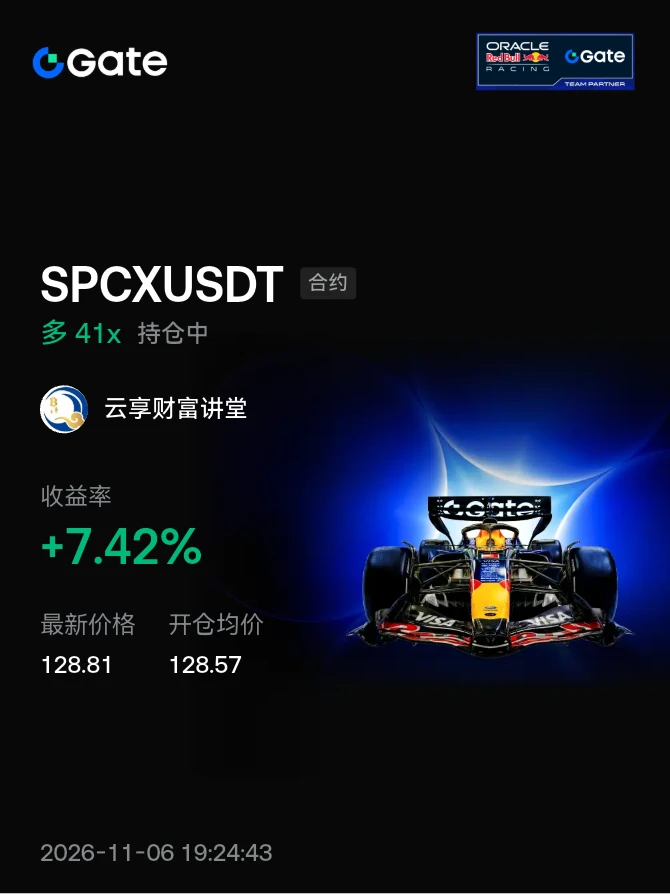
#晒出我的持仓收益 SPCX 120/125 is the best time to buy the dip. Although US stocks have plunged, the drop itself is an opportunity, $SPCX
post-image
SPCX+0.20%
Many people constantly use on-chain data to judge short-term price movements. This is actually the most dangerous approach, because data cannot directly tell you whether prices will rise or fall.

People are prone to translating a metric—“funds have moved”—directly into “the price will definitely rise or fall next.” A more robust way to read the data is:

Facts → Market structure → Trading behavior

If these three layers don’t align, the conclusion should be “take no action for now,” rather than forcing a directional call.

Layer 1: Facts. First, clearly state what the metric actually means; d
post-image
  • 2
美股跳水,加密跟跌,白盘修复晚间决战。
live-replay-cover
1,497 views11-06 11:40
02:15:34
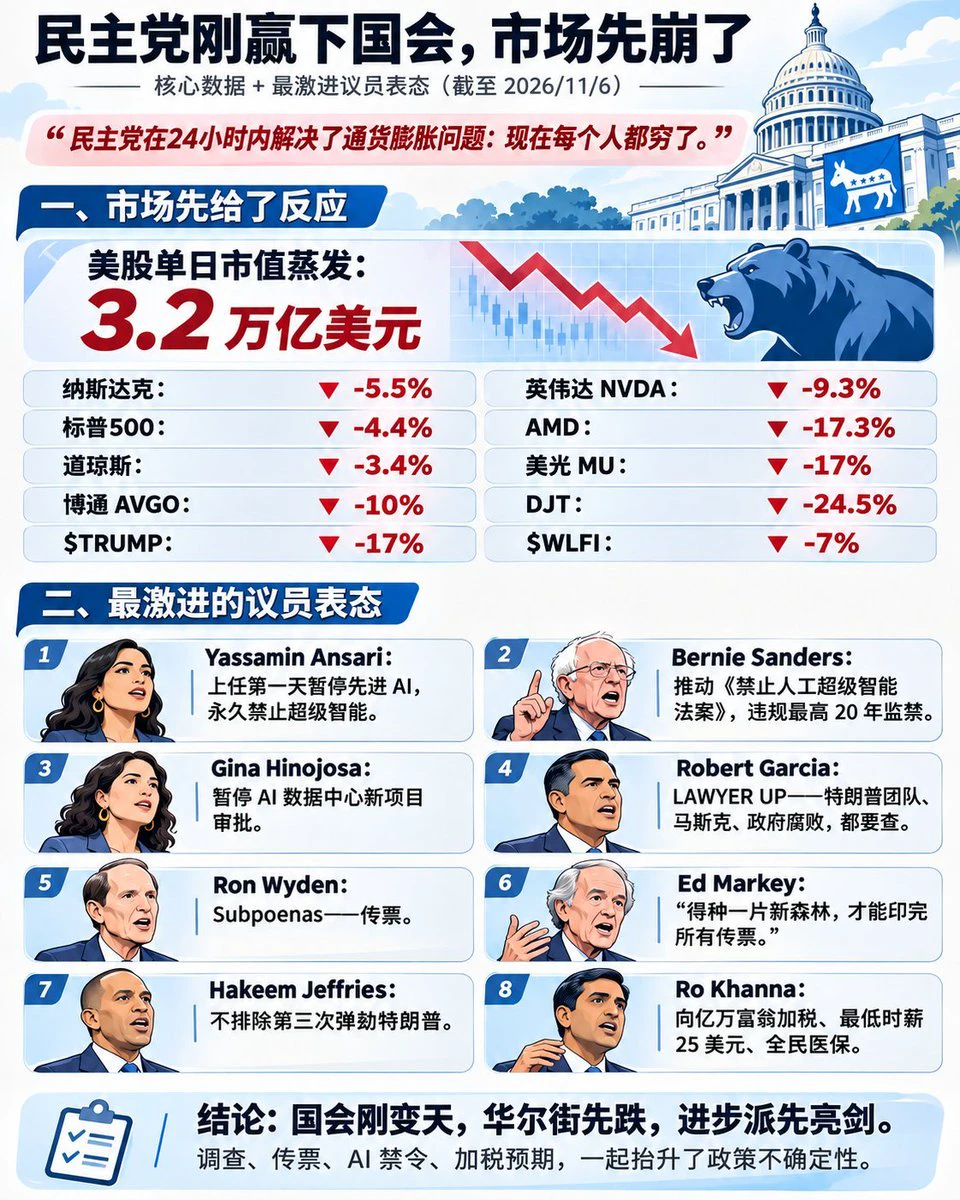
【After Democrats Won Congress, U.S. Stocks Fell. What Is the Market Pricing In?】

The most important takeaway from this chart is not “Democrats won, so U.S. stocks have to fall,” but that the election results changed how the market is pricing in future policy.

With control of Congress changing hands, new battles could emerge over the budget, taxes, AI regulation, investigations, and industrial policy. The president can still sign executive orders and advance some foreign and administrative policies, but Congress and the courts will impose greater constraints on legislation, appropriations, an
post-image
NVDA+2.80%
AMD+11.55%
  • 3
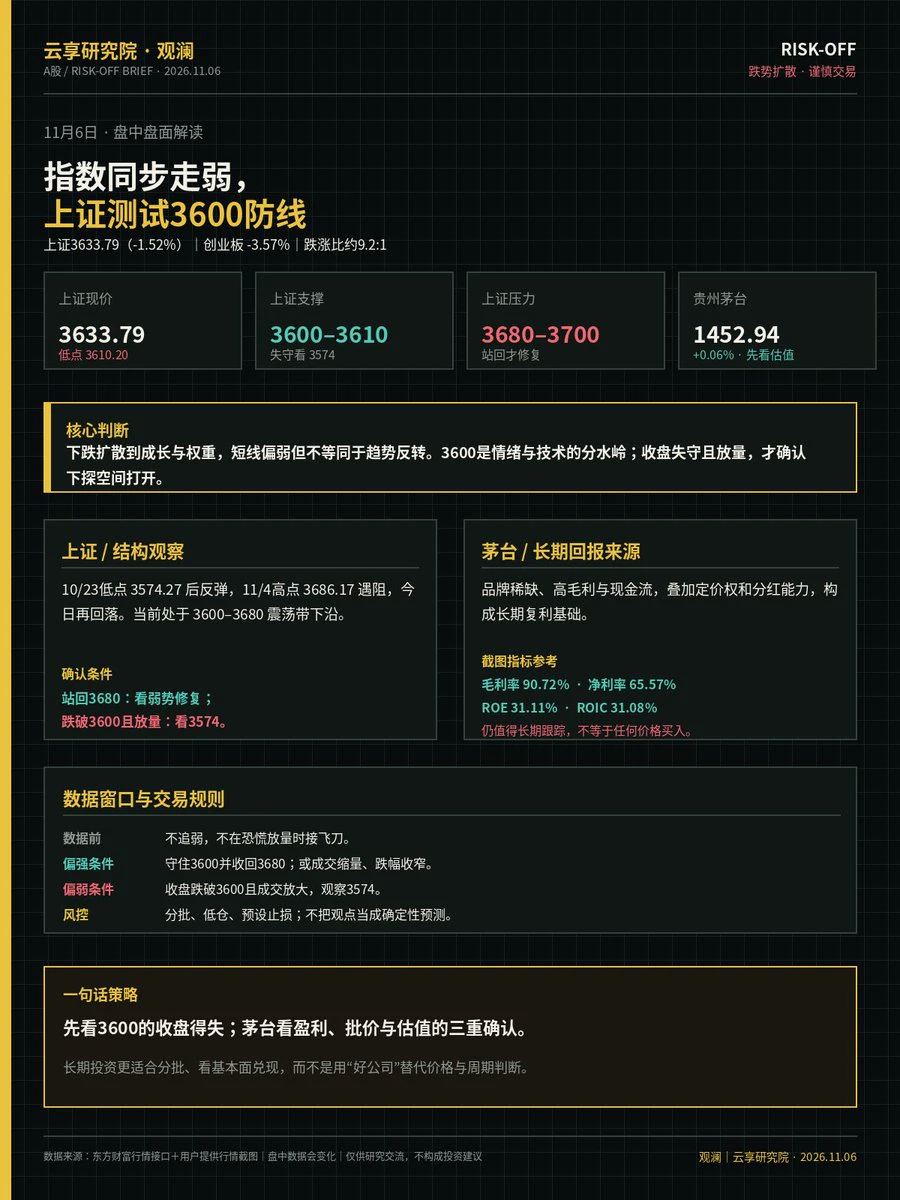
【Yunxiang Research Institute · Guanlan | Nov. 6 Intraday A-Share Market Commentary】
Major indexes weakened in tandem, with the Shanghai Composite testing the 3,600 support level.
Shanghai Composite 3633.79 (-1.52%), ChiNext Index -3.57%; 229 advancers and 2109 decliners, a decline-to-advance ratio of approximately 9.2:1, indicating a marked contraction in risk appetite.
Shanghai Composite: 3600–3610 is the first support zone. A close below this range on higher volume would put 3574 in focus as the next area to watch. 3680–3700 is resistance on a rebound; a return above this range would signal
post-image
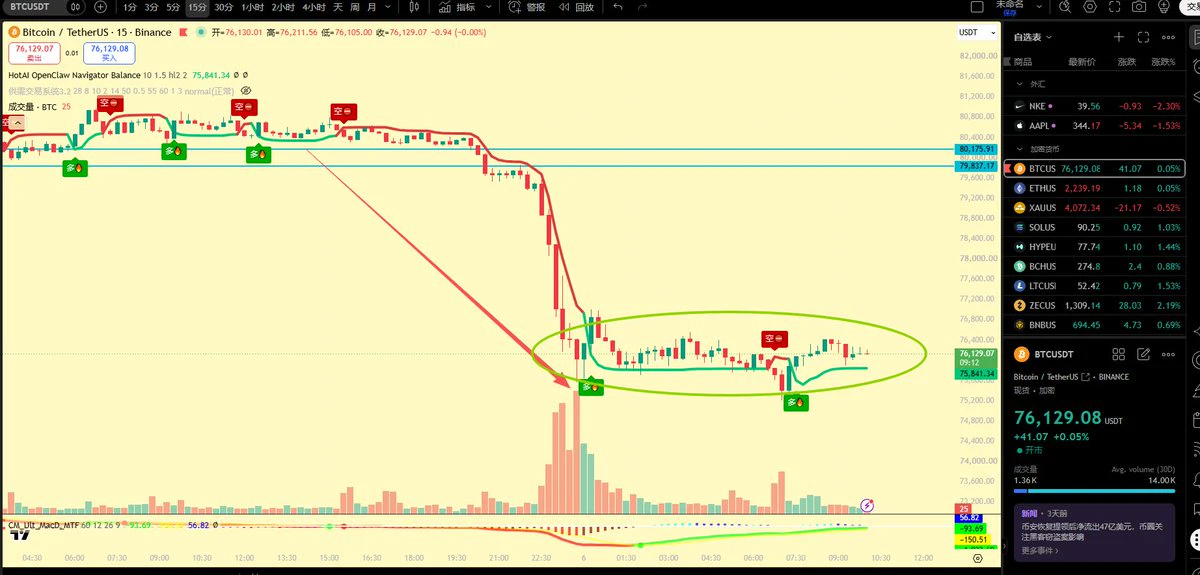
BTC’s daily chart showed a bull trap, followed by a pullback and breakdown. 80K has been breached, and we may have hit the short-term bottom. Price recovered during the day—hoping for some good news tonight to send it higher, guys. #WEB3
post-image
BTC-0.67%
After harvesting once in the west, they still need to harvest a second time, even a third—without leaving the east so much as a drop. Lao Zhao, is it time to pay protection money again...? #cz #Crypto Better keep a low profile; the bird that sticks its head out gets shot.
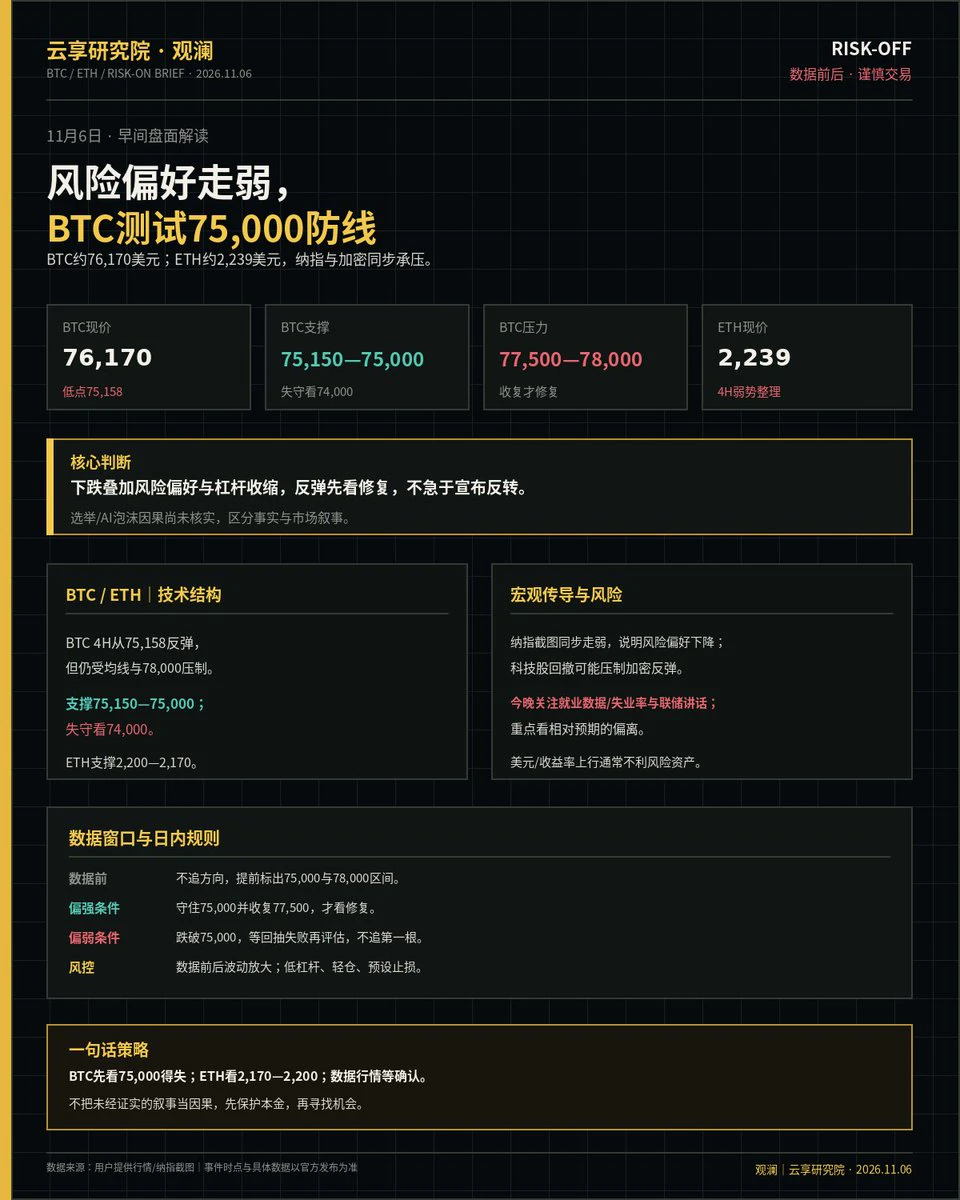
【November 6 | Morning Market Update and Macro Risks】
First, the facts: BTC is around $76,170. The weekly and daily charts remain in a pullback structure. It has rebounded from the 4-hour low of 75,158 but remains capped by the moving averages. ETH is around $2,239, consolidating weakly on the 4-hour chart. The Nasdaq screenshot shows risk assets under pressure across the board, with the market in a risk-off and deleveraging phase.
Key BTC levels: 75,150–75,000 below; a break below that puts 74,000 in focus. 77,500–78,000 above; reclaiming that range would open room for a recovery. ETH support
post-image
BTC-0.67%
ETH-1.26%
NAS100+1.90%
  • 1
  • 1
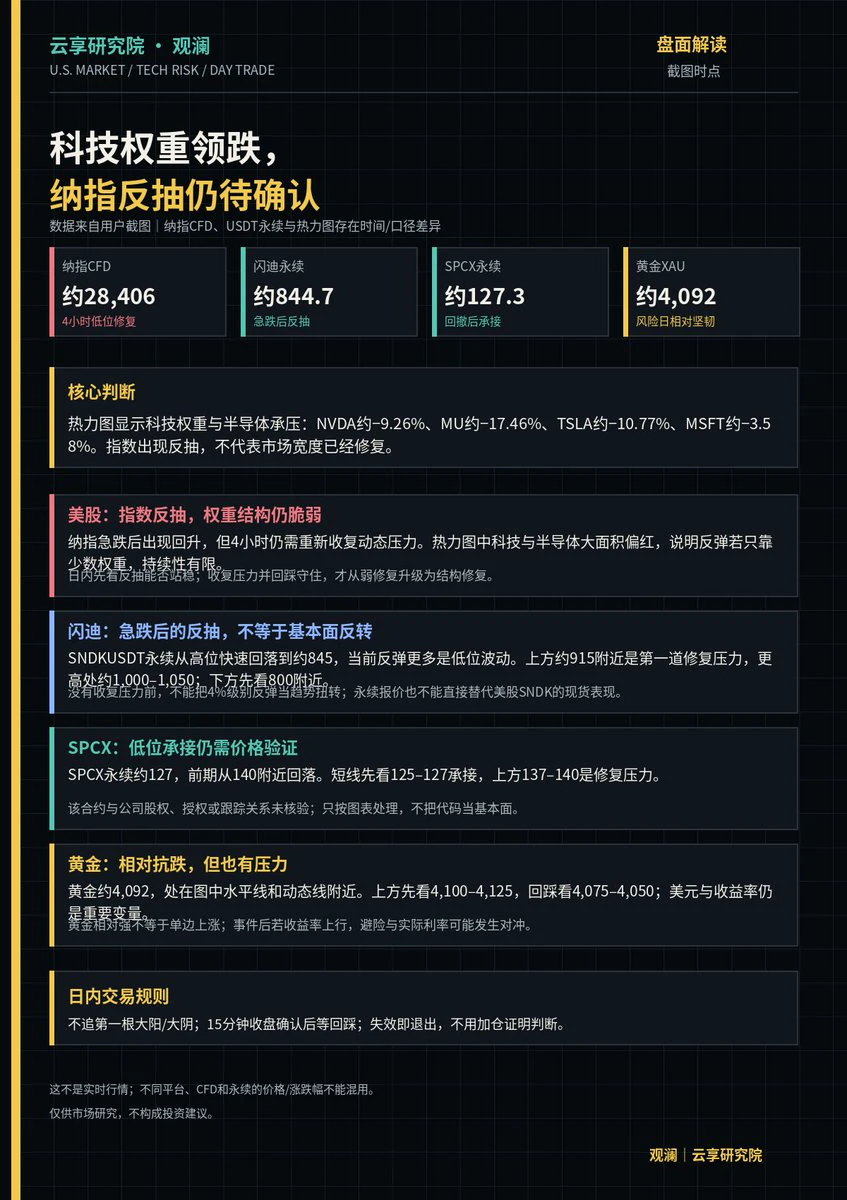
FeaturedThree trillion wiped out overnight—brutal. 【U.S. Market Snapshot | Tech-heavyweights lead declines; Nasdaq rebound still needs confirmation】
1. On the heatmap, NVDA is down about −9.26%, MU about −17.46%, and TSLA about −10.77%, with tech and semiconductors broadly weak. A rebound in the indexes does not mean market breadth has recovered.
2. Nasdaq CFD around 28406: First watch whether resistance can be reclaimed; don't chase the first green candle off the lows.
3. Sandisk perpetual around 845: Rebounding after a sharp drop, with around 915 as the first resistance to watch for a recovery and 8
post-image
NAS100-0.07%
NVDA+2.80%
MU+4.71%
TSLA+4.26%
SNDK-0.18%
btc eth zec link dot dash ada xmr avax near xrp bch ltc hype sol Watch for a rebound on the 15-minute chart; selectively enter long positions, with stop-losses near the intraday low. Catch a morning rebound. $BTC ‌
BTC-0.65%
  • 1
TRUMP pullback $TRUMP ‌
Go long around 1.18-2
Stop loss: 1.16 Target: 1.22/1.24
TRUMP-0.90%
  • 1
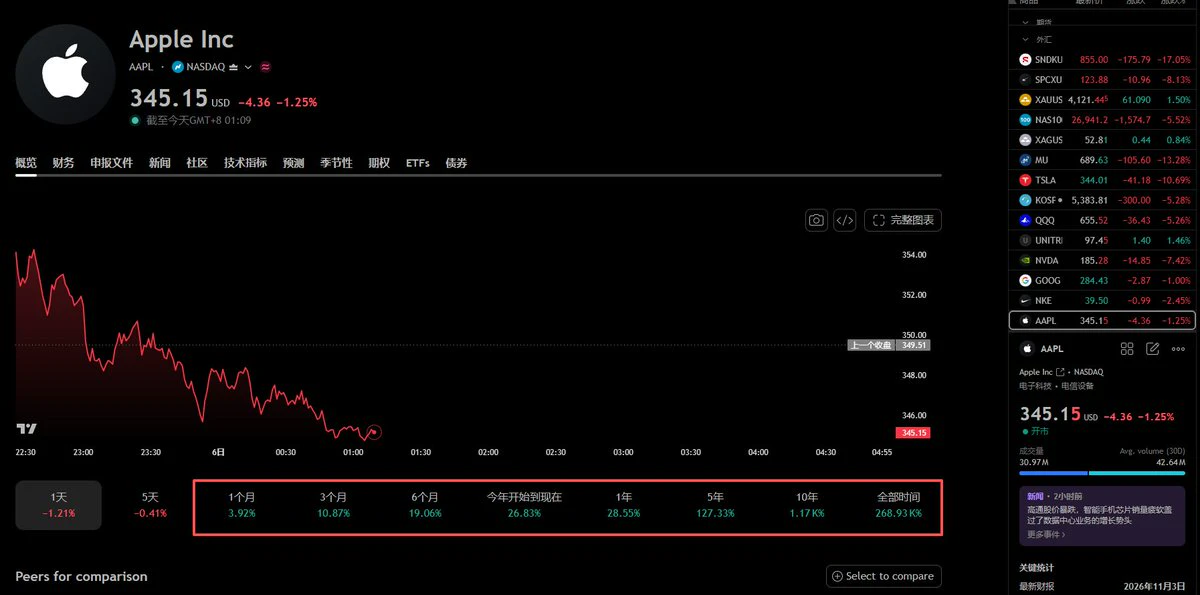
Apple’s long-term returns are impressive. This is a true value company worth holding for the long term, outperforming 90% of the derivatives on the market. Every dip is an opportunity, making it an excellent target for dollar-cost averaging. $AAPL
post-image
AAPL-0.57%
Load More