Share crypto content and earn up to 60% commissions through content mining.
placeholder
gatefun
$XRP This wave of short positions was perfectly captured!
From 1.3847 → 1.132, this wave's profit reached +1696.43%.
I told everyone before: a volume-less hard pull is just a trap for more buyers, and the counter-short has a very high win rate. The market has now proven this.
📌 What should we do next?
1. Take profit on 80%, secure the gains first;
2. Keep the remaining 20% in a light position, set the stop loss at the entry price to prevent profit reversal.
If you missed it, don't worry. The market is there every day. Wait for my next signal 🔔
$BTC $ETH
XRP3.28%
BTC1.53%
ETH4.21%
View Original
post-image
  • Reward
  • Comment
  • Repost
  • Share
BTC Bold moves you should not miss ✈️ 🤑
gate liveLIVE
46
  • Reward
  • Comment
  • Repost
  • Share
$ETH is back where it belongs - 2nd place 👊👽
ETH4.23%
post-image
  • Reward
  • Comment
  • Repost
  • Share
Central banks are voting with bullion, and the tally is deafening. The world's top official gold hoards now stand at staggering levels — the United States alone holds 8,133 tonnes. Beneath the surface of fiat markets, a silent accumulation is underway. As geopolitical fault lines widen, sovereign treasuries are asking a single question: what asset carries zero counterparty risk when alliances fracture?
🔹 The Leaderboard Reflects a Global Power Map
The United States remains the vault king with 8,133 tonnes, a legacy of Bretton Woods that still anchors the global monetary system. Germany follow
XAUUSD-3.28%
post-image
post-image
User_any
$XAUT Gold Bleeds Quietly
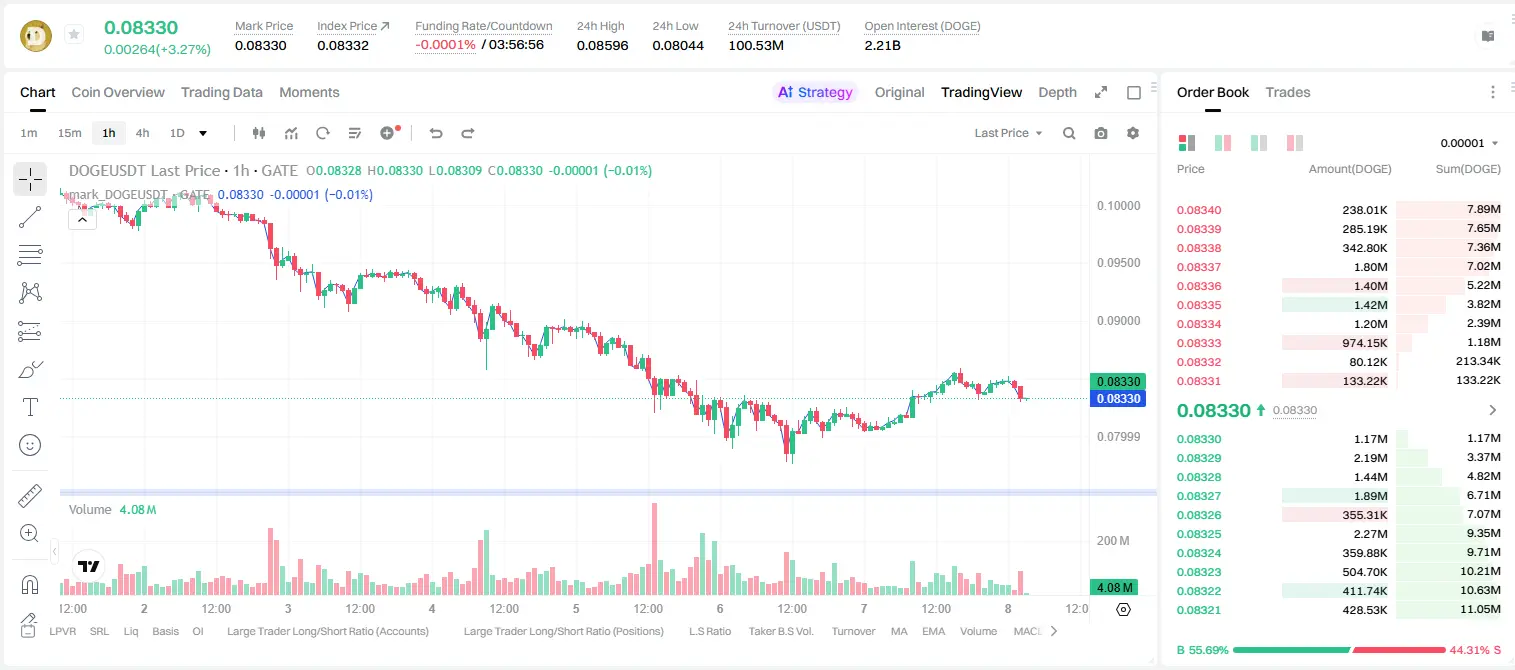
XAUT drifted to $4,294 on Saturday, a whisper of a 0.43% gain that barely registers against the carnage beneath. Zoom out and the picture sharpens: down 3.79% over seven days, 8.64% over thirty days, and a sobering 16.64% over the past ninety days. The digital claim on Swiss vault gold is caught in a grinding downtrend, and the charts are not yet calling a floor.
🔹 Trend Strength Is Unmistakably Bearish
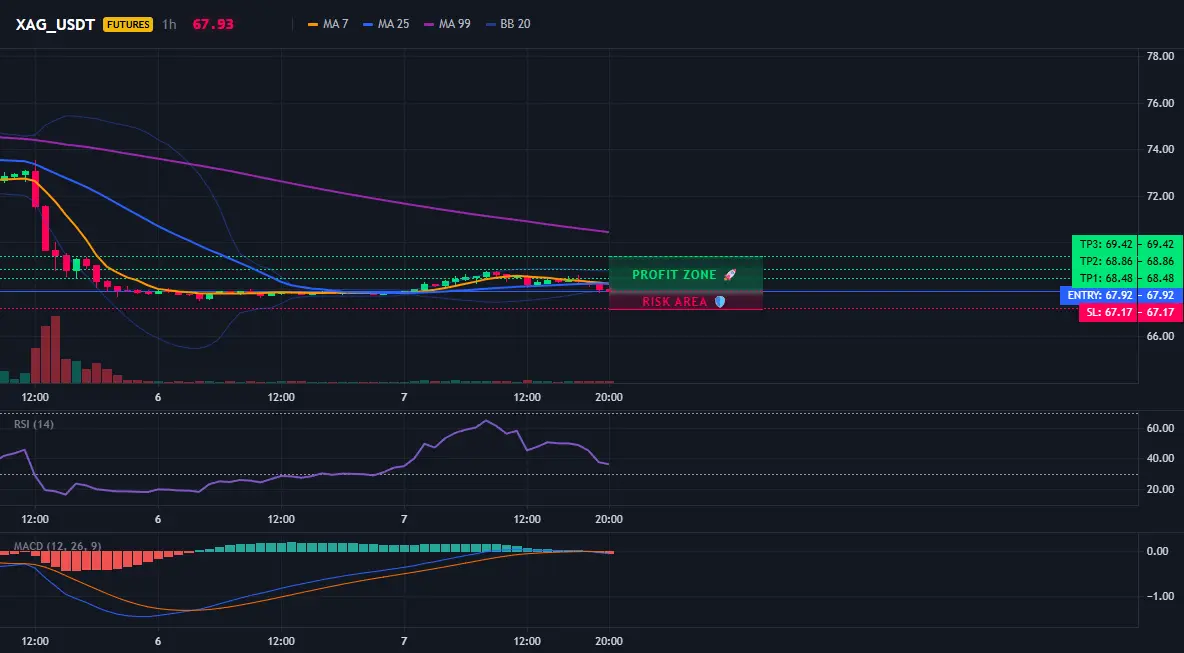
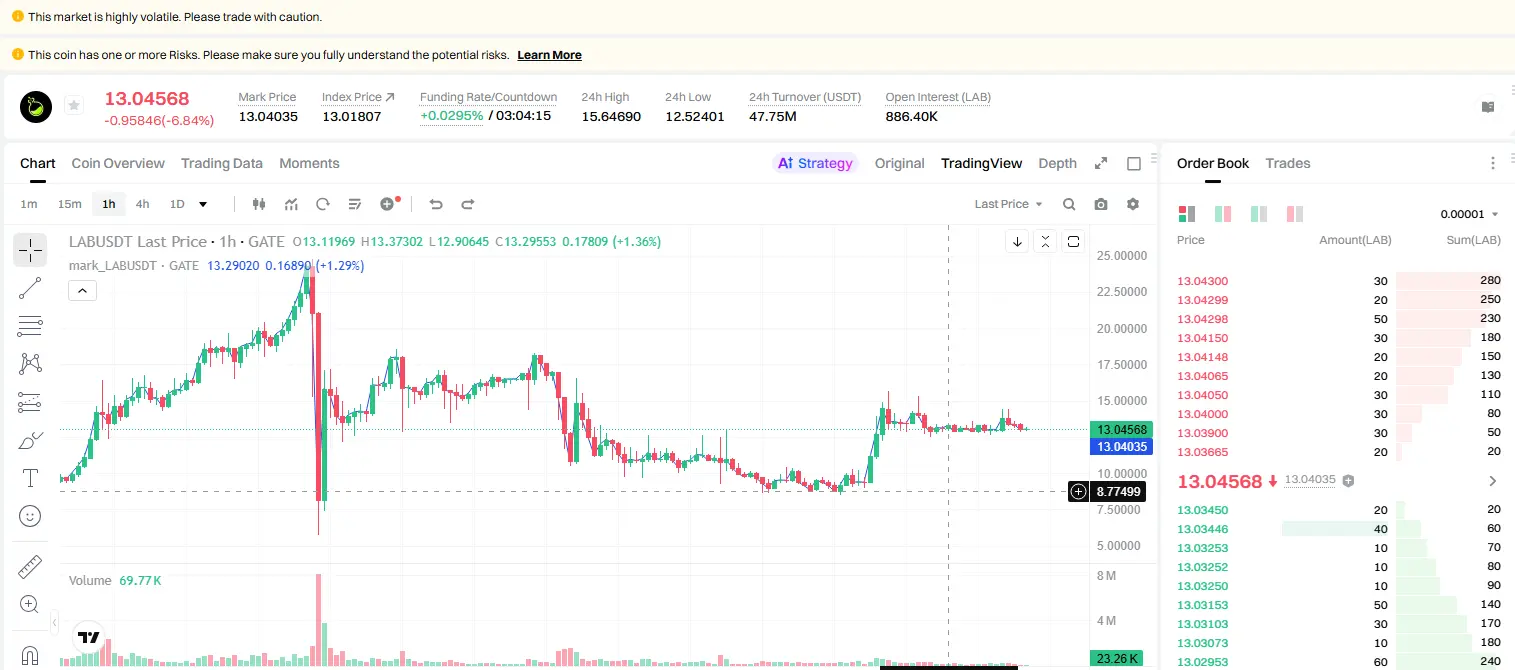
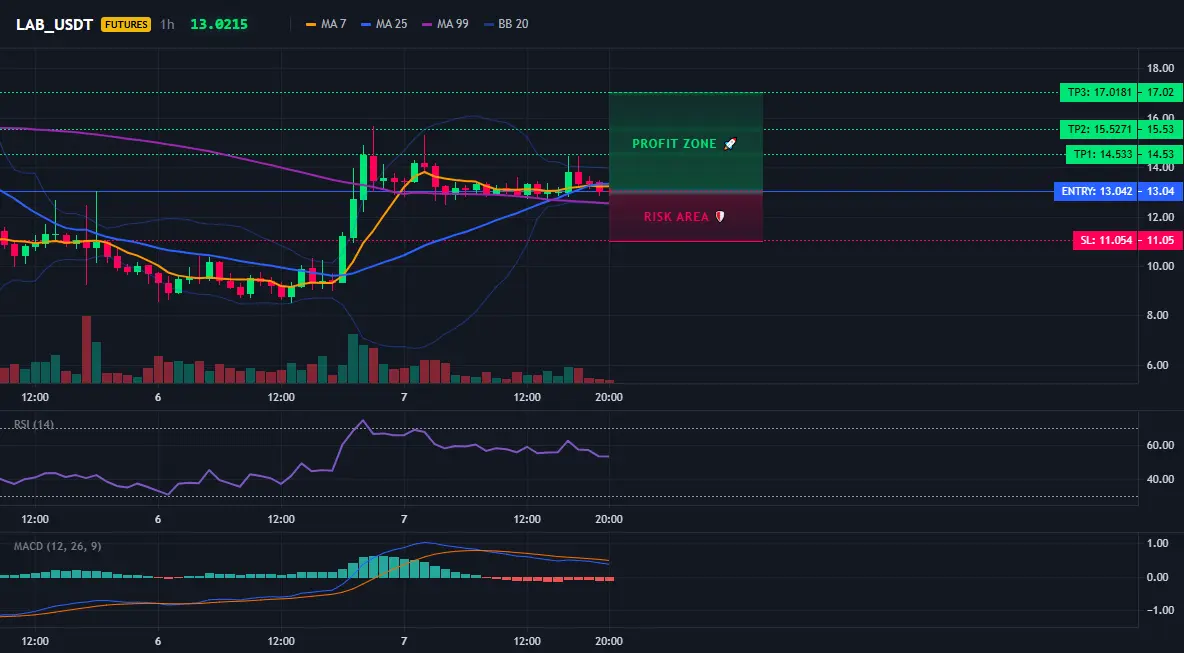
The moving averages have locked into a textbook bearish alignment across both the daily and 4-hour timeframes. MA7 sits beneath MA30, which sits beneath MA120. The Average Directional Index reinforces the message, printing 47.3 on the 4-hour and 33.08 on the daily. Any ADX reading above 25 signals a trending market. Above 40 signals a strong one. This trend has conviction behind it.
🔹 Oversold Signals Cluster Near the Panic Zone
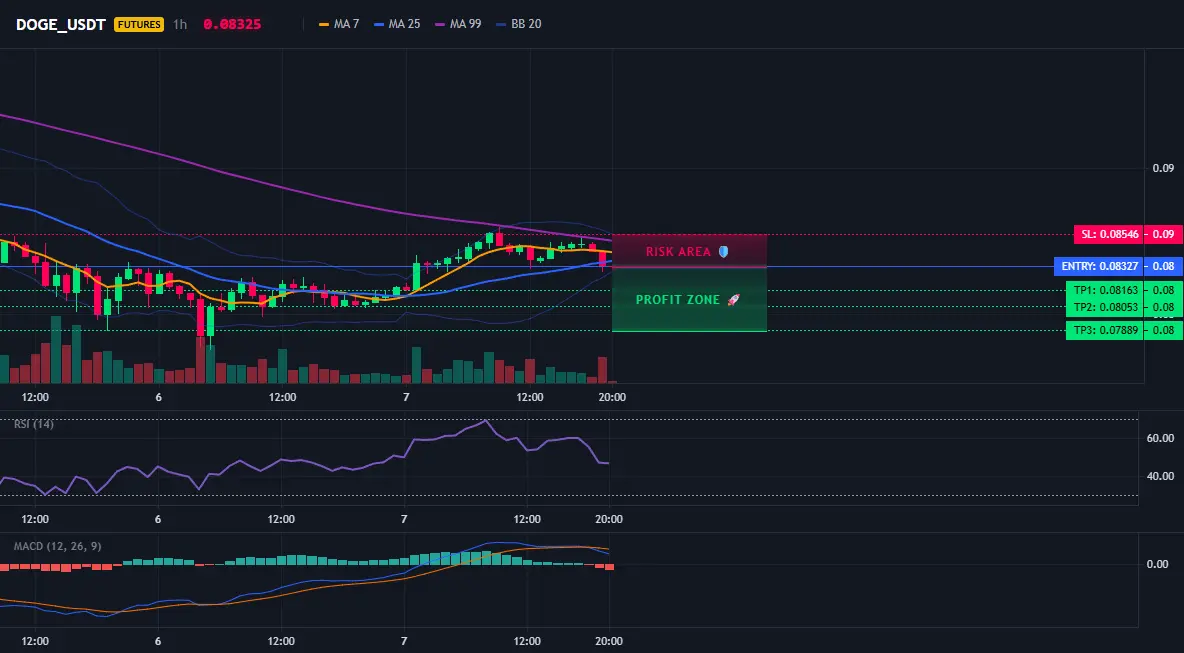
Beneath the trend, oscillators are screaming for relief. The Williams Range hit -86.98 on the 4-hour and -92.12 on the daily, both deep in oversold territory. The Commodity Channel Index plunged to -201.84. The KDJ J-value fell to -7.57. Price broke below the daily lower Bollinger Band at $4,309.7. When multiple oscillators line up this extreme, a snapback often follows. The question is whether it lasts beyond a few candles.
🔹 Volume Expands With Price — A Divergence Worth Watching
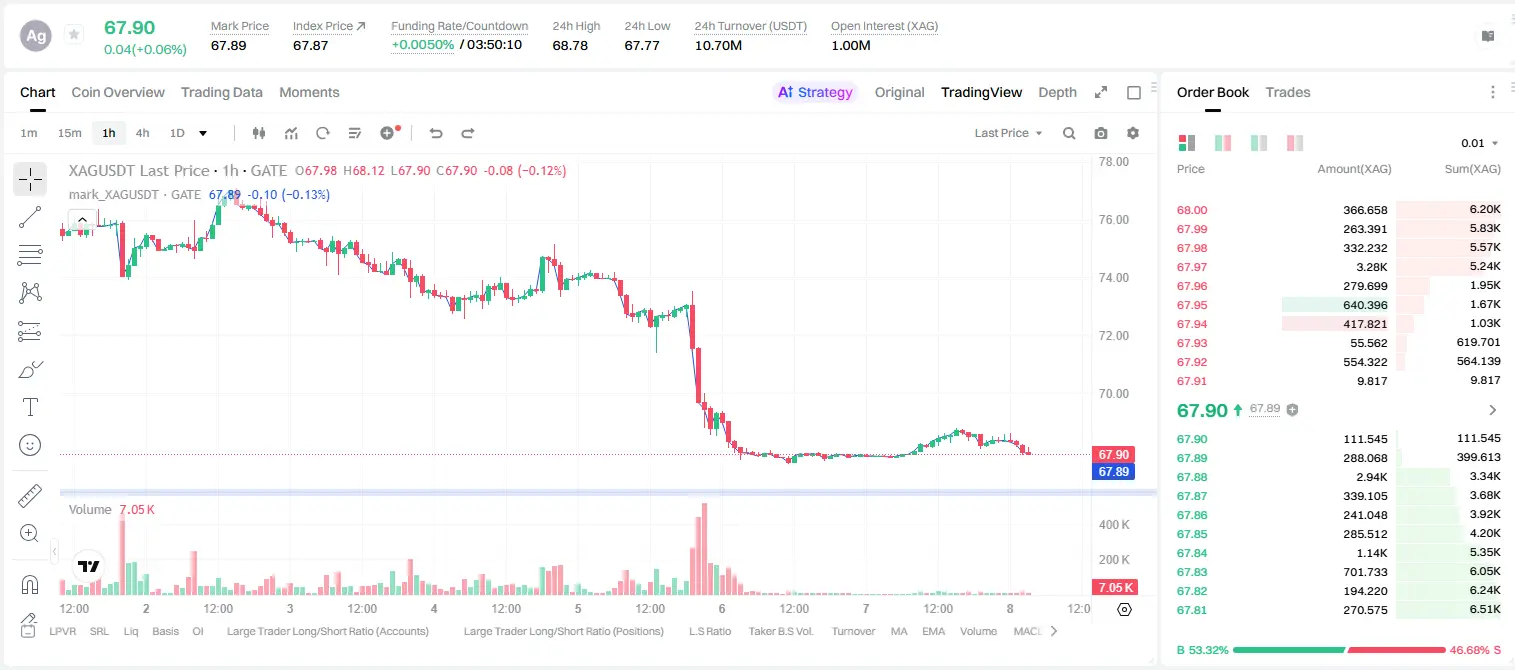
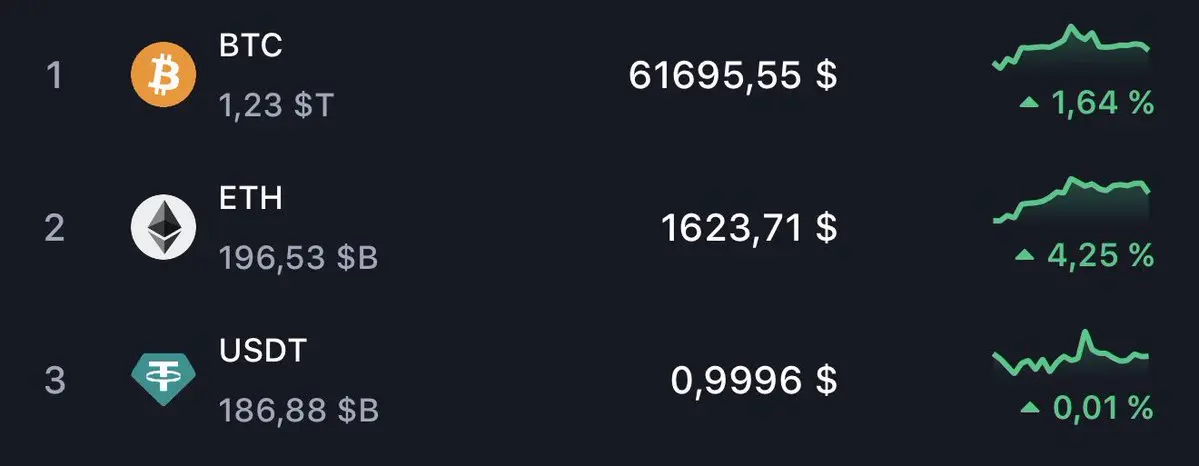
Volume showed significant expansion as price ticked higher, suggesting real money supported the modest bounce. Yet XAUT underperformed Bitcoin by 2.15% on the session, lagging the broader market recovery. Capital is rotating into risk assets on rate-cut hopes, and gold stablecoins are getting left behind in that rotation. Safe havens lose their shine when risk appetite returns.
🔹 Global Gold ETFs Shed $2 Billion in May
The physical gold complex is also cooling. Global gold ETFs bled $2 billion in outflows during May, led by redemptions in North America and Asia. This marks the second monthly decline of 2026. Yet the longer arc remains intact. Year-to-date inflows stand at $17 billion, following the exceptional $89 billion absorbed in 2025. The underlying demand structure for gold exposure has not collapsed. It is pausing.
🔹 Tether Expands Infrastructure While Price Corrects
Tether filed seven trademark applications in South Korea covering XAUT and its logo, positioning for a regulated expansion ahead of Korea's stablecoin framework. Partner Antalpha holds over $100 million in unrealized XAUT gains. Tokenized gold spot volume exceeded $90 billion in Q1 2026 alone, surpassing all of 2025 within a single quarter. The onchain utility is building even as the price chart trends lower. That divergence rarely persists indefinitely.
The trend is down, the oscillators are stretched, and the macro current is pulling gold in two directions at once. A short-term bounce is possible. A durable reversal demands a catalyst.
Friends, do you see XAUT finding support here and reversing toward $4,500, or does the downtrend have more room to run?
⚠️ Not financial advice.
$XAUUSD $XAU #ShareYourUSStocksWinNvidia
#Gate正式推出股票交易 #Gate美股
repost-content-media
  • Reward
  • 1
  • Repost
  • Share
cryptoLog:
2026 GOGOGO 👊
💰 $XLM Perfect sniper on a long position! 0.19➡️0.22, this wave +2653.49% profit, isn't it awesome?
Do you remember my tip from a few days ago at 0.19?
At that time, I told everyone: bottom sideways trading + strong key levels + strong capital intervention is a typical sign of a potential rise📈
Looking back now:
✅ The price surged to 0.22
✅ The wave gain was 37.37%
✅ The partners who followed directly took a +2653.49% profit!
📊 Current strategy (highlight this):
1 Take profit at 80%: lock in gains and put the profits in your pocket;
2 Keep 30% as a core position: gamble o
XLM-4.25%
BTC1.53%
ETH4.21%
View Original
post-image
  • Reward
  • Comment
  • Repost
  • Share
Everyone is bullish on ONDO—I’m looking at a 95% short signal that says otherwise.

$ONDO /USDT - SHORT

Trade Plan:
Entry: 0.3341 – 0.3383
SL: 0.3562
TP1: 0.3212
TP2: 0.3112
TP3: 0.2962

Why this setup?
Why now? The 4h MTF is bearish with a 95% confidence score, and the 1D trend confirms the downside. RSI on the 15m is at 43.61, still room to drop. Entry at 0.3362 with TP1 at 0.3212 and TP2 at 0.3112—the ATR of 0.0083 on the 1h shows momentum is building. This isn’t a guess; it’s data-driven.

Debate:
If ONDO breaks below 0.3341, are you shorting to TP1 or waiting for a bounce trap?
ONDO2.74%
post-image
post-image
  • Reward
  • Comment
  • Repost
  • Share
Don't just watch others win!
Are you still haven't claimed your 100% winning rate? 🎁
Countdown to the 19th Growth Value Lottery: 2 days!
Gold bars 10g, VIP experience cards, and more waiting for you to take home!
Click directly to the lottery scene 👉https://www.gate.com/activities/pointprize?now_period=19
Three steps to lock in your prize:
✅ Stay active in the plaza (posting/liking/sharing)
✅ Click 【Personal Profile】 - 【Growth Value Icon】 - 【Community Lottery】
✅ Leave the rest to luck, new and old users will never be disappointed!
📢 Comment section gathering: Show off your
XAU0.44%
BTC1.57%
ETH4.23%
GT2.44%
post-image
post-image
GateSquare
Don't just watch others win!
Are you still haven't claimed your 100% winning rate? 🎁
Countdown to the 19th Growth Value Lottery: 2 days!
Gold bars 10g, VIP experience cards, and more waiting for you to take home!
Click directly to the lottery scene 👉https://www.gate.com/activities/pointprize?now_period=19
Three steps to lock in your prize:
✅ Stay active in the plaza (posting/liking/sharing)
✅ Click 【Personal Profile】 - 【Growth Value Icon】 - 【Community Lottery】
✅ Leave the rest to luck, new and old users will never be disappointed!
📢 Comment section gathering: Show off your winning screenshot!
Let's see who has the best luck!
#BTC #ETH #GT
repost-content-media
  • Reward
  • Comment
  • Repost
  • Share
Labor Cracks, Dollar Rules?
The American job market is quietly splintering at the edges just as the greenback tightens its grip on the world. Long-term unemployment has surged to 1.99 million, 27.5% of all jobless — the highest share since the post-pandemic chill of December 2021. Meanwhile, U.S. dollar liabilities held by banks outside America have ballooned to a staggering $14.5 trillion, a fresh all-time record. Two forces pulling in opposite directions: a domestic labor market losing resilience, and a global financial system more tethered to the dollar than ever.
🔹 Long-Term Joblessness C
post-image
post-image
  • Reward
  • 2
  • Repost
  • Share
discovery:
To The Moon 🌕
View More
$ZEST A spark is needed for this to take off definitively.
ZEST2.4%
View Original
post-image
  • Reward
  • Comment
  • Repost
  • Share
#CFD
🚀📈💹🎯🔍💎🪙📊⚡🌐🏆
Summer is often associated with travel, new discoveries, and a desire to go beyond the usual experience. In the digital age, this need is increasingly shifting into the financial sphere, where innovative platforms create an environment for learning, experimentation, and building one’s own strategy for interacting with the market. The concept of a “dream explorer” is interesting not only as a marketing image, but also as a model of behavior for a modern participant in the crypto economy. People are no longer limited to the role of a passive observer of price changes.
BTC1.57%
GT2.44%
ETH4.23%
View Original
post-image
post-image
post-image
post-image
post-image
  • Reward
  • 3
  • Repost
  • Share
discovery:
To The Moon 🌕
View More
Everyone is still buying DOGE—but the 4h chart just flashed its most bearish signal in weeks.

$DOGE /USDT - SHORT

Trade Plan:
Entry: 0.08304 – 0.08350
SL: 0.08546
TP1: 0.08163
TP2: 0.08053
TP3: 0.07889

Why this setup?
• RSI on 15m is at 32.86 (oversold, but still falling).
• 1D trend is bearish, and price is below key EMA levels.
• 95% confidence on the SHORT means the setup is tight: entry at 0.08327, TP1 at 0.08163.
• Why now? The bounce is failing—momentum is collapsing into the weekly close.

Debate:
Are you shorting the breakdown to 0.08053, or waiting for a fakeout pump firs
DOGE2.6%
post-image
post-image
  • Reward
  • Comment
  • Repost
  • Share
Silver’s 4H chart just flashed a signal that trapped 70% of retail shorts last cycle.

$XAG /USDT - LONG

Trade Plan:
Entry: 67.86 – 67.98
SL: 67.17
TP1: 68.48
TP2: 68.86
TP3: 69.42

Why this setup?
$XAG /USDT RSI on 15M is at 32.4—oversold with room to rip • Entry zone 67.86–67.98 aligns with 1H EMA support • TP1 at 68.48 is a 0.8% scalp, but TP3 at 69.42 targets the range high • ATR on 1H shows low volatility contraction—breakout imminent

Debate:
If you had to choose between TP2 at 68.86 or a fakeout below 67.17, which side are you leaning on right now?
XAG0.22%
post-image
post-image
  • Reward
  • Comment
  • Repost
  • Share
The bearish Ethereum downtrend caught my attention—Bitcoin keeps repeating it by the millions 👀
'
Notice the similarity 👇👇👇👇
📊📊📊📊📊📊📊📊
View Original
post-image
  • Reward
  • Comment
  • Repost
  • Share
The crypto market is trading sideways near its low
gate liveLIVE
43
  • Reward
  • Comment
  • Repost
  • Share
$DOGE This wave of short positions, perfect prediction! 🔥
From 0.111 → 0.084, a straight drop of 40%!
Listen to the advice and follow along, this is a direct opportunity to turn your account around, with leverage included, the returns are quite substantial! 💰
Don’t be greedy now, just listen to me:
🔹 Close 80% first, putting the money in your pocket is the real deal;
🔹 Keep the remaining 20% for speculation, but remember to raise the stop-loss to the cost price, play it safe!
If you didn’t catch up, don’t worry, the market has been very volatile lately, opportunities come one after anothe
DOGE2.6%
BTC1.53%
ETH4.21%
View Original
post-image
  • Reward
  • Comment
  • Repost
  • Share
$US500 $US50050 $US500500
125% Gap Widens?
Tech stocks have officially run so far ahead of the rest of the market that history offers no roadmap forward. Since 2020, the S&P 500 Technology sector has outperformed non-tech equities by 125 percentage points. That is not a lead. That is a canyon. The sector has delivered roughly double the returns of everything else, and the divergence just hit an all-time record.
🔹 The Numbers Paint an Extreme Picture
The S&P 500 Tech sector trades at a forward price-to-earnings ratio near 29, while the equal-weighted S&P 500 excluding tech sits close to 16.5.
US500-2.9%
US50050-2.9%
post-image
post-image
User_any
Corporate America is gearing up to deliver its most explosive earnings growth outside a recession recovery in over two decades. S&P 500 calendar-year earnings per share are projected to reach $338 in 2026. That represents a 25% leap from 2025 levels, a pace typically reserved for economic rebounds, not the seventh year of an expansion. The engine behind this surge is the mega-cap technology sector, and the implications for every portfolio are immediate.
🔹 Mega-Cap Titans Carry the Torch
Analyst consensus shows Apple, Microsoft, Nvidia, Alphabet, Amazon, and Meta collectively driving over half of the S&P 500's total profit growth. Their earnings are projected to expand 38% year over year, fueled by cloud infrastructure, enterprise AI adoption, and a digital advertising recovery. Nvidia's data center revenue alone is expected to nearly double again. This concentration of strength is both a signal of secular demand and a reminder that the index rests on a handful of balance sheets.
🔹 Forward Valuations Ease Even if Prices Hold
Elevated multiples have dominated market conversation for months, with Apple’s price-to-sales recently hitting an all-time high. Yet when earnings grow at 25%, the forward price-to-earnings ratio compresses organically. At current index levels, the S&P 500 forward P/E sits near 21.5, still above the 10-year average of 18, but far from the alarm zone that flashy headlines suggest. If earnings deliver, the valuation ceiling expands.
🔹 Buybacks and Dividends Strengthen the Floor
Strong profitability generates cash, and corporate America is returning it. Buyback authorizations in the second quarter have already topped $380 billion, with technology firms leading the charge. Dividends from S&P 500 companies are on track to set a new annual record. This capital return cycle creates a technical bid under the market, cushioning volatility and rewarding long-term holders.
🔹 A Hawkish Fed Meets an Earnings Shield
Newly sworn-in Fed Chair Kevin Warsh has pledged to hold rates firm until inflation cracks. High rates typically punish high-multiple stocks by eroding the present value of future cash flows. Rapid earnings growth offsets that pressure. As long as profits expand at this clip, the tension between monetary tightness and equity resilience remains manageable. The true test arrives if macro conditions slow and earnings estimates start trimming.
The earnings engine is humming at full power. The price tag is already premium. The gap between the two is where the next trade lives.
Friends, do you see these $338 estimates as realistic or a setup for disappointment?
⚠️ Not financial advice.
#ShareYourUSStocksWinNvidia #IntroducingGateStocks
repost-content-media
  • Reward
  • 6
  • Repost
  • Share
CryptoAlice:
To The Moon 🌕
View More
#ShareYourUSStocksWinNvidia
Apple's price-to-sales ratio just hit 10.36 — an all-time record in the company's 47-year history. The average sits at 3.59. The market is pricing in a future so bright that almost nothing can go wrong. That is either genius foresight or a margin of safety completely erased.
🔹 Every Valuation Metric Screams Stretched
The P/S ratio is only one alarm bell. Price-to-book has surged past 62. Price-to-earnings crossed 38. Price-to-free-cash-flow touched 36. Each of these sits at or near multi-decade highs. The last time Apple traded above a 35 P/E for an extended stret
post-image
post-image
post-image
  • Reward
  • 3
  • Repost
  • Share
discovery:
LFG 🔥
View More
  • Reward
  • Comment
  • Repost
  • Share
Most traders will ignore $LAB /USDT until it’s too late—here’s why the 4h chart is screaming reversal.

$LAB /USDT - LONG

Trade Plan:
Entry: 12.83492 – 13.24910
SL: 11.05397
TP1: 14.53304
TP2: 15.52707
TP3: 17.01810

Why this setup?
• 95% confidence LONG signal with RSI 15m at 45.43—room to run before overbought.
• 1D trend is bullish, and current price is hugging the 4h EMA entry zone at 13.042.
• TP1 at 14.533 (+11.4%) is the low-hanging fruit, with TP3 at 17.018 if momentum catches.

Debate:
Is this the calm before a breakout, or will the ATR of 0.828 trap the bulls first?
LAB-6.37%
post-image
post-image
  • Reward
  • Comment
  • Repost
  • Share
🚀 $INIT As expected, it plummeted from 0.08136 → 0.05289, a drop of over 34.99%!
Friends who followed have gained +2590.81%, this is the power of trend-following shorting. 💥
⚠️ Latest instructions:
1 Suggest closing 80%, lock in profits;
2 The remaining 20% to bet on trend continuation;
3 Move all stop-losses up to the cost price, capital preservation first.
Friends who missed out don’t need to chase orders, recent opportunities are dense, wait for my next clear signal. ‍$BTC $ETH
INIT0.47%
BTC1.53%
ETH4.21%
View Original
post-image
  • Reward
  • Comment
  • Repost
  • Share
Load More