







Gate Square Little Classroom 🧑🏫
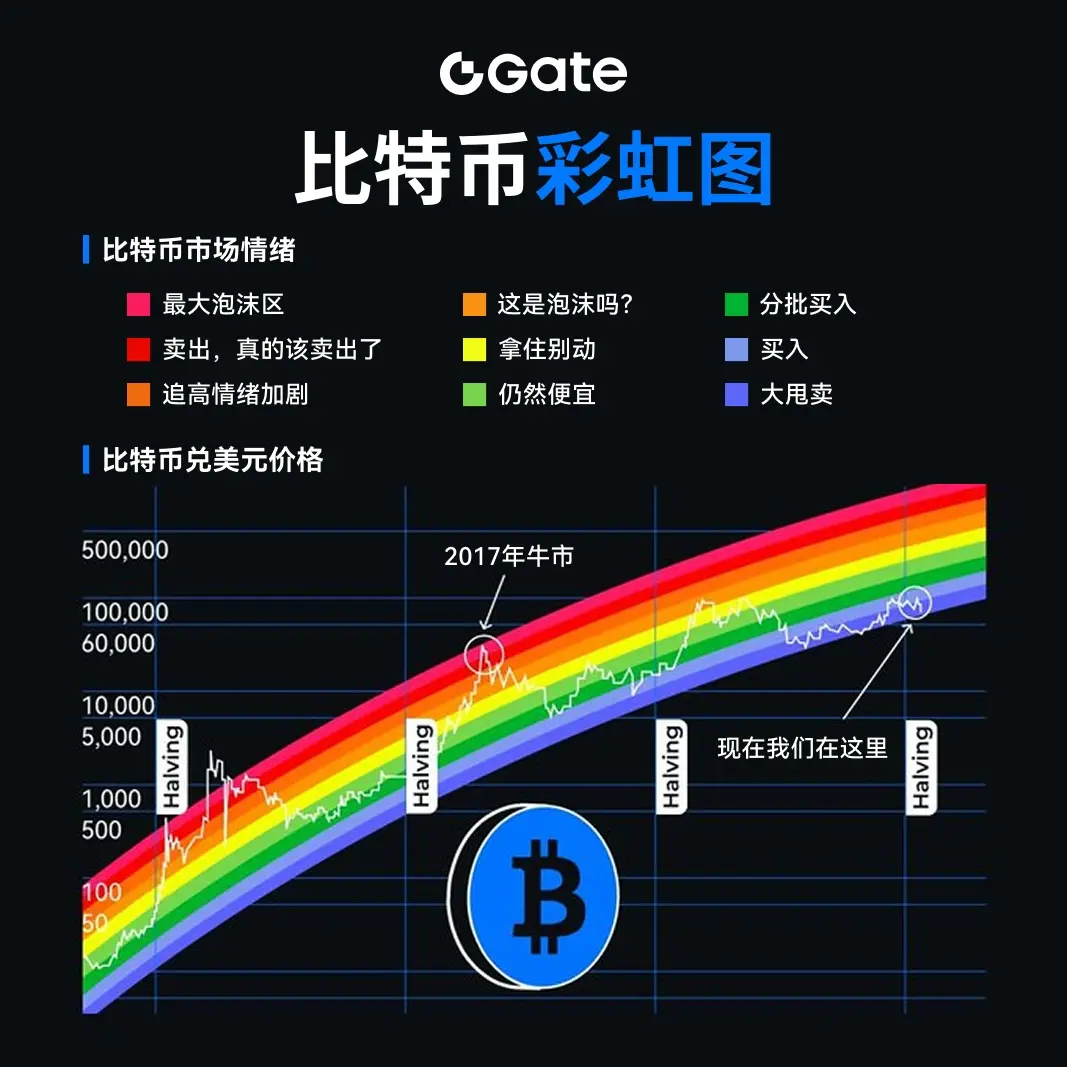
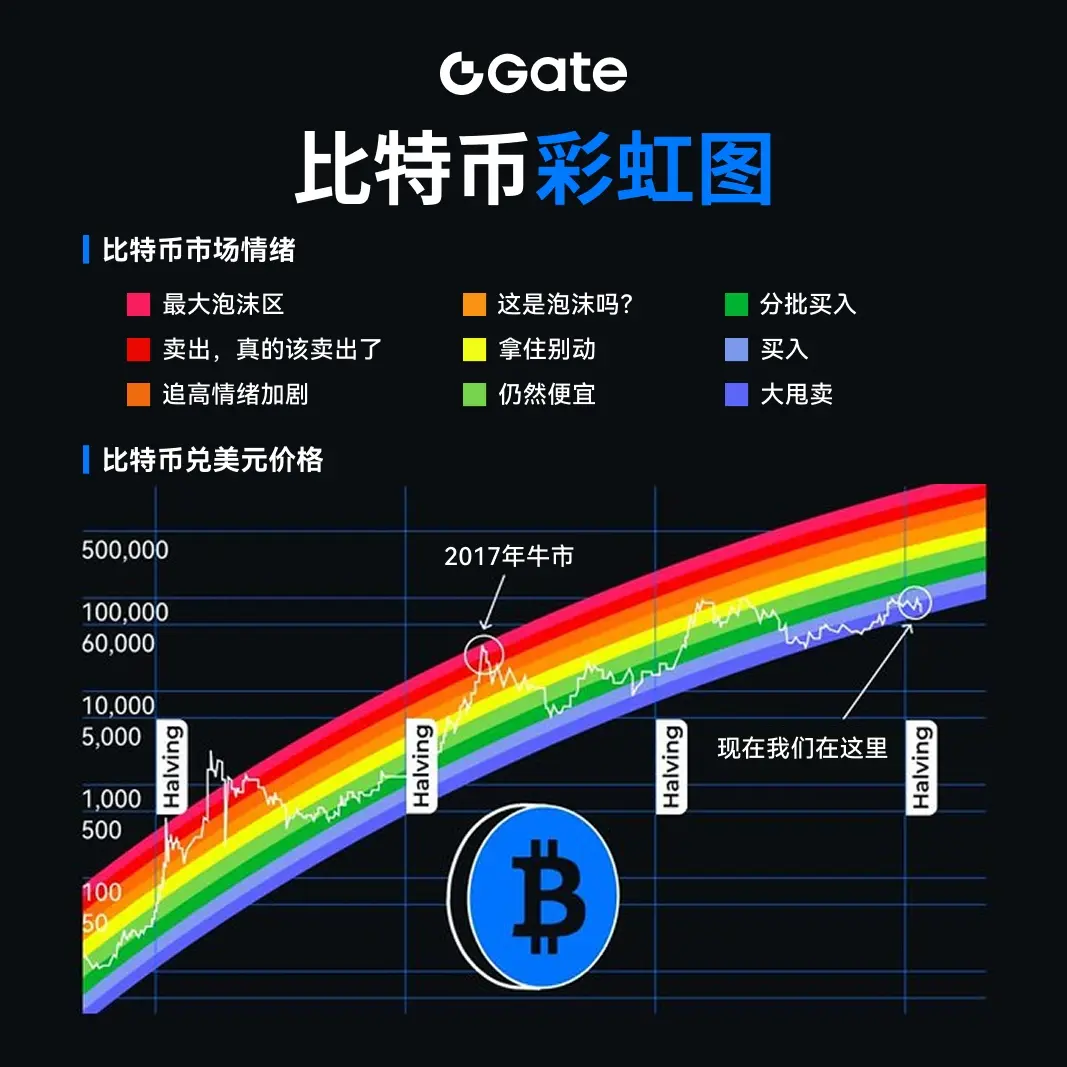
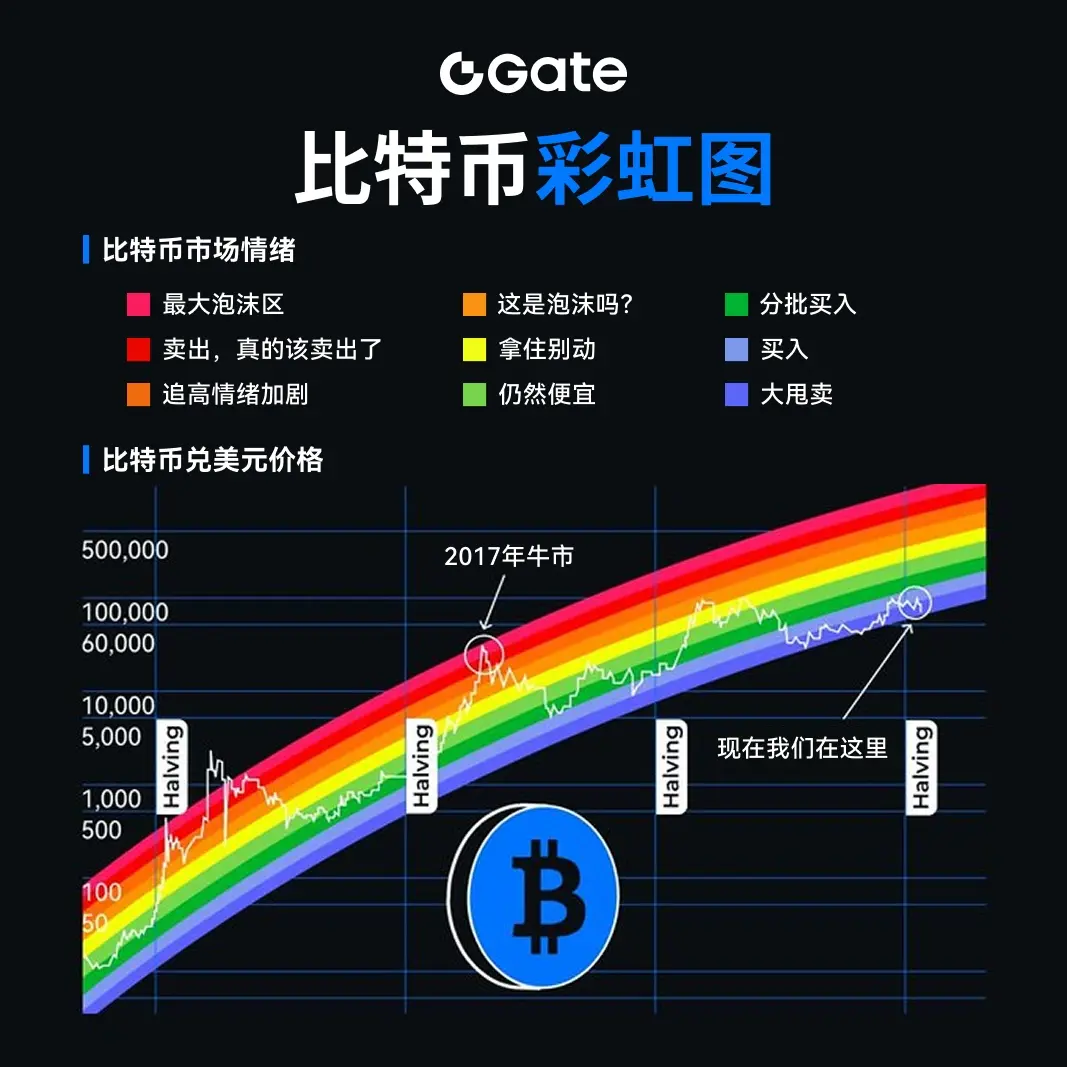
The Bitcoin Rainbow Chart is a tool that displays Bitcoin's long-term price trends and market sentiment through color-coded zones. From blue to red, they correspond to the "buy zone," "hold zone," and "bubble zone." The current price is near the "gradual buy-in" and "still cheap" areas, reflecting a cooler market sentiment. The rainbow chart is not used for short-term timing but is more suitable for helping long-term investors understand the cycle position.
The Bitcoin Rainbow Chart is a tool that displays Bitcoin's long-term price trends and market sentiment through color-coded zones. From blue to red, they correspond to the "buy zone," "hold zone," and "bubble zone." The current price is near the "gradual buy-in" and "still cheap" areas, reflecting a cooler market sentiment. The rainbow chart is not used for short-term timing but is more suitable for helping long-term investors understand the cycle position.