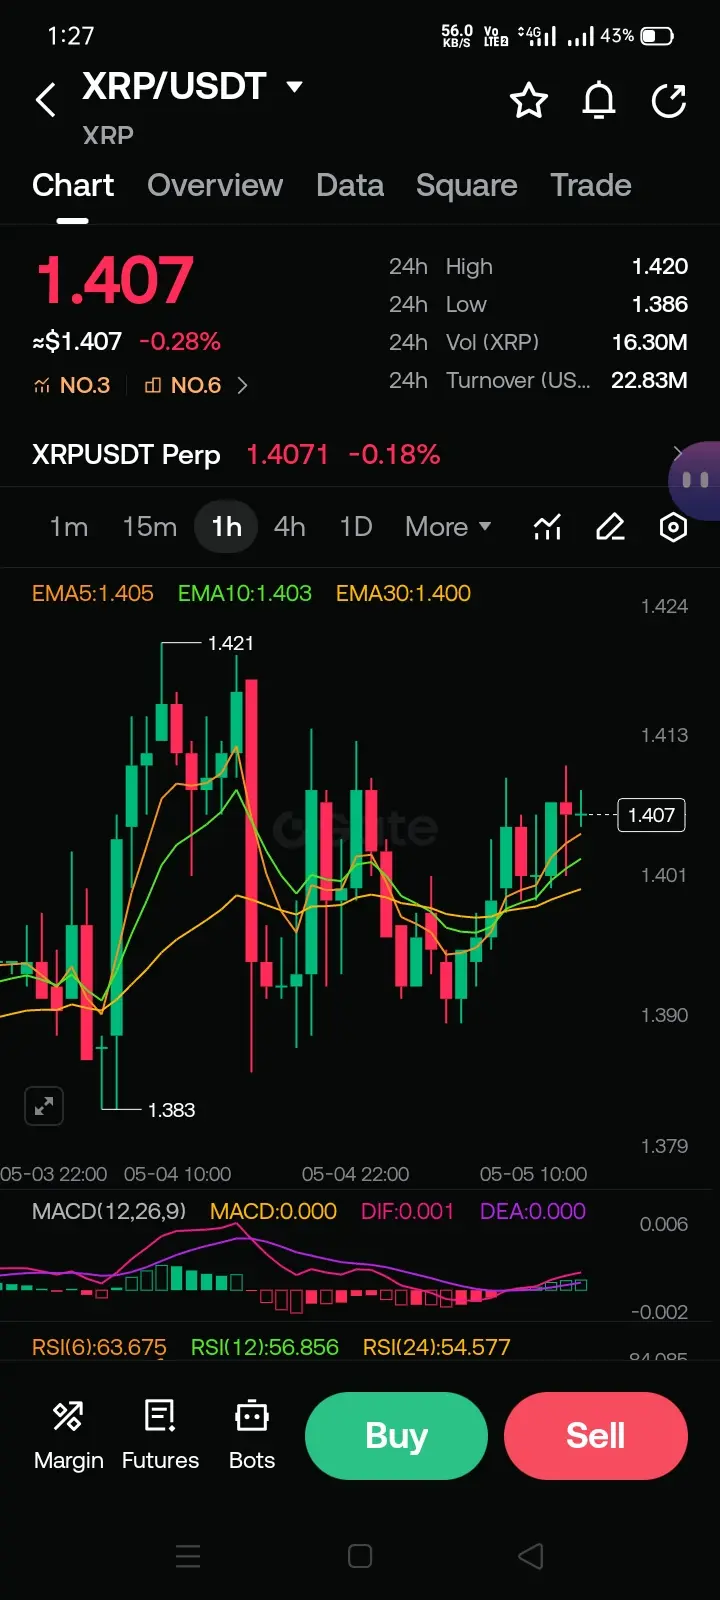
$XRP /USDT Chart Analysis – 1H
Current Price: $1.407
**24h Change:** -0.28%
**24h High/Low:** $1.420 / $1.386
Trend & Moving Averages:
· Price is trading above EMA5 (1.405), EMA10 (1.403), and EMA30 (1.400), indicating short-term bullish momentum.
· The EMA lineup suggests a mild upward slope, but price action remains range-bound.
MACD (12,26,9):
· MACD line is at 0.000, DIF 0.001, DEA 0.000 — essentially flat.
· No clear crossover or strong momentum; consolidation phase.
RSI:
· RSI(6): 63.7 (approaching overbought, but not yet extreme)
· RSI(12): 56.9 (neutral)
· RSI(24): 54.6 (neutral)
· Sh