Futures
Access hundreds of perpetual contracts
TradFi
Gold
One platform for global traditional assets
Options
Hot
Trade European-style vanilla options
Unified Account
Maximize your capital efficiency
Demo Trading
Introduction to Futures Trading
Learn the basics of futures trading
Futures Events
Join events to earn rewards
Demo Trading
Use virtual funds to practice risk-free trading
Launch
CandyDrop
Collect candies to earn airdrops
Launchpool
Quick staking, earn potential new tokens
HODLer Airdrop
Hold GT and get massive airdrops for free
Pre-IPOs
Unlock full access to global stock IPOs
Alpha Points
Trade on-chain assets and earn airdrops
Futures Points
Earn futures points and claim airdrop rewards
Ethereum's three major bullish signals in April: on-chain activity hits new highs, price may be undervalued
In early April 2026, Ethereum exhibited a notable relative strength in the crypto market. Over the past month, ETH’s monthly increase exceeded 12%, outperforming both the overall crypto market and all of the top ten mainstream assets during the same period. The macro environment behind this rally was far from calm—geopolitical conflicts fueled risk aversion and capital reallocation, prompting funds to rotate from Bitcoin-related products into Ethereum-related assets.
More notably, several analysts in the second week of April pointed out three independent but directionally aligned market signals, jointly indicating a key judgment: Ethereum’s current market valuation may not fully reflect its on-chain fundamentals. Leon Waidmann, head of research at Lisk, emphasized that on April 12, the Ethereum mainnet processed 3.62 million transactions in a single day, the first time in its history that daily transaction volume surpassed 3 million. Meanwhile, ETH’s trading price still lagged more than 50% behind its all-time high, creating a clear divergence between on-chain activity and asset valuation.
On-chain transaction volume hits record high, divergence between fundamentals and valuation widens
On April 12, 2026, Ethereum’s daily transaction volume reached 3.62 million, setting a new historical high for the network. This was the first time ETH processed over 3 million transactions in a single day.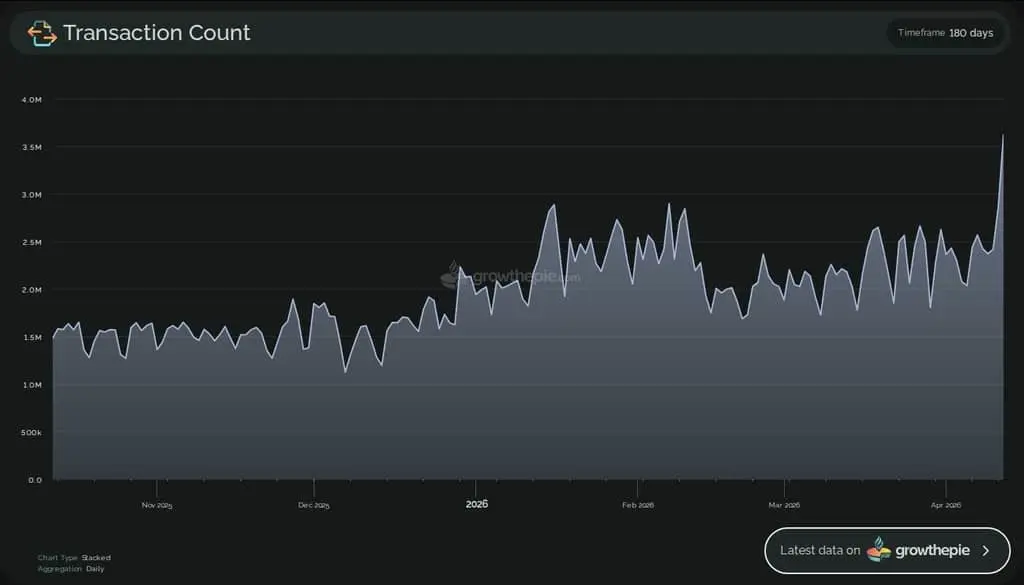 Ethereum transaction activity. Source: X/Leon Waidmann
The significance of this data must be understood within a temporal context. According to Waidmann’s tracking, Ethereum’s daily transaction volume has been steadily rising since November 2025, with the baseline increasing from around 1.5 million to an average of about 2.5 million over the past six months. Around April 10, transaction volume experienced an almost vertical surge from approximately 2.5 million, with weekly growth reaching 41%.
Additionally, in Q1 2026, the network gained approximately 284k new active users, and the total supply of stablecoins issued was at a record high. These data points collectively point to sustained organic growth in Ethereum’s underlying ecosystem.
Data and structural analysis
The table below compares key on-chain metrics of Ethereum with historical benchmarks:
Source: Gate data (as of April 15, 2026), on-chain data from Artemis, Glassnode
It should be noted that the above transaction volume data only accounts for the Ethereum mainnet, excluding off-chain activity on Layer 2 networks. Currently, the Ethereum ecosystem’s mainnet primarily functions as a settlement layer, with much of the transaction execution migrated to Layer 2 solutions. Therefore, the fact that mainnet transaction volume hit a new high is itself noteworthy—it indicates that, even as Layer 2 scaling solutions mature and operate efficiently, the actual usage of the mainnet remains on the rise.
While transaction volume increased by 41%, stablecoin transfer volume decreased by 42.6%, and transaction fees fell by nearly 50%. This suggests that the average economic value per transaction is declining—activity on the network is increasing, but mainly through small-scale, low-value interactions rather than large capital flows. The number of active addresses for USDT and USDC on Ethereum has fallen to the lowest levels since 2026, indicating that capital is in a wait-and-see or idle state rather than being actively deployed into DeFi protocols or trading scenarios.
Everstake, a staking service provider, commented on this phenomenon: “There is a clear divergence: on-chain activity has reached a high, but prices have not fully reflected the fundamentals. Historically, such deviations tend to converge over time. Ethereum is currently on one of its strongest foundations ever—on-chain applications are hitting new highs, the ecosystem is deeply mature, and scaling and technological development are ongoing. Prices usually follow fundamentals, not the other way around. The fundamentals are in place now.”
From a structural perspective, this “high transaction volume, low economic value” characteristic can be understood as the network expanding its user base—more users participating in on-chain activities with lower individual investments, creating a bottom layer of network effects. However, when and how this accumulation translates into asset valuation remains uncertain.
Rainbow chart undervaluation zone and weekly MACD bullish crossover resonate technically
On the technical analysis front, two analysts, from different perspectives—long-term valuation and medium-term momentum—have issued bullish signals that are aligned.
Crypto Patel, referencing the Ethereum rainbow chart—a long-term valuation tool based on logarithmic regression—indicates that ETH is currently in a historically undervalued zone. He straightforwardly states: “The rainbow chart for Ethereum now only delivers one simple signal: the price is undervalued. It’s not ‘consider buying,’ not ‘maybe wait,’ and not ‘hold and pray,’ it’s just cheap.” According to his analysis, ETH has only entered this zone twice before, both times reaching the upper “take profit” zone within 18 months.
Meanwhile, analyst Ash Crypto pointed out that the weekly MACD for ETH has confirmed a bullish golden cross. The MACD indicator tracks medium- to long-term momentum shifts; after the previous two weekly MACD golden crosses, ETH’s price surged by 183% and 75%, respectively. Another analyst, Alicharts, compiled data showing that after the last three weekly MACD golden crosses, ETH’s price increased by 130%, 74%, and 98%.
Data and structural analysis
The table below summarizes the rainbow chart valuation zones and ETH’s current position (based on publicly available models):
Based on the rainbow chart model, ETH is currently in the “accumulation” zone, about 15% above the lower boundary of the “cheap” zone (~$2,681), but well away from the lower “undervalued” and “sell-off” zones.
ETF capital inflows and protocol upgrade acceleration shift macro narrative
Beyond on-chain fundamentals and technical signals, the first half of April also saw two macro narratives of structural significance for Ethereum.
First, there was a clear rotation of funds in the US spot ETF market. On April 13, 2026, the US spot Bitcoin ETF experienced a net outflow of $291 million (FBTC outflow of $229.2 million, ARKB outflow of $62.9 million), while the Ethereum ETF saw a net inflow of $9.5 million. Looking at a longer cycle, in the week ending April 10, ETH ETF weekly inflows surged to $187 million, reversing the previous three weeks of net outflows totaling about $308 million, marking the strongest weekly inflow since 2026. The total cumulative inflow reached a record $11.68 billion.
Second, the pace of Ethereum protocol upgrades is accelerating. After successful hard forks in 2025 (Pectra and Fusaka), 2026 plans include two named upgrades: Glamsterdam and Hegotá. The upgrade cadence has shifted from “once a year” to “twice every six months.” Glamsterdam will introduce parallel transaction processing, with the gas limit planned to increase from 60 million to 200 million, and gas fees are expected to decrease by approximately 78.6% after re-pricing.
Data and structural analysis
The table below summarizes recent two-week fund flows into Ethereum ETFs:
Source: SoSoValue, Farside Investors
In terms of price performance, ETH has risen about 8% in the past 24 hours, outperforming Bitcoin’s roughly 5%; over the past week, ETH outperformed by about 4 percentage points, and over the past month, by about 9 percentage points. This synchronicity differs from the previous common pattern driven by a single factor—ETF fund flows, spot prices, and on-chain activity moving in the same direction for the first time in months.
The shift of ETF funds from Bitcoin to Ethereum reflects a strategic asset reallocation by institutional investors. Funds are not leaving the crypto market but reallocating within it—despite significant outflows from Bitcoin ETFs, its price has not collapsed, indicating some capital has flowed into ETH-related products. Whether this momentum continues depends on whether ETH ETFs can maintain stable inflows and whether Bitcoin’s holdings can gradually absorb outflows without drastic adjustments.
The divergence between 41% growth in transaction volume and 42.6% decline in stablecoin transfer volume suggests that the increase in on-chain activity is mainly driven by low-value transactions. If this trend persists and high-value economic activity does not pick up, Ethereum’s economic throughput (measured via stablecoin transfer volume as a proxy) could face ongoing contraction. The “Stablecoin Summer” of 2025, when USDC and USDT transfer volumes surged, pushed Ethereum’s throughput to new highs and supported ETH’s rise toward $4,000. The current signals are opposite; whether this gap can be narrowed is key to turning the recent capital rotation from a short-term spike into a lasting trend.
Multi-scenario evolution: how will divergence converge?
Based on the above three dimensions, three possible scenarios are constructed. It’s important to clarify that these are speculative and do not constitute price predictions.
Scenario 1: Convergence of fundamentals
Sustained high on-chain activity, stablecoin transfer volume rebounding, and ETF inflows creating positive resonance. The Glamsterdam upgrade proceeds as planned, with lower gas fees enhancing synergy between Layer 2 and mainnet, attracting more users and applications. In this scenario, the divergence between on-chain fundamentals and market valuation narrows, validating the “price follows fundamentals” logic.
Scenario 2: Divergence persists
On-chain transaction volume remains high, but stablecoin transfer volume stays low, further diluting economic value per transaction. Overbought signals in technical indicators and macro risk aversion offset each other; ETF inflows become intermittent. In this case, Ethereum’s “high activity, low value” characteristic continues to be priced in, prolonging the convergence process. Growth reflects more user base expansion rather than increased capital contribution per user.
Scenario 3: Macro shocks
If geopolitical conflicts escalate further or global liquidity tightens, overall risk appetite in markets will decline. ETF inflows into Ethereum may turn into outflows again, technical signals could fail, and on-chain activity may contract. In this scenario, the rainbow chart’s accumulation zone might not be a bottom, and prices could further decline to new support levels. Past summer’s experience shows that a rebound in on-chain throughput (via stablecoin transfers) is necessary for sustained price increases; if this metric does not improve, any technical rebound may lack durability.
All three scenarios depend on external macro conditions and actual on-chain economic developments. Ethereum’s fundamentals are indeed among the strongest in history, but the translation from fundamentals to price takes time and catalysts. Technical resonance and ETF fund flows serve as short-term catalysts, while ongoing protocol upgrades provide medium- to long-term narrative support.
Conclusion
Ethereum faces three major bullish signals in April—record-high on-chain transaction volume, entry into the accumulation zone on the rainbow chart, and weekly MACD bullish crossover—all pointing to a common conclusion: there is a significant divergence between ETH’s current market valuation and its on-chain fundamentals.
Whether this divergence indicates undervaluation, and when it will be corrected by the market, depends on multiple variables. Can high on-chain activity translate into higher-value transactions? Is the ETF fund rotation a short-term phenomenon or a trend? Will protocol upgrades be delivered as scheduled and enhance network capacity? These questions will become clearer in Q2.
For participants focused on Ethereum, the key value at this moment is not a specific price judgment but understanding the structural relationships among on-chain data, technical indicators, and macro capital flows—and how these relationships might evolve under different scenarios.