Share crypto content and earn up to 60% commissions through content mining.
placeholder
gatefun

Still grinding a few days ago—today I just give you the answer directly! 📉🚀 When it was grinding up to the highs during the day, a lot of people still thought it would break out. I was more cautious instead, because the pump had no volume, and the follow-through/absorption looked weak. The more I watched, the more it looked like a fake breakout meant to lure longs. $SUI In my last glance before bed, $BTC was giving a long setup around 1.0045. The logic is simple: there’s clear overhead resistance, the rebound strength isn’t enough, and once the price goes up, nobody’s there to take it 📌👀
SUI-1.16%
BTC-0.39%
ETH-0.28%
View Original
post-image
  • Reward
  • Comment
  • Repost
  • Share
This round is a classic pattern of first scaring people, then pumping the market. After that initial pullback and retest in $IO , many thought it was going to break down—but the long positions held from 0.16220 to 0.16536. Now it’s up 138.33%, and the chart directly flushed out the panic sellers.
What really caught my attention is that after the drop, it didn’t continue to sell off with heavy volume. Instead, it quickly recovered, which suggests there are buyers underneath. Most people, seeing a sharp drop, only think about running—but trading can’t just look at the surface. After sweeping one
IO-3.78%
BTC-0.39%
ETH-0.28%
View Original
post-image
  • Reward
  • Comment
  • Repost
  • Share
Kept churning a few days ago, and today I’m directly giving the answer! 🔥📉 For the last look before bed at $BSB —after it spiked higher, it was clearly not being picked up by anyone. The bounce looked very weak. I was watching the high and holding pressure, not getting carried away by what’s on the chart 👀
What I saw was a price surge on low volume. I judged this looks more like a liquidity grab, not a place to chase. So I gave the $BSB guidance to follow a long (buy) rhythm. The short position reference was 0.60958; now it has already moved to 0.14864, with a return rate of +1489.29%. If yo
BSB0.69%
BTC-0.39%
ETH-0.28%
View Original
post-image
  • Reward
  • Comment
  • Repost
  • Share
This price action is really a bit outrageous! 🚨📉 A few days ago in the afternoon $MYX it was still ranging at a high level, trying to look bullish and strong. A lot of people saw it and wanted to chase, but what I saw was that the volume didn’t keep up and the overhead resistance was obvious—once you push it, it just loses steam 👀
While everyone is still watching, I handled it straight with the short-side rhythm: opening a long position at a reference of 0.2225. Now the price is at 0.0761, and the return is +1295.55%—those who are on the bus should have all woken up laughing ✅🔥💰
When it’
MYX0.13%
BTC-0.39%
ETH-0.28%
View Original
post-image
  • Reward
  • Comment
  • Repost
  • Share
Don’t sleep! This market directly yanks people awake out of their dreams 📢. A few days ago, my last look before bed was still grinding sideways; today $AAVE instantly showed its stance—nothing sloppy or dragging on the chart 🚀

When the chart wasn’t fully live yet, I was watching whether AAVE’s pullback broke or whether buyers were picking up below. Price kept testing around 88.25, and then the key level held firm. Bids started taking the initiative—at that spot, I prompted to open a long 👀

When it’s time to eat meat, don’t pretend to be calm.
If you understand it, execute—don’t hesitat
AAVE3.63%
BTC-0.39%
ETH-0.28%
View Original
post-image
  • Reward
  • Comment
  • Repost
  • Share
Is the ZEC long side still celebrating? On the 4-hour chart, the short side has already laid its traps.
$ZEC /USDT - go SHORT
Trading plan:
Entry: 520.93 – 524.55
SL: 545.31
TP1: 505.82
TP2: 494.53
TP3: 477.61
Why focus on this structure?
- The daily chart is still tilted bullish, but the 4-hour timeframe gives an 84% short signal, with an attractive risk-reward ratio.
- Current price is 522.74, closely touching the 1-hour EMA. RSI on the 15-minute chart is only 62.47—no overbought, but momentum is fading.
- Why now? The entry zone of 520.93-524.55 has been confirmed. TP1 is at 505.82; the sto
ZEC2.82%
View Original
post-image
post-image
  • Reward
  • Comment
  • Repost
  • Share
you were not too much.
you were too much
for people
who were too little.
there is a difference.
and one day
someone will need
exactly the ocean
you were told
to shrink. 🌹
post-image
  • Reward
  • Comment
  • Repost
  • Share
Guys, who understands this! I opened the chart this morning and instantly felt energized 🚀. A few days ago I was still grinding it before bed. $SKHYNIX kept refusing to give a clean move, but the key level just didn’t break. At the same time, selling pressure clearly eased, and I pointed out then that you can watch for the long momentum and catch it.

After entering from 1409.2 during the session, it was indeed grindy in the beginning. But now it’s tapped 1514.8, with gains of +184.06%. This piece of profit is so comfortable to eat ✅🔥

That’s the rhythm.
Don’t be afraid of it grinding—be
SKHYNIX0.15%
BTC-0.39%
ETH-0.28%
View Original
post-image
  • Reward
  • Comment
  • Repost
  • Share
DOGE 4-hour shorts have been 95% confirmed—what are you waiting for?

$DOGE /USDT - SHORT the sell

Trading plan:
Entry: 0.07447 – 0.07467
SL: 0.07553
TP1: 0.07385
TP2: 0.07336
TP3: 0.07264

Why focus on this structure?
- Current price 0.07457, 15-minute RSI is only 32.84—oversold, but the trend is still bearish.
- 1-day trend is clearly bearish; 1-hour ATR is only 0.000402, with volatility under control.
- Target TP1 0.07385, TP2 0.07336, SL set at 0.07553, risk-reward ratio > 1:2.
- Why now? Multi-timeframe confluence + high confidence; short-term rebound lacks strength.

Discussion:
Wil
DOGE-1.62%
View Original
post-image
post-image
  • Reward
  • Comment
  • Repost
  • Share
It exploded! After this drop, the chart just doesn’t pretend anymore 📉🚨
A few days ago, when I was watching $KAS at around midnight, the price was still stuck in the high range, hovering back and forth. A lot of people thought it could still be pushed higher. What I saw, though, was an attempt to surge with no volume, weak follow-through on support, and it got suppressed—once it touched, it turned soft immediately.

Before the chart had fully kicked off, I judged this move more like a pullback window after a bull trap. Back then, I followed a short-side rhythm and entered a long around 0.0
KAS-1.55%
BTC-0.39%
ETH-0.28%
View Original
post-image
  • Reward
  • Comment
  • Repost
  • Share
SOL shorts are set up—can this move reach TP3?
$SOL /USDT - SHORT
Trading plan:
Entry: 77.78 – 77.98
SL: 78.88
TP1: 77.13
TP2: 76.64
TP3: 75.89
Why focus on this setup?
- 4H-level bearish signals confirmed; RSI on 15m is only 40.45, and momentum is weak.
- Entry 77.88, TP1 77.13, TP2 76.64, TP3 75.89, stop loss 78.88.
- Why now? Within the 1D ranging range, the probability of downside is 55%, and ATR is low volatility—suitable for a quick scalp.
Discussion:
Before TP2, would you add to your position, or wait for a pullback to short?
SOL-1.86%
View Original
post-image
post-image
  • Reward
  • Comment
  • Repost
  • Share
This price action is a bit ridiculous! 🔥 A few days ago, around the early morning, it looked like it was about to surge upward, but every time it tried to push up it had no volume. $NEAR The upside is clearly being suppressed at the high level—I immediately felt something was off.
When it was stalling at the top during the session, what I saw was insufficient follow-through, weak rebounds, and the strong “bull trap” vibe. So I advised not to catch the last baton—going long would be more suitable. Refer to entry at 2.8821; now it’s 1.8668. +2499.6% has already been realized, so it wasn’t in v
NEAR-0.78%
BTC-0.39%
ETH-0.28%
View Original
post-image
  • Reward
  • Comment
  • Repost
  • Share
Don’t say that—this round really gives face.😎 This morning when I opened the chart, $EDGEX had already been pressed down from the highs. A few days ago, what I was watching before bed was exactly that kind of unlimited-style rally—looked ferocious when it went up, but nobody was really taking the other side.
Before the chart fully kicked off, I reminded everyone not to get carried away by fake breakouts. Around the resistance level is more suitable for looking short. For going long, refer to 0.6386. Now it has hit 0.3679—+2045.92%. It’s directly cashed in. The earlier period was real grindin
EDGEX-8.93%
BTC-0.39%
ETH-0.28%
View Original
post-image
  • Reward
  • Comment
  • Repost
  • Share
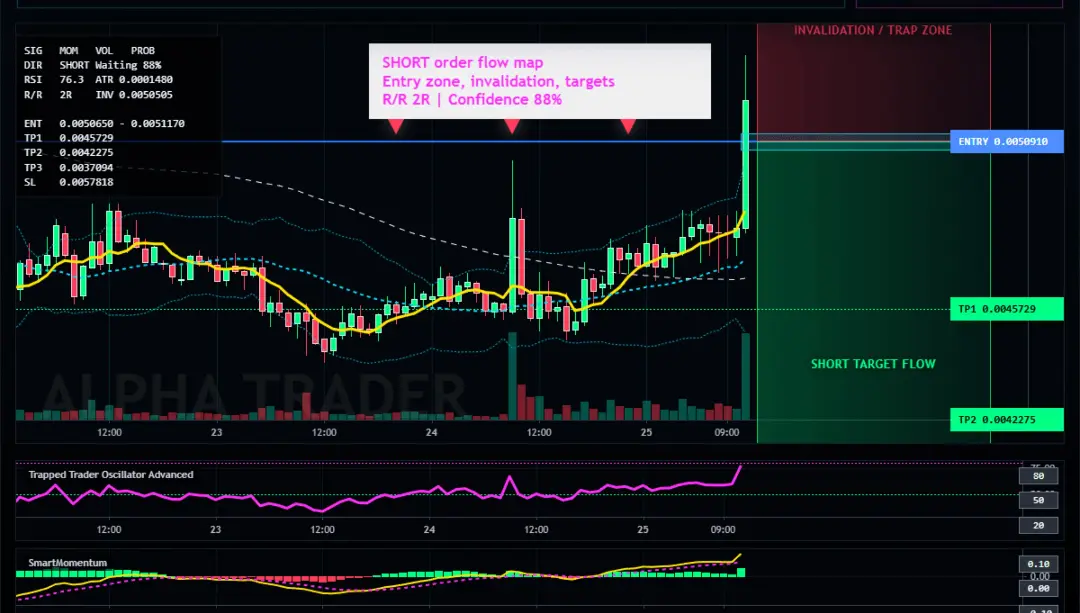
SUI shorts with a 95% win rate—are you still going long?
$SUI /USDT - SHORT
Trading plan:
Entry: 0.7397 – 0.7425
SL: 0.7541
TP1: 0.7314
TP2: 0.7249
TP3: 0.7152
Why pay attention to this setup?
• The 4-hour timeframe trend is clearly bearish; RSI on the 15-minute is only 37.31, and the rebound has no strength• Entry range 0.7397-0.7425, TP1=0.7314, TP2=0.7249• Why now? EMA resistance + bearish momentum remains strong; a break below 0.7382 confirms acceleration
Discussion:
Will this move reach TP2 first, or will it be a stop-hunt rebound before another drop?
SUI-1.16%
View Original
post-image
post-image
  • Reward
  • Comment
  • Repost
  • Share
Layout Bitcoin, Ethereum, Dogecoin
gate liveLIVE
2,464
  • Reward
  • 7
  • Repost
  • Share
SilencerYz:
Football is more than just 90 minutes—it's passion, unforgettable moments, and the dream of seeing your favorite team become champions. Every match brings new excitement, stunning goals, and memories that unite fans around the world.
View More
[New Streamer] Marjet Prediction
gate liveLIVE
40
  • Reward
  • Comment
  • Repost
  • Share
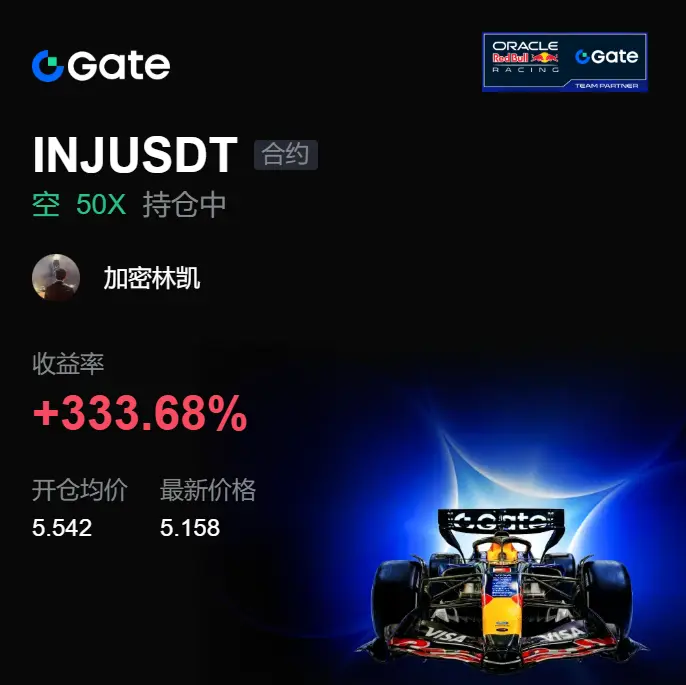
This sudden sell-off feels really satisfying—after that grindy, frustrating sideways consolidation up front, it finally gave direction. The $NEAR short entry price is 2.5382; now the price is at 1.898, and +1789.4% is already out. Once the room for volatility opens up, the experience of holding the position is completely different.
At the start, many people thought it was just a normal pullback, and they were still waiting for a rebound to keep pushing higher. But I was watching the reaction after pressure built at the high— the more it shook, the weaker it became. Every rebound had less and l
NEAR-0.78%
BTC-0.39%
ETH-0.28%
View Original
post-image
  • Reward
  • Comment
  • Repost
  • Share
Honestly, this chart really knows how to mess with people. 👀🚨 While everyone is still watching, $PEPE it looks like it’s about to push higher—but the sell pressure above is obvious. The rebound is weak; when it tries to go up, there’s nobody to take it. I told everyone at the time to prioritize the short idea first—don’t get thrown off by a short-term surge.
Built from 0.000003779, and now at 0.000002707, +2012.81%—I’ve already got it in hand. No wasted wait—📉✅ this kind of market is afraid that once you understand it, you won’t dare to act, and if you do, you won’t be able to hold.
That’s
PEPE-2.74%
BTC-0.39%
ETH-0.28%
View Original
post-image
  • Reward
  • Comment
  • Repost
  • Share
Norway is indeed strong, but England isn’t too bad either…
But for the next Argentina match, I really wouldn’t dare to touch it—Argentina is toxic right now…
View Original
  • Reward
  • Comment
  • Repost
  • Share
Load More

Join 40 M users in our growing community

⚡️ Join 40 M users in the crypto craze discussion
💬 Engage with your favorite top creators
👍 See what interests you
  • Pinned