Share crypto content and earn up to 60% commissions through content mining.
placeholder
gatefun
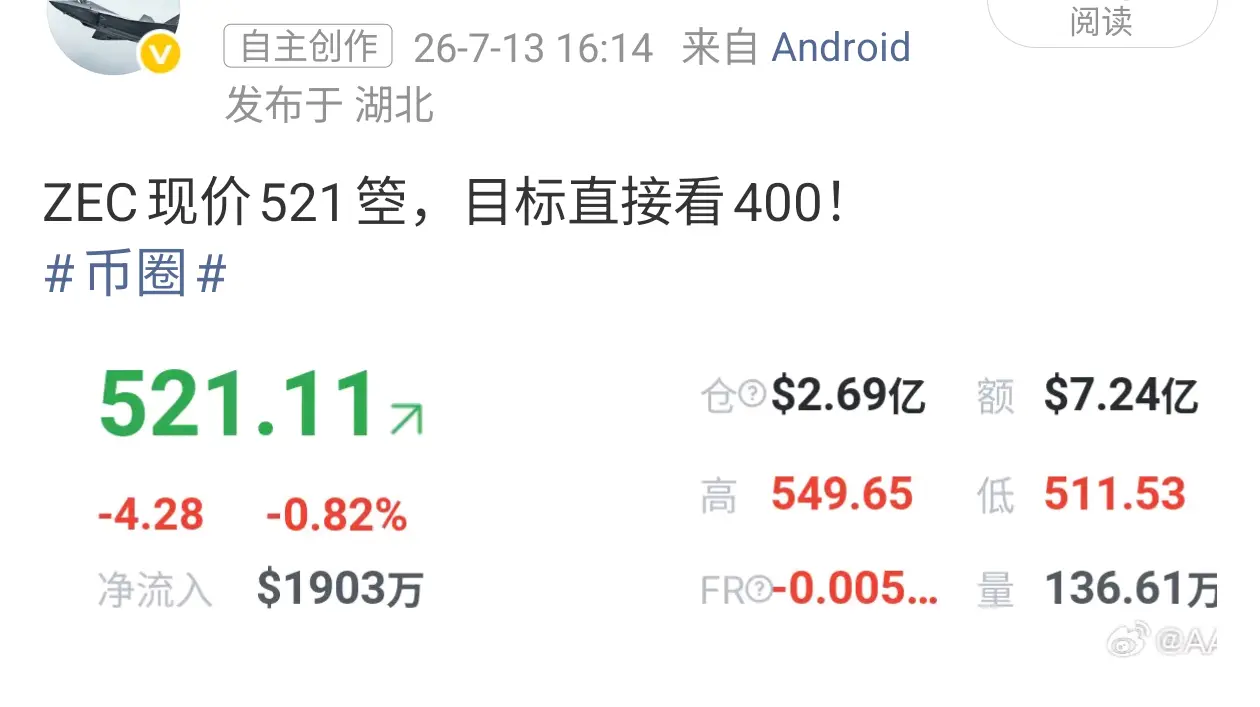
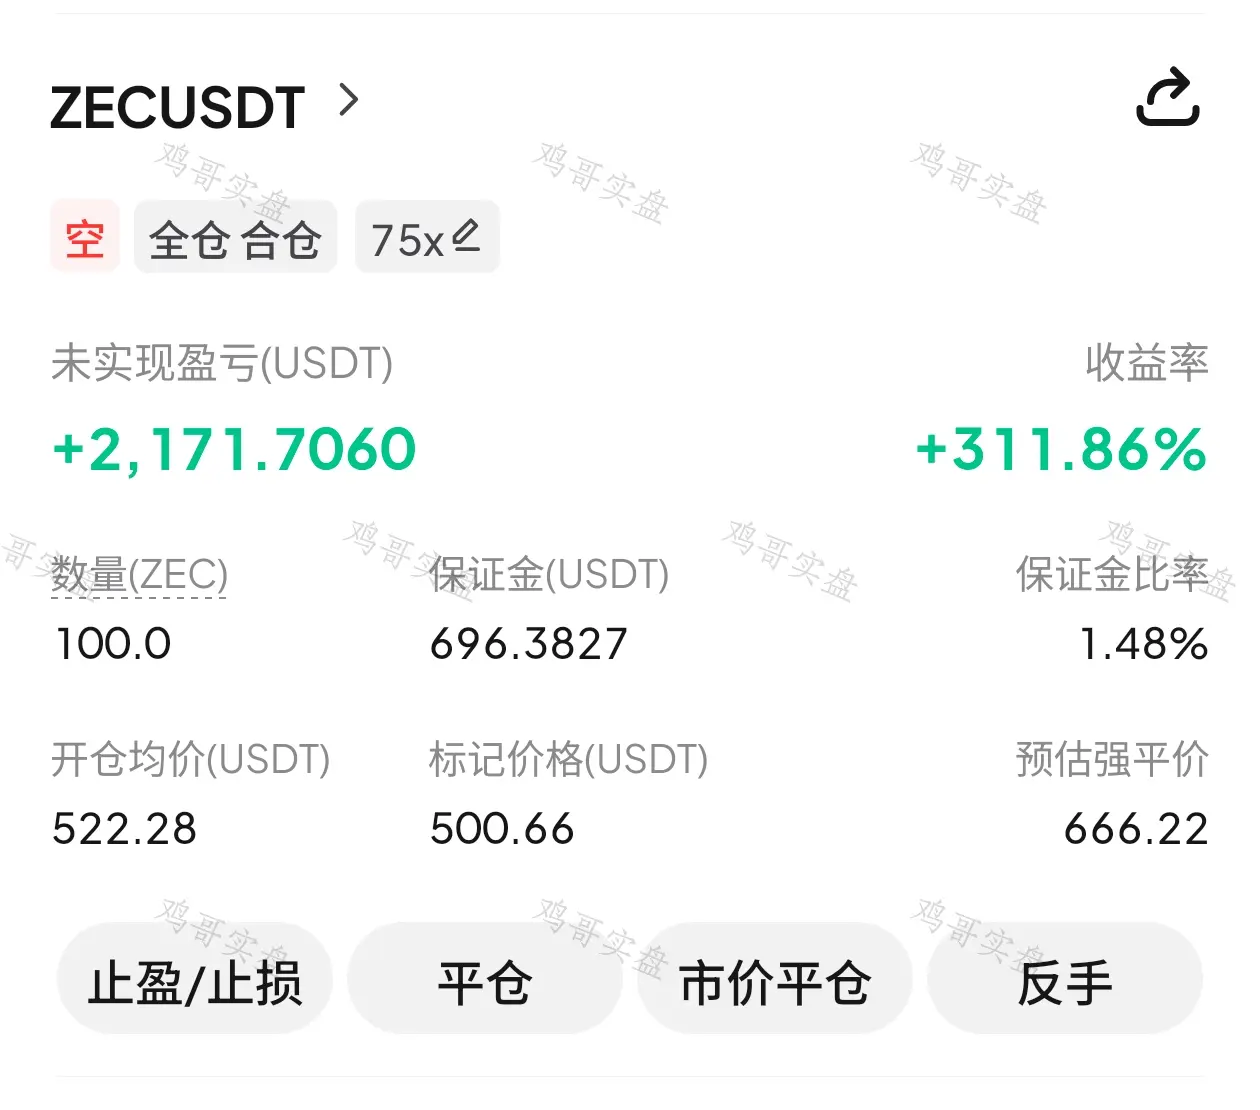
$ZEC Lowest 490! The short position is still being held. If it breaks below 500, won’t 400 be far off?
$HYPE $LAB #伊朗宣布关闭霍尔木兹海峡 #GateUS合规扩展佛罗里达
ZEC-4.29%
HYPE-6.11%
LAB-36.78%
View Original
post-image
post-image
  • Reward
  • 3
  • Repost
  • Share
Paper-CutOctopusMarketAnalysis:
Breaking below the 500 psychological level is definitely interesting, but if the situation involving the Strait of Hormuz really gets underway, crypto market volatility could be far more provocative than ZEC’s technical levels.
View More
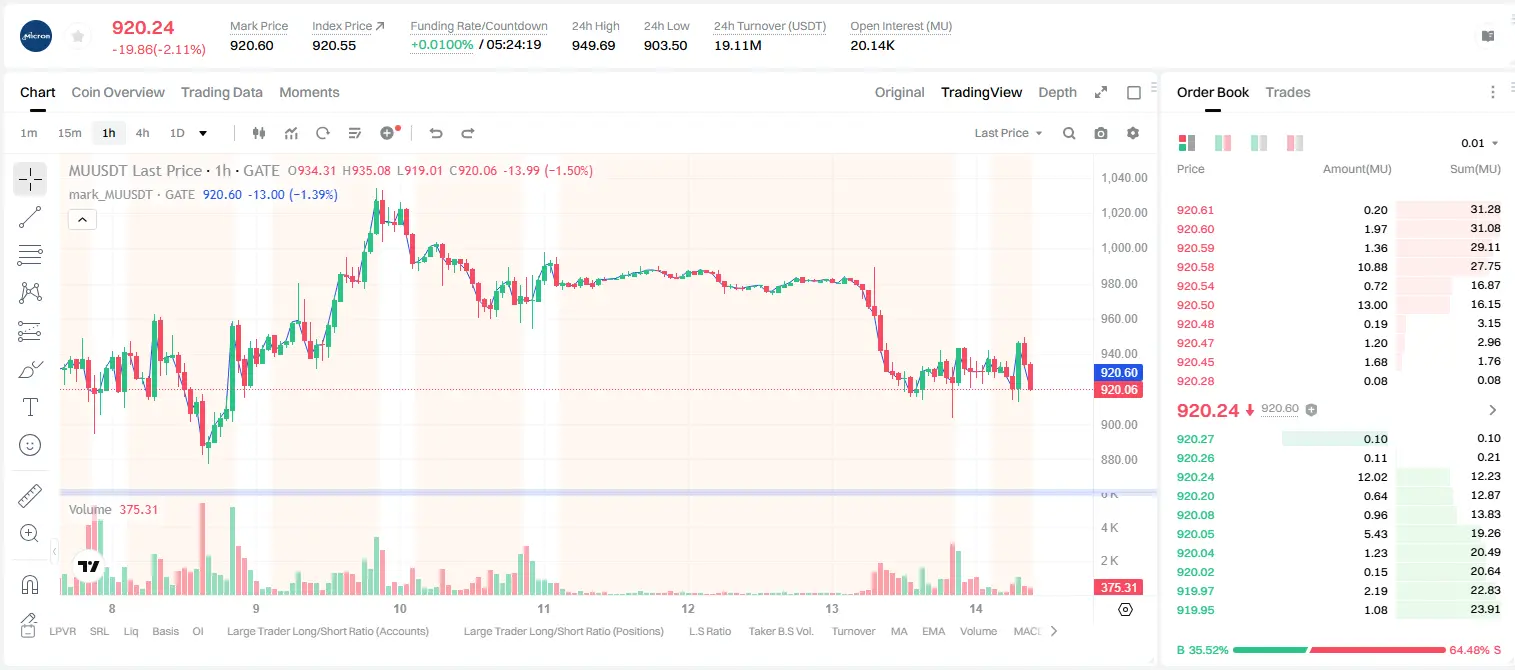
$MU /USDT 4-hour timeframe bearish signal has been activated—what are you waiting for?

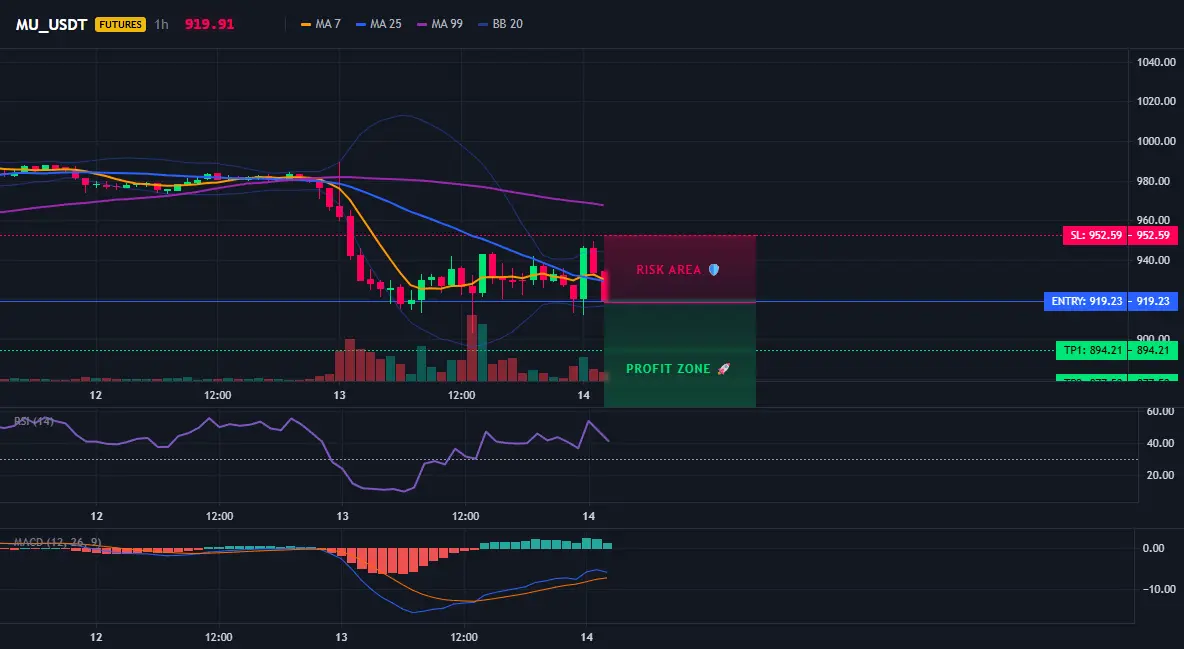
$MU /USDT - SHORT sell

Trading plan:
Entry: 915.75 – 922.71
SL: 952.59
TP1: 894.21
TP2: 877.53
TP3: 852.50

Why focus on this structure?
- 15-minute RSI is only 39.05; bearish momentum has not fully faded.
- With 4-hour EMA resistance overhead, the trend is bearish, and today’s direction is clear.
- Entry reference is 919.23, TP1 894.21, TP2 877.53, SL 952.59.
- Why now? Low RSI + bearish structure—your short-term opportunity window is open.

Discussion:
Will this move reach TP2 first, or is it a bull
MU-1.29%
View Original
post-image
post-image
  • Reward
  • Comment
  • Repost
  • Share
  • Reward
  • Comment
  • Repost
  • Share
$BILL Long signal | Funding rate anomaly + buy-side depth support
$BILL The funding rate spiked to 0.0191%. Long positions’ average cost is relatively high, but depth data Bid/Ask 1.16 shows proactive buy-side support. A 1H MACD dead cross appeared, yet the price has not effectively broken below the EMA20. After 0.0584 support was repeatedly tested, it rebounded. The 4H Bollinger upper band at 0.0626 is suppressing price; the band is in a narrowing state, indicating a turnaround window. This kind of divergence between funding rate and the order book usually signals a short-term short squeeze
BILL9.46%
BTC-0.99%
ETH-0.87%
SOL-1.72%
View Original
  • Reward
  • Comment
  • Repost
  • Share
FTX/Alameda transfers 201,000 SOL! Worth $15.14 million—what signal does this move send?
gate liveLIVE
948
live-coin
  • Reward
  • Comment
  • Repost
  • Share
Wall Street enters earnings week! Will crypto follow sentiment?
gate liveLIVE
625
live-coin
  • Reward
  • Comment
  • Repost
  • Share
Gate Leverage Worry-Free exclusive benefits are in full swing
🔥 Get $50 when you meet the requirements for your first order
🎁 New user bonus: For your first single subscription, deposit $50 or more to receive a $50 trial bonus
📈 Advanced challenge: Unlock up to $1,050 in trial bonuses with the highest cumulative subscriptions
🛡️ Worry-free protection: Trial bonus profits can be withdrawn; losses are covered by the platform
The promotion runs until July 20—click to join now 👇https://www.gate.com/campaigns/5478
View Original
post-image
  • Reward
  • Comment
  • Repost
  • Share
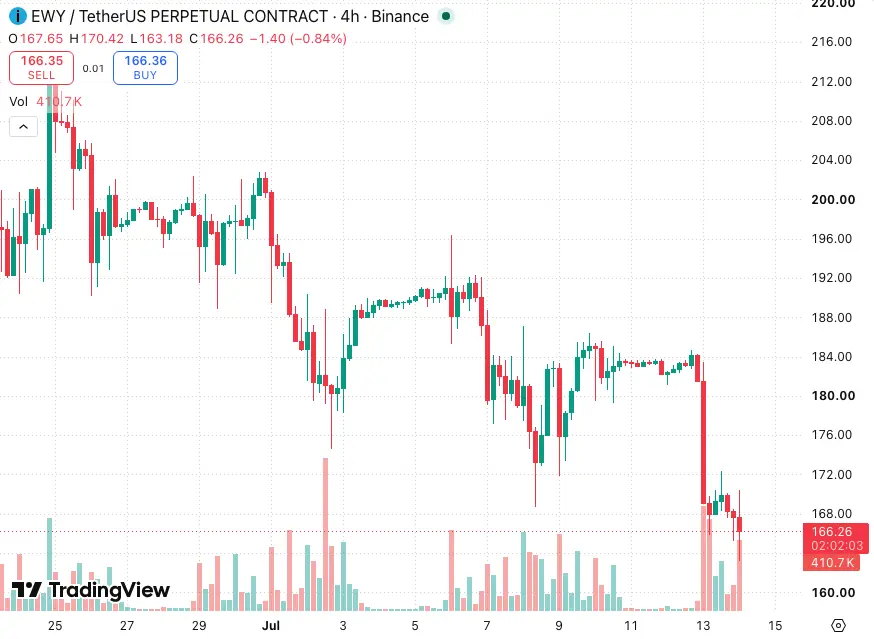
$EWY I think it’s possible to take a short-term bet on a rebound. Right now, the price is bouncing up from the bottom—before the bears come back out, grab a round of relief trading. The entry range is 165.88-167.89; on the upside, watch 174.34 and 180.30. If it breaks below 160.9, back off.
But to be clear, this is just a contrarian short-term trade; the bigger picture is still very bearish. Don’t take it as a trend signal.
Manage your position yourself—never go all in. You’re responsible for the risk.
EWY-5.47%
View Original
post-image
  • Reward
  • Comment
  • Repost
  • Share
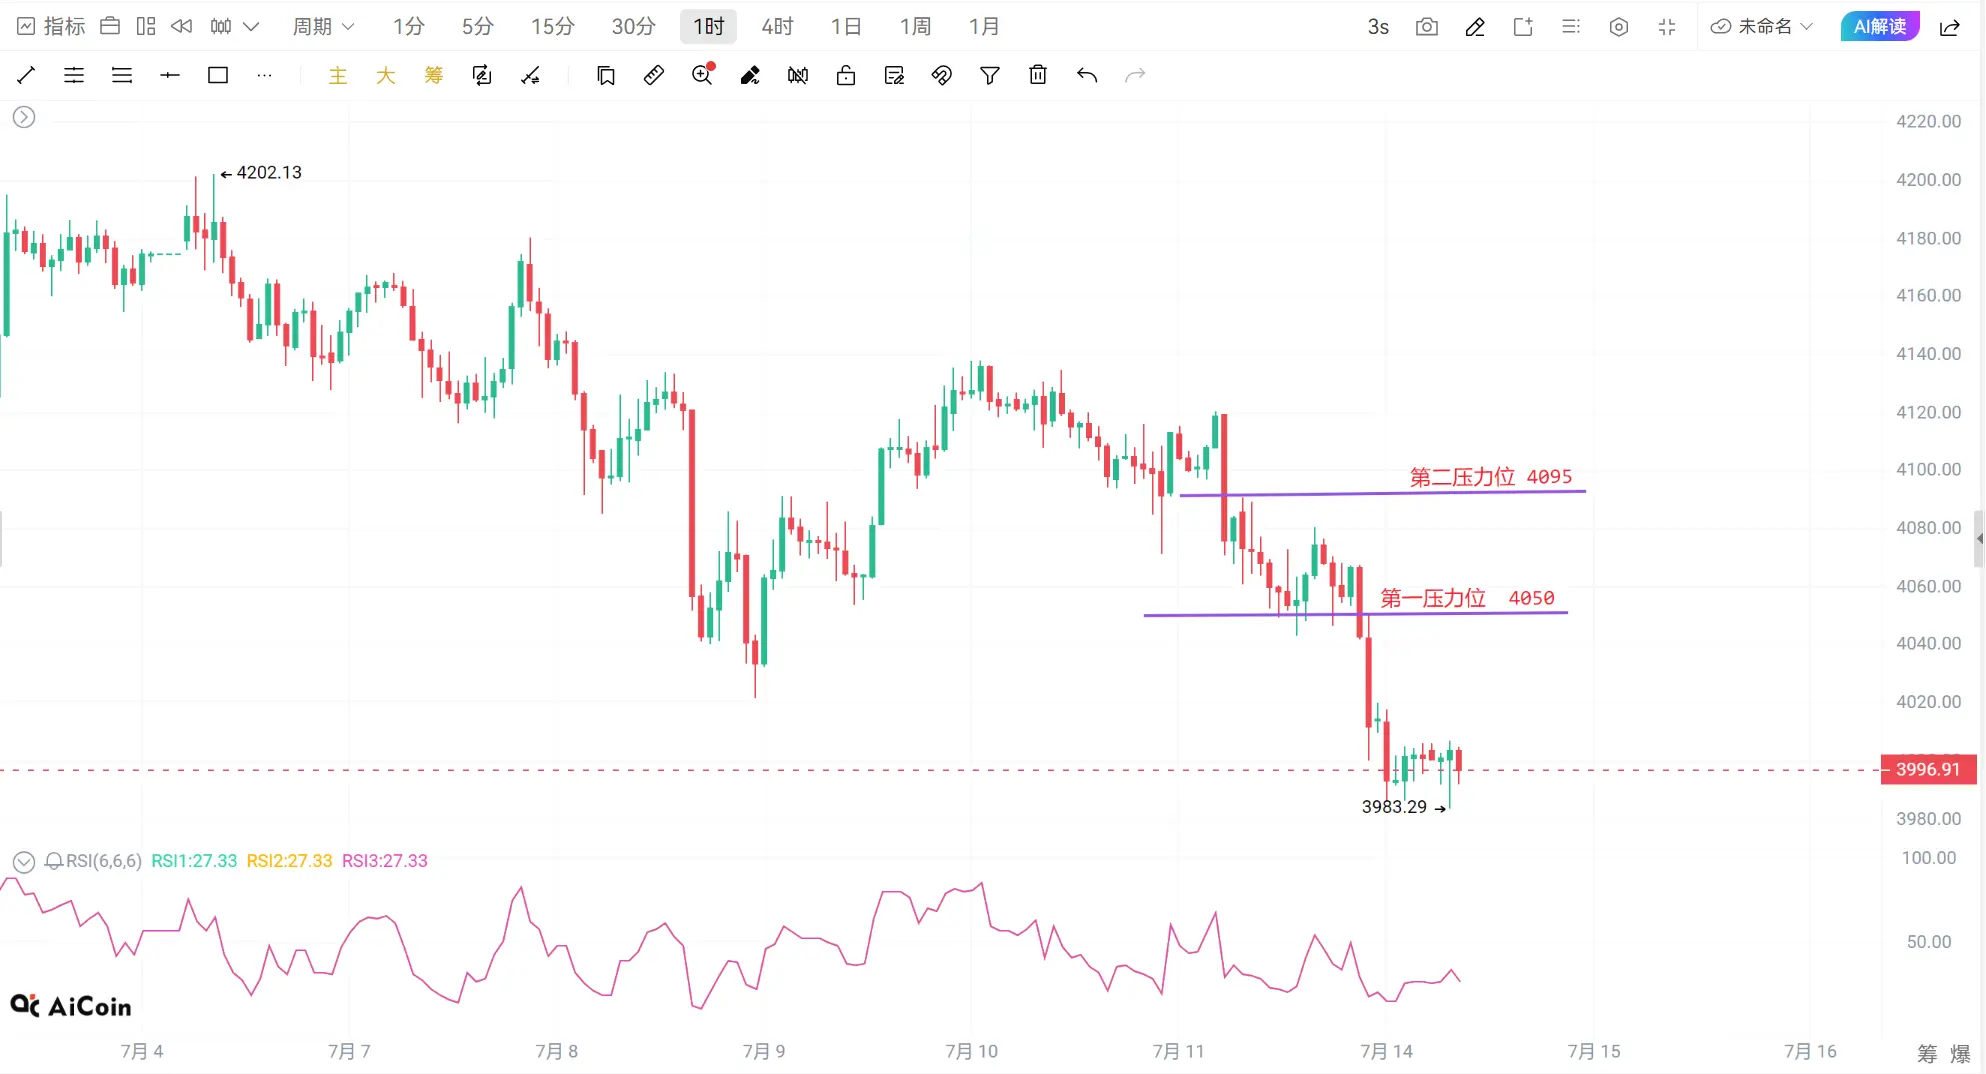
July 14, 2026 market analysis:
XAU: Yesterday morning, went short at 4085, took profit at 4060. In the evening, went long by averaging in around 50, and stopped out at 40. Two trades yesterday: 1 win and 1 loss, netting a profit of 15 points.
It was indeed a bit reckless that I picked up longs in the morning yesterday. Usually, Monday continues Friday’s trend. Once the Asian session starts, the price drops sharply. After a sharp drop, the market is actually not suitable for going long, because there can be a second or even third small dip to release energy. The correct approach should be to fo
ETH-0.86%
XAUT-0.99%
View Original
post-image
post-image
  • Reward
  • Comment
  • Repost
  • Share
AI is making knowledge, skills, and expertise increasingly cheap.
When everyone can access civilization-level capabilities, what’s truly scarce is no longer ability, but judgment.
In the AI era, it’s not about who is smarter, but who is better at making judgments, making decisions, and becoming the “director.”
#AI时代 #Judgment #认知提升 #David Investment Memo
View Original
  • Reward
  • Comment
  • Repost
  • Share
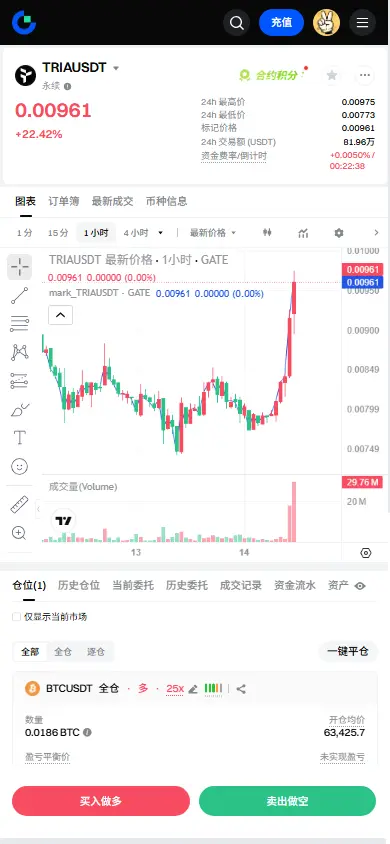
$TRIA Signal】Go long | 1H breaks above the Bollinger Band + huge capital pushes up
$TRIA On the 1H timeframe, RSI surged to 75.47; the MACD histogram columns continue to expand in volume. Price directly pierced the upper Bollinger Band at 0.0091 and is currently trading at 0.00964. The buy-side order book depth share is 1.87%, Bid/Ask is 1.04, and there is a clear intent of capital support—sell pressure is being quickly absorbed. Although the 4H MACD is still in negative territory, the histogram has turned positive; the Bollinger midline at 0.0085 forms medium-term support. The long-side offe
TRIA20.41%
BTC-0.99%
ETH-0.87%
SOL-1.72%
View Original
post-image
  • Reward
  • Comment
  • Repost
  • Share
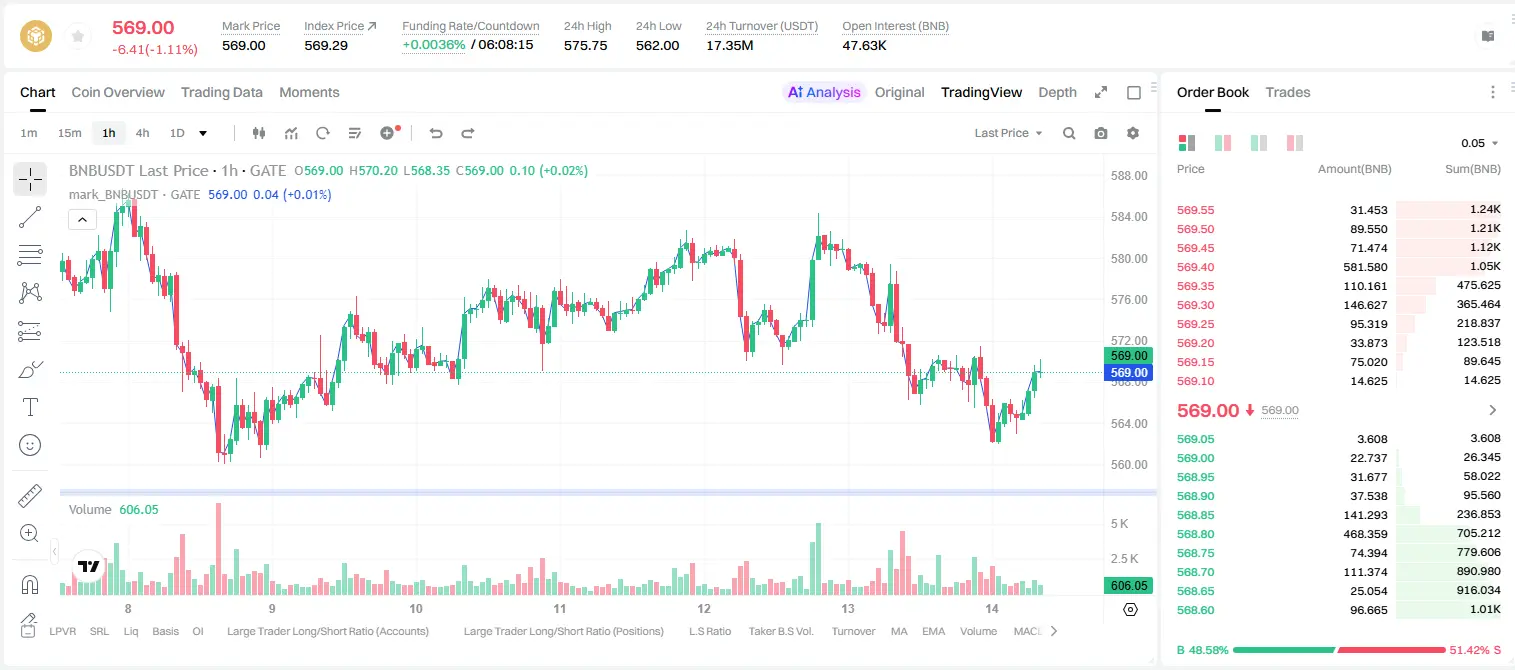
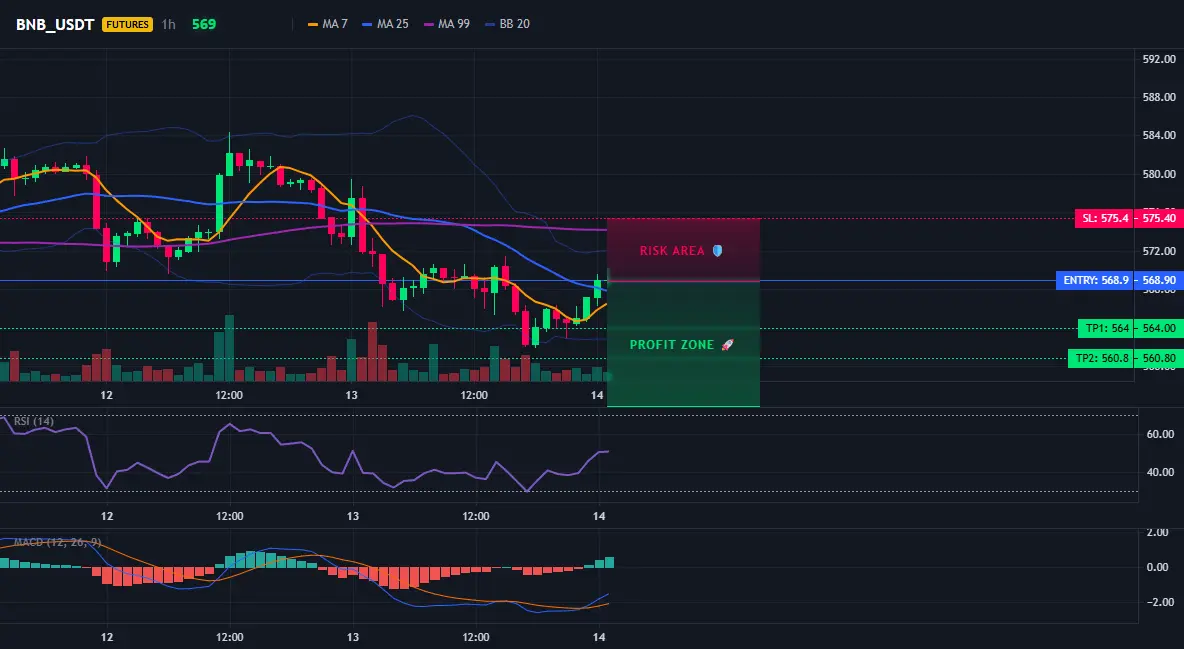
Is this 4-hour bearish candle on BNB a continuation signal for the downtrend or a reversal signal?
$BNB /USDT - SHORT
Trading plan:
Entry: 568.2 – 569.6
SL: 575.4
TP1: 564.0
TP2: 560.8
TP3: 555.9
Why focus on this structure?
- The 1-day trend is clearly bearish; the 95% high-confidence SHORT signal has already been triggered.
- 15-minute RSI is 63.32; the rebound lacks strength, and the bearish momentum hasn’t fully been released yet.
- Entry reference at 568.9; TP1/564.0, TP2/560.8; stop loss at 575.4; the risk-reward ratio is close to 3:1.
- Why now? 4-hour EMA resistance pressure + 1-day be
BNB-0.22%
View Original
post-image
post-image
  • Reward
  • Comment
  • Repost
  • Share
$XEC Signal】Negative funding rate + liquidity backing—1H breakout on the verge
$XEC 1H MACD bearish crossover narrowing; on 4H the upper Bollinger band is at 0.0070, exerting pressure. In the order book, the buyer depth ratio is 0.92. The sell-side orders are slightly thicker, but the funding rate is extremely negative at -0.2077%, and the short positions’ cost basis is high. Longs are actively rotating within the 0.00648-0.00678 range. 0.00639 forms a clear support below.
🎯 Direction: long
⚡ Entry / limit order: 0.00671081 - 0.00673100
🛑 Stop loss: 0.00639445
🚀 Target 1: 0.00723582
🚀 T
XEC7.55%
BTC-0.99%
ETH-0.87%
SOL-1.72%
View Original
post-image
  • Reward
  • Comment
  • Repost
  • Share
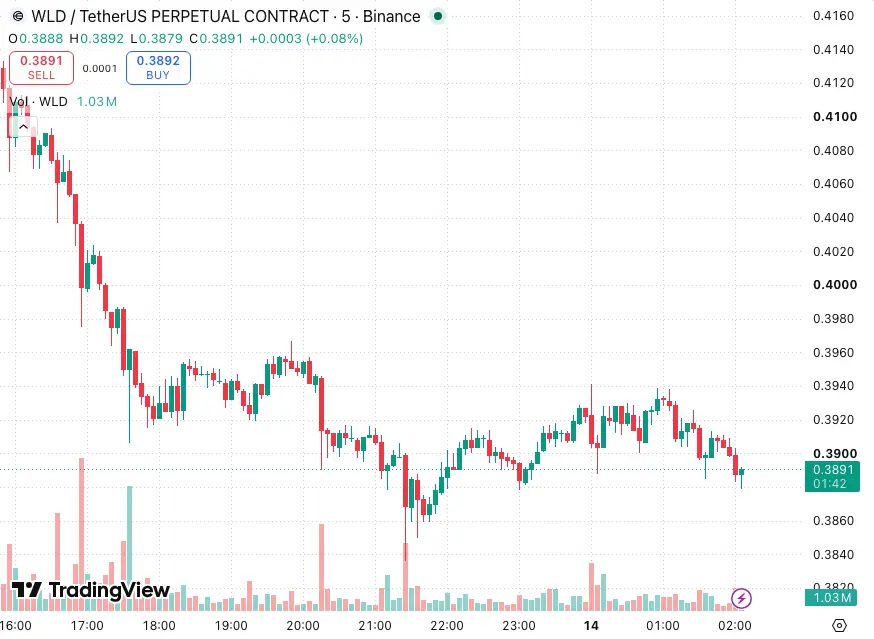
$WLD I’m still bearish. Don’t rush to chase this rebound—I think it looks more like a bull trap. The broader market was weak to begin with, and the team’s selling hasn’t stopped either, so the downtrend likely isn’t over yet. Keep probing lower levels; 0.2 is the point I’m watching. Don’t go in too aggressively—watch the risk.
WLD-6.80%
View Original
post-image
  • Reward
  • Comment
  • Repost
  • Share
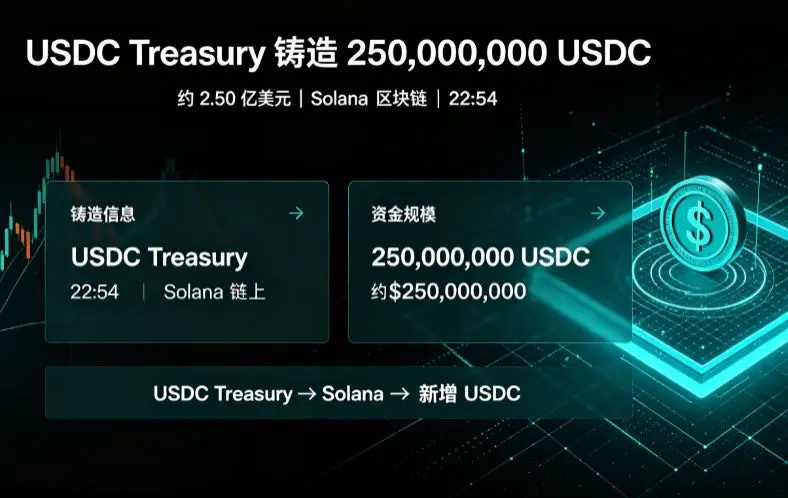
USDC Treasury, the issuer of USDC, minted 250M USDC on the Solana blockchain at 22:54, corresponding to approximately $250 million.
USDC0.04%
View Original
post-image
  • Reward
  • Comment
  • Repost
  • Share
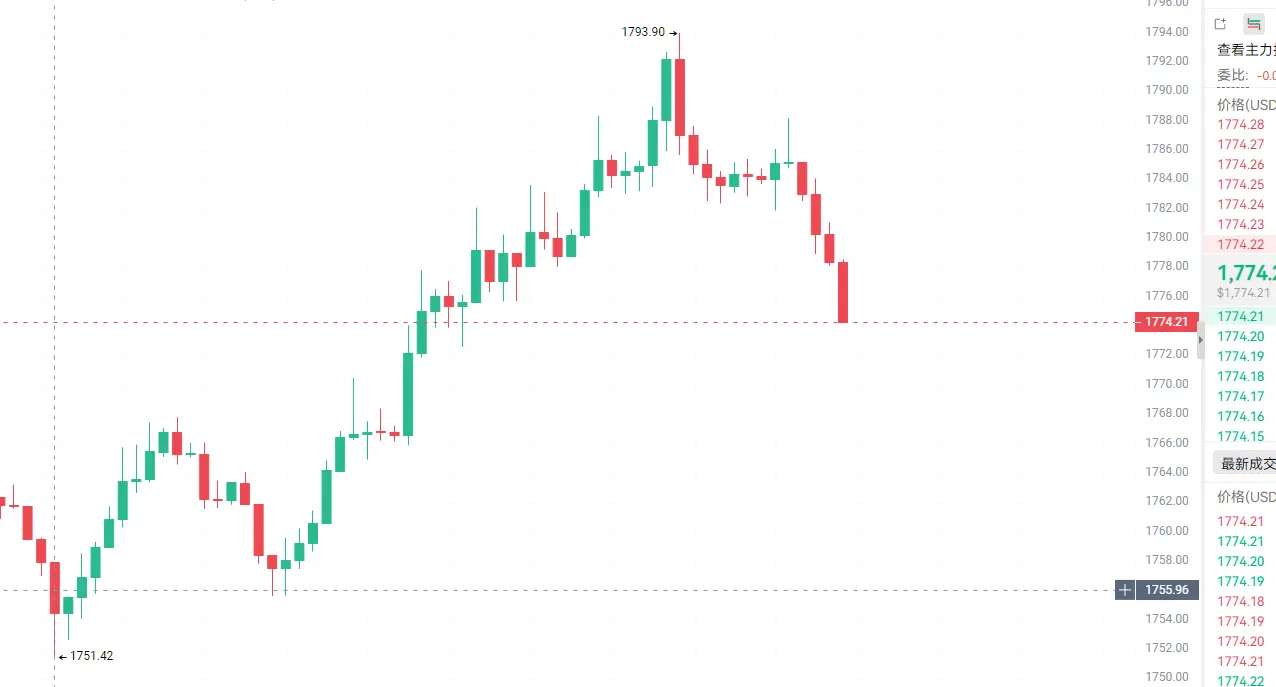
7.14 Two-bet $ETH short analysis
Entry plan: short from 1800-1820
Stop-loss protection: 1840
First take-profit target: 1750-1730
Second take-profit target: around 1700
From the perspective of the larger-cycle structure, after ETH started a pullback from the earlier peak at 1848, the medium- and long-term moving average system has always maintained a downward-pressuring posture. The rally launched from the 1751 low is essentially only a technical oversold rebound after a sharp selloff, not a reversal of the bullish trend. Each time the market repeatedly pushes upward toward key resista
ETH-0.86%
View Original
post-image
  • Reward
  • Comment
  • Repost
  • Share
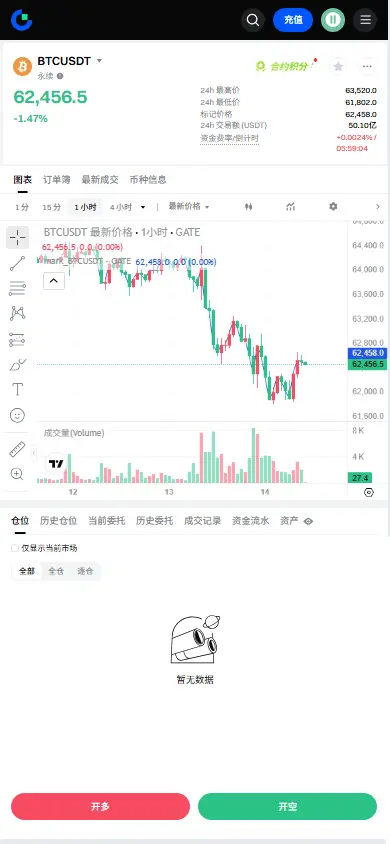
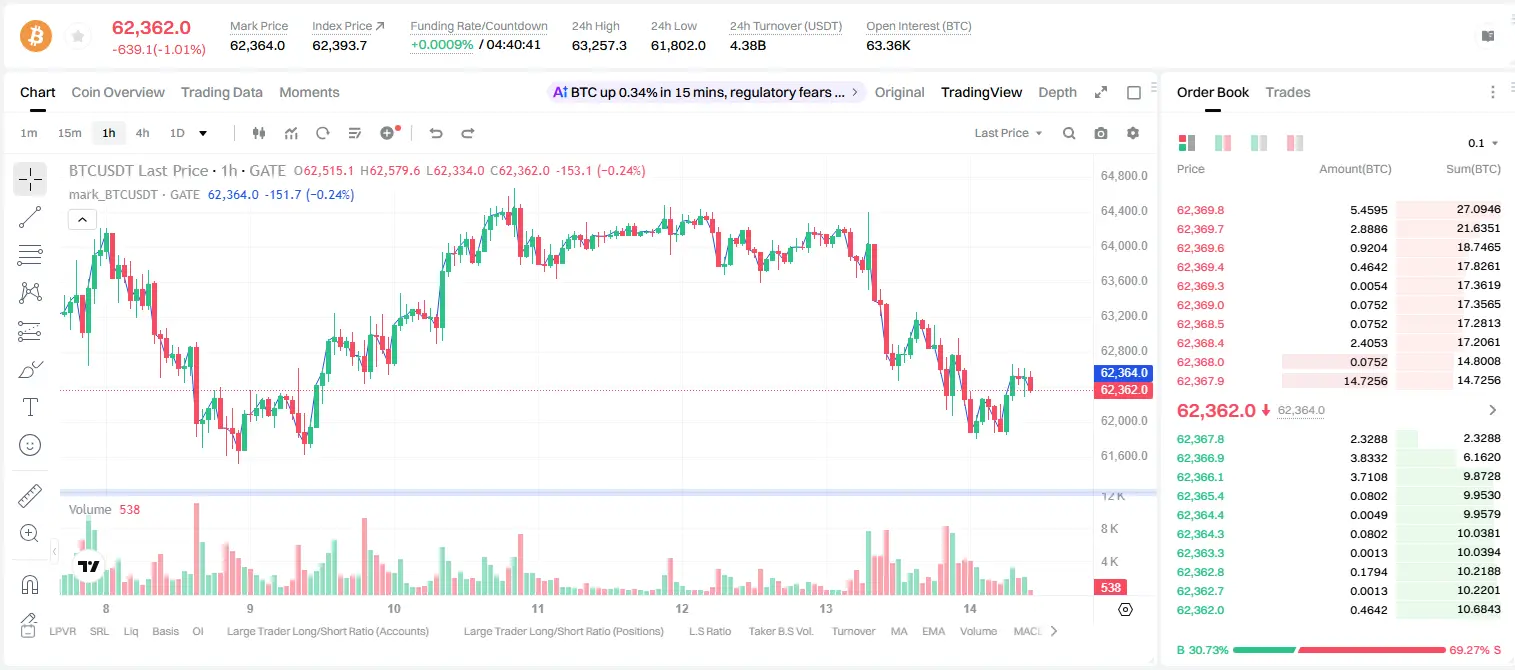
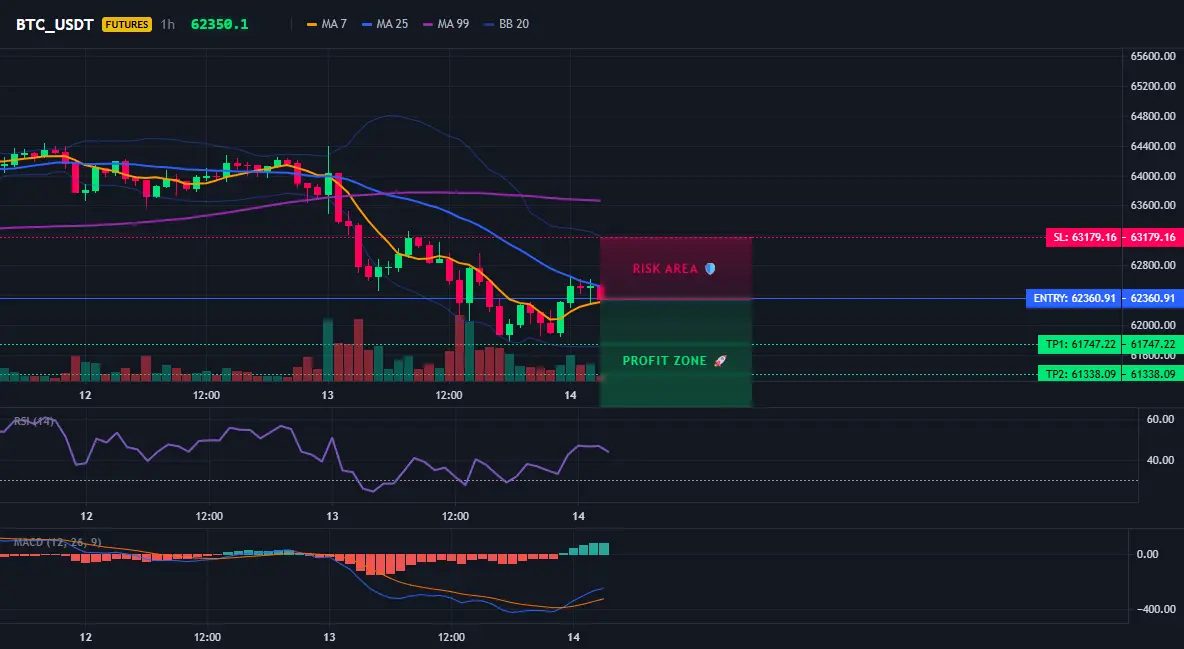
BTC shorts have a 95% win rate—are you brave enough to follow?
$BTC /USDT — SHORT sell
Trading plan:
Entry: 62275.68 – 62446.14
SL: 63179.16
TP1: 61747.22
TP2: 61338.09
TP3: 60724.40
Why focus on this structure?
- On the 4-hour timeframe, it’s clearly bearish; the 1D trend has already turned bearish. $BTC /USDT is currently 62360, right under EMA resistance.
- RSI on 15m is only 50.76, with no rebound momentum; ATR on 1h is 340, volatility is controllable, suitable for entry.
- Why now? Wait for the trigger level 62360.91. If it breaks below 62275, confirm the short. TP1 61747, TP2 61338.
Disc
BTC-0.98%
View Original
post-image
post-image
  • Reward
  • Comment
  • Repost
  • Share
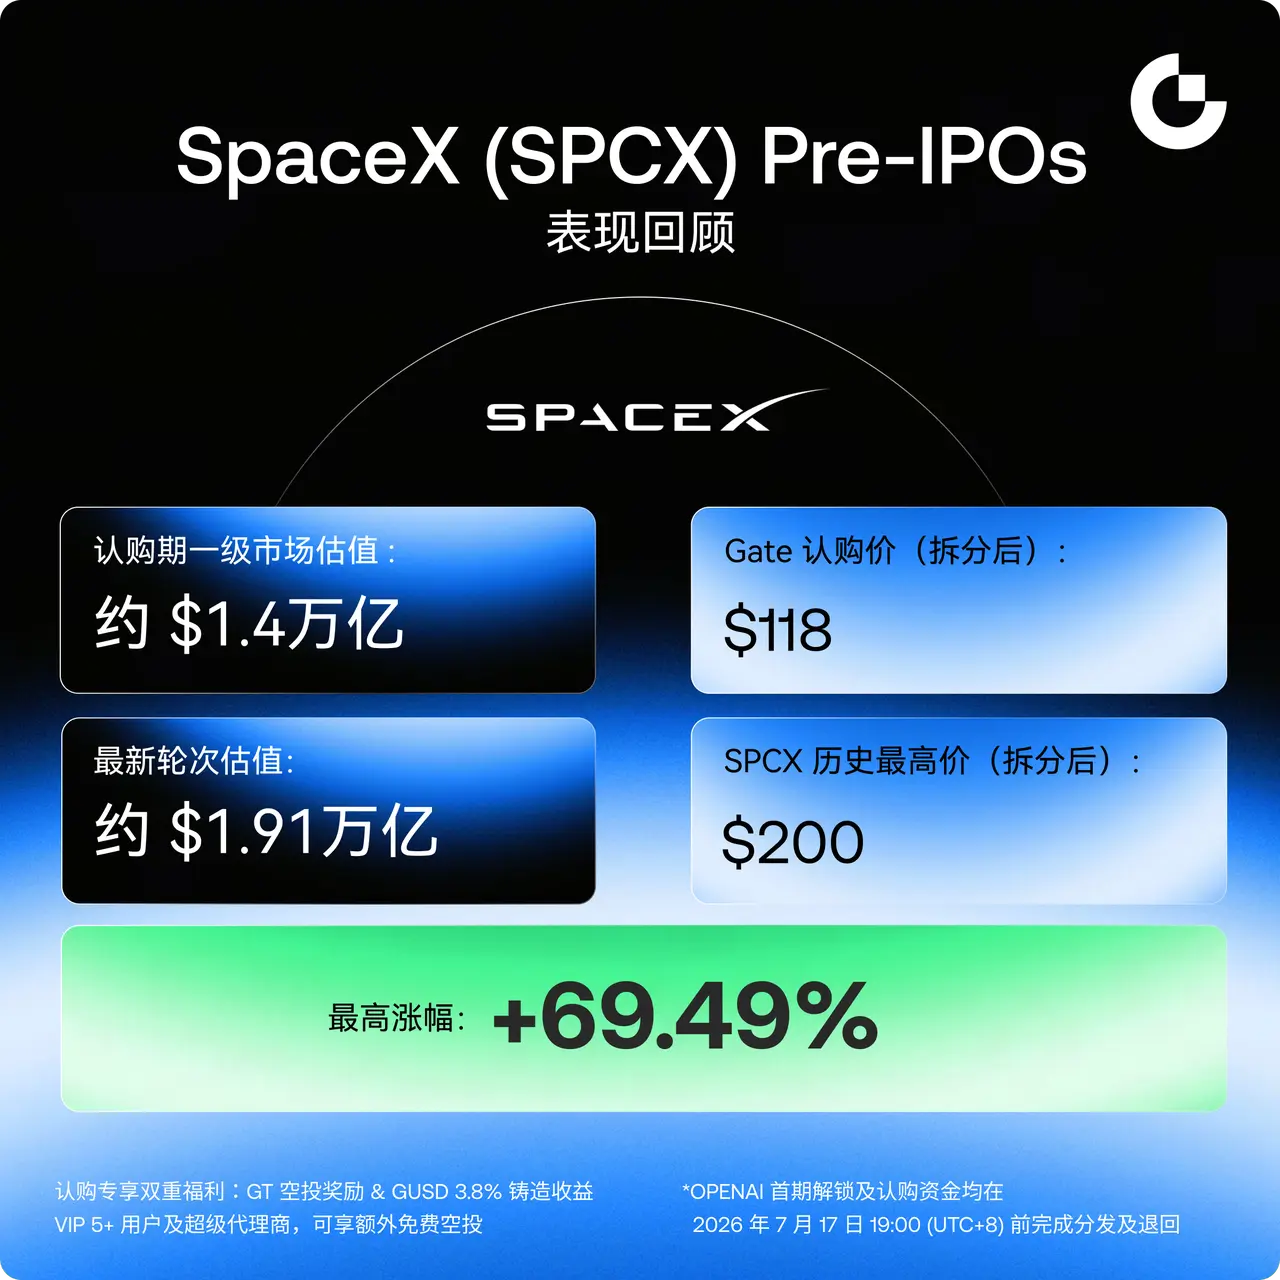
🚀 Gate Pre-IPOs First Batch Performance Recap: SpaceX ($SPCX ) delivers an impressive track record!
📊 First-hand data:
🔹 Participating in Gate’s first batch Pre-IPOs subscription, the maximum increase reached 69.49%
💡 Gate Pre-IPOs continues the legend—join us to witness it together and participate in the upcoming OpenAI ($OPENAI)
🎁 This round of subscription offers double benefits: $GT airdrop rewards & GUSD 3.8% minting yield. VIP5+ users and super agents can enjoy additional free airdrops
Go to the Pre-IPOs subscription page: https://www.gate.com/ipos/21
More details: https://www.gate.
SPCX-3.40%
GT-0.45%
GUSD0.01%
View Original
post-image
  • Reward
  • 4
  • Repost
  • Share
GateUser-4c904b40:
Follow closely 🔍
View More
US 2-year Treasury yield hits a new high since 2025
This is the most direct market pricing of the Federal Reserve’s near-term rate path, indicating that the market has already given up expectations of rate cuts and even started repricing the possibility of rate hikes
At the beginning of 2025, the market was still betting on the Fed cutting rates three to four times for the year, and the 2-year yield was hovering around 4.2%. From there to now, as this figure moves higher, every step along the way has support behind it: input-driven inflation from tariffs hasn’t eased, service-sector inflation
BTC-0.99%
View Original
post-image
  • Reward
  • Comment
  • Repost
  • Share
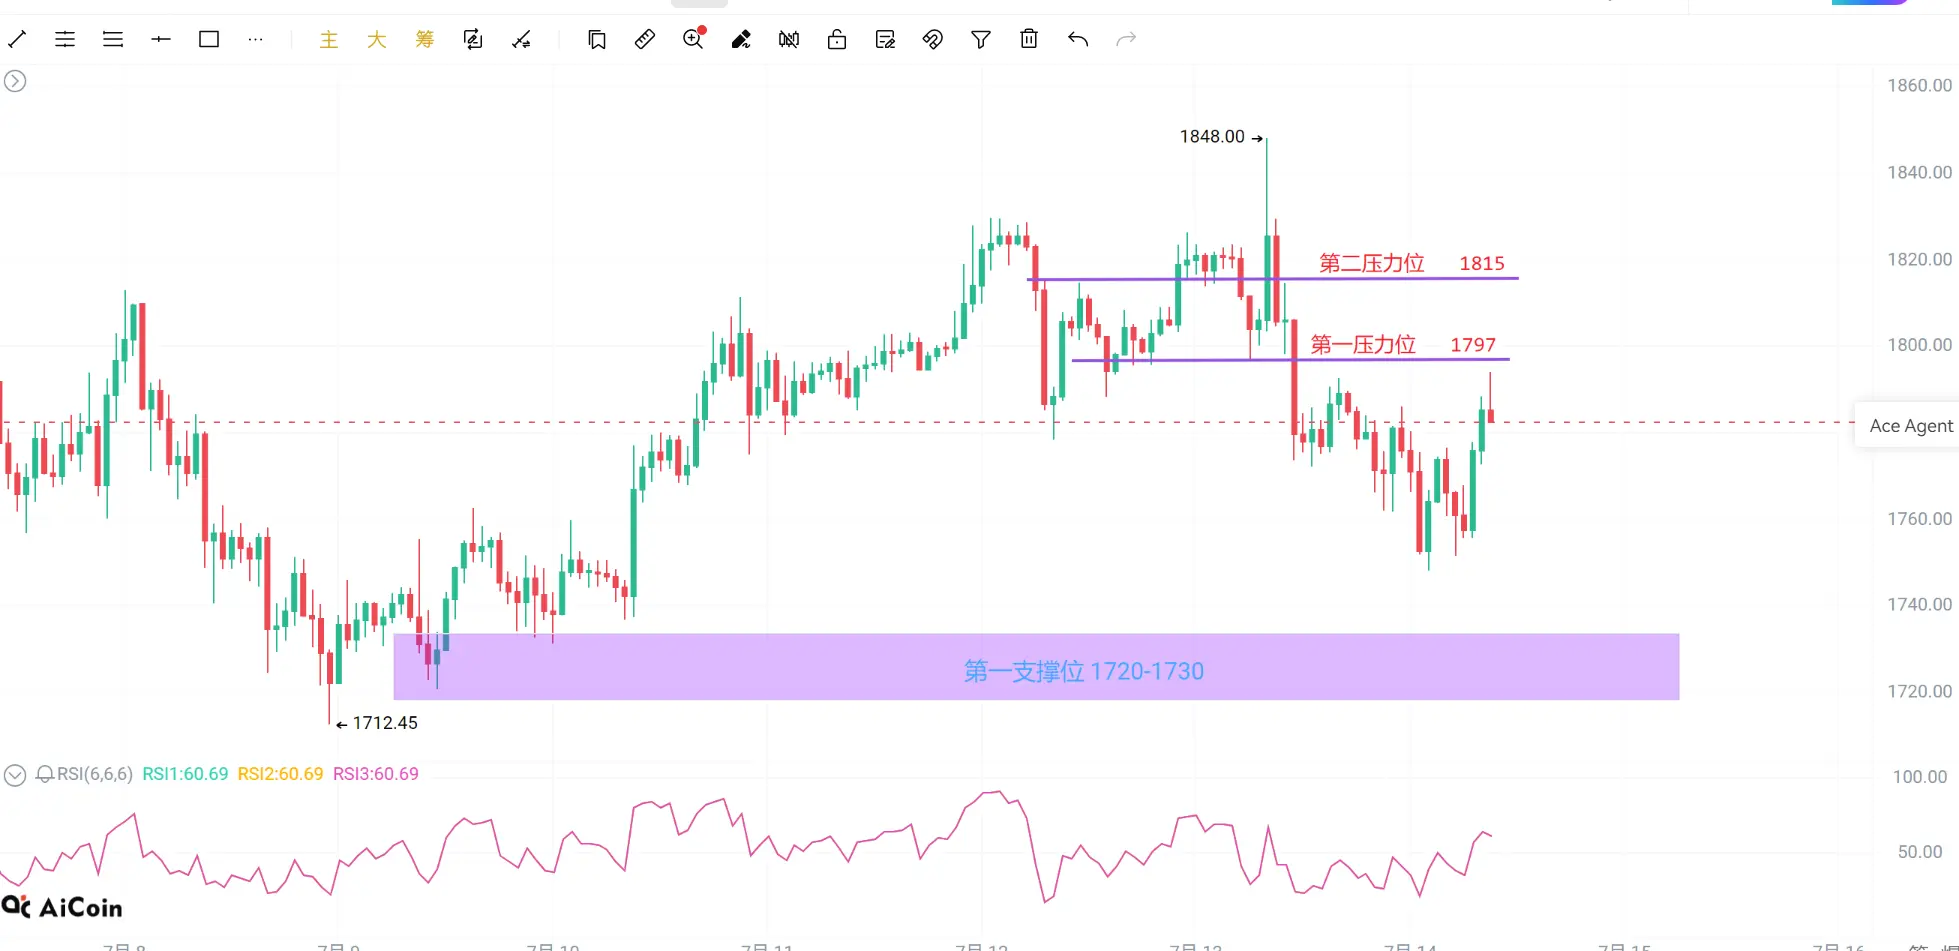

7.14
Around 1760-1765, the light-blue (轻苍) tries to press higher (试哆) for a move, with a stop at 1745; targets 1785/1795;
In the 1795-1805 range above, wait for a counter-chop/control (反手控掸) opportunity, with a stop at 1815; targets 1775/1760.
The board rebounded from the 1748 low to 1783. The AVL average at 1783 is above and forms resistance, so the upside rebound is limited in the short term. The downside 1760-1765 is closer to the prior low area; pulling back here to do a chop/press (哆) is safer than doing it around 1770.
1785-1795 above is the resistance band. If the rebound reaches that a
ETH-0.86%
View Original
post-image
  • Reward
  • Comment
  • Repost
  • Share
Load More

Join 40 M users in our growing community

⚡️ Join 40 M users in the crypto craze discussion
💬 Engage with your favorite top creators
👍 See what interests you
  • Pinned