Share crypto content and earn up to 60% commissions through content mining.
placeholder
gatefun
GM! The editor will greet you with a good morning in the most straightforward, no-nonsense way possible! 😊
post-image
post-image
  • Reward
  • 2
  • Repost
  • Share
ThisIsTranslateContent::
Go, go GT 🚀
View More
Most retail traders will lose money here
  • Reward
  • Comment
  • Repost
  • Share
The best prediction markets won’t create opinions.
They’ll monetize the opinions people already have.
That’s what stood out to me about @Predixa_xyz.
Crypto users already spend every day saying:
→ “$BTC is breaking out.”
→ “$ETH looks bullish.”
→ “$SOL loses momentum.”
Most of those opinions end as tweets.
Predixa lets you act on them.
Instead of learning a complex trading strategy, the question is simple:
What happens next?
→ Yes or No on event markets.
→ Up or Down on live price movements.
The feature I like most is the 5-minute candle market.
You’re not predicting next month’s price.
You’re
BTC-1.95%
ETH-1.21%
SOL-2.41%
post-image
  • Reward
  • Comment
  • Repost
  • Share
#夏日创作营
Today’s Bitcoin Market Analysis
Bitcoin is currently trading at about $65,900 today, down slightly by about 0.3% over the past 24 hours, and up about 2.35% for the week. This month’s price action shows a pattern of “fall first, then bounce”: in early July it touched a 21-month low of about $57,950, then rebounded from the low by about 15%, and is currently trading above the month’s high near $66,000. In June, BTC fell cumulatively by about 20%. July has recouped part of the losses, but it is still far below the highs seen earlier in the year.
The key catalyst behind the rebound over th
BTC-1.95%
SPX-3.91%
View Original
post-image
LittleGodOfWealthPlutus
#夏日创作营
Today’s Bitcoin Market Analysis
Bitcoin is currently trading at about $65,900, down slightly by around 0.3% over the past 24 hours, and up about 2.35% over the week. This month’s trend follows a “fall first, then rebound” pattern: in early July, it touched an approximately 21-month low near $57,950, then rebounded about 15% from the lows. It is now trading near the monthly high around $66,000. BTC fell about 20% cumulatively in June; July has recovered some of the losses, but it remains far below the highs from the beginning of the year.
The key catalyst behind the rebound over the past few days is that U.S. spot BTC ETFs have recorded net inflows for 5 consecutive days, totaling about $727 million—its longest positive streak since late April. At the same time, Treasury Secretary Bessent said the crypto regulatory Clarity Act is at the “final mile,” and the market is optimistic about the legislative outlook. BTC briefly surged to around $66,840. However, a Kitco analyst noted that part of the current rebound is driven by short-seller covering (with roughly $182.5M in short liquidations over 24 hours), rather than large-scale new capital entering the market—so investors still need to view Bitcoin Foundation CoinDesk Kitco’s situation with caution.
1. Technical Indicators
Moving Averages: Daily EMA50 is about $65,738, and EMA200 is about $76,019. The current price has just returned near EMA50, but it is still about 15% away from the EMA200. Structurally, this is still the rebound phase within a broader medium-term downtrend; the moving averages have not yet shown clear bullish alignment signals.
MACD: The daily MACD line remains in negative territory (about -1,045), but the histogram has flipped positive (about +656), indicating that short-term momentum is being repaired. The 4-hour MACD has generated a bearish crossover signal, conflicting with the daily trend—there is short-term downside pullback pressure, but medium-term rebound momentum still remains.
RSI: The daily RSI has entered overbought territory (Kitco clearly labeled it “overbought”), and the 4-hour level is also relatively high. Being overbought does not necessarily mean a drop immediately, but it does suggest that the risk of chasing longs in the short term is increasing—so investors should watch for a pullback or consolidation to digest the move.
Trading Volume: 24-hour trading volume is about $25.13B, but the 30-day average volume is only 62% of the yearly average. Daily spot volume is about $2.3B, so overall market participation is still relatively low. For the rebound to sustain, trading volume needs to expand further to confirm. CoinStats.
2. Key Support and Resistance Levels
Support levels:
$65,000–$65,500: The starting point of the rebound in recent days, and the position ETF analysts consider “must-hold.” If this level breaks, the rebound’s foundation would become unstable.
$60,600–$61,000: The late-June closing area and the early-July rebound starting point—deeper support.
$57,950: The July low. A break below it would confirm the continuation of the downtrend.
Resistance levels:
$66,445: A short-term resistance step that was broken on Tuesday and held.
$67,500–$68,000: The next key resistance zone. If $68,000 is broken, trader Ted Pillows expects a potential quick rally of 5–6% toward the $71,000–$72,000 area.
$70,000: The Q1 range high; a medium-term target level.
3. Outlook for This Week
BTC is in a delicate phase of “rebound momentum still exists, but indicators are already overheated.” ETF inflows and regulatory tailwinds are positive catalysts, but the overbought RSI, the 4-hour MACD bearish crossover, and relatively low trading volume all serve as reminders: this is not a place where investors can comfortably chase longs.
Scenario 1 (probability about 40%): After choppy consolidation, prices continue higher. If BTC can trade sideways between $65,000–$66,500 to digest the overbought indicators for 2–3 days, and then breaks out above $67,500–$68,000 with increased volume, it could move toward $70,000. Trigger conditions: continued net positive ETF inflows and meaningful progress on the Clarity Act.
Scenario 2 (probability about 35%): A short-term pullback to $64,000–$65,000. The overbought indicators naturally correct; the 4-hour bearish signals play out. BTC then revisits the EMA50 area to find support and stabilizes. This kind of pullback is actually a healthier pattern and helps build momentum for the next leg up.
Scenario 3 (probability about 25%): The rebound fails and BTC breaks back below $60,000. ETF inflows turn into outflows, and macro headwinds intensify (with AI funds continuing to divert and risks of a downturn in the credit cycle increasing). BTC then retests the July lows. Kitco analysts mentioned that some macro signals (S&P futures bearish-market consolidation, and a divergence in the dollar’s double-bear positioning) still lean defensive.
4. Trading Recommendations:
Holders: Set some take-profit orders above $66,000. There is no need to rush to fully exit, but you should keep room for a pullback buffer.
Those currently in cash: It is not recommended to chase longs at the current overbought level. Wait for a pullback into the $64,000–$65,000 range before considering building positions in batches.
Short-term traders: In the $65,000–$68,000 range, sell high and buy low, and strictly set stop-loss orders.
Closely monitor daily ETF inflow data and the legislative progress of the Clarity Act—these two variables will determine whether the rebound can continue.
repost-content-media
  • Reward
  • Comment
  • Repost
  • Share
$CXMT ByteDance and Yangtze Memory Technologies sign a $7 billion deal
CXMT-5.56%
View Original
post-image
  • Reward
  • Comment
  • Repost
  • Share
Bitcoin ETF Inflows Extend Into Another Trading Week
gate liveLIVE
700
  • Reward
  • Comment
  • Repost
  • Share
🐋 WHALE WATCH : Institutional conviction in $HYPE is getting wild.
Another whale just pulled 557,902 $HYPE -$32.87M directly off FalconX and immediately routed it straight into Hyperliquid for staking.
Smart money isnt flipping this token they are locking up supply and letting the yield compound. Supply squeeze brewing ?
HYPE-2.56%
post-image
post-image
  • Reward
  • Comment
  • Repost
  • Share
$BANK This move has indeed been a bit beyond expectations, and short-term capital has clearly started to flow back in.
From the order book, BANK price has already been pushed up to around 0.317. On the 1-hour timeframe, it’s been rising continuously, with successive higher lows, and the short-term long structure is fairly complete. The long positions that were laid out around 0.1789 earlier are also now capturing a solid chunk of upside.
However, you can’t blindly chase the rally now, because the percentage increase over a short period has already been quite large. There is clear resistance a
BANK27.11%
BTC-1.95%
ETH-1.18%
View Original
post-image
BANKUSDT
Long
Cross 10X
Return %
+757.48%
Entry Price(USDT)
0.1789
Mark Price(USDT)
0.31491
  • Reward
  • 5
  • Repost
  • Share
GalaxyTradingNotesBit:
DYOR 🤓
View More
Team Trump just dumped another large amount of $TRUMP onto the exchange.
About 1 hour ago, this team’s wallet just transferred 10.84M $TRUMP (worth $16.91M) to BitGo, likely preparing to dump.
Over the past 5 months, they have dumped a total of 48.25M $TRUMP ($172.4M) across 3 batches.
After each transfer, the price of $TRUMP kept dropping, and altogether more than 66% of the value has evaporated.
TRUMP-2.49%
View Original
post-image
  • Reward
  • Comment
  • Repost
  • Share
Analysis subject: spot gold
Analysis time: July 25 (Saturday), for next week’s outlook
Core view: Gold is currently trading in a range. The bigger direction remains downward. You need to watch for whether key levels break.
I. Daily timeframe analysis
1. Since the drop in March, gold has been in an overall weak downward trend, and the large downtrend has not changed.
2. 4200 is the key watershed: only after a valid breakdown of 4200 can the market see a larger rebound space, targeting the prior resistance zone at 4300–4400.
3. The rebound in the first three days of this week is still within the
XAUUSD0.08%
View Original
post-image
  • Reward
  • Comment
  • Repost
  • Share
$DEXE Got on the vehicle halfway up the mountainside, and it’s starting to take off again—longs should be able to make some money.
DEXE140.01%
View Original
post-image
post-image
  • Reward
  • 1
  • Repost
  • Share
GateUser-11474ec2:
bbbbbbvvvv
Heyi is the ultimate queen of meme on CT
I’m yet to see anyone with similar aura
post-image
  • Reward
  • Comment
  • Repost
  • Share
#IntelQ2RevenueSurges25%
Intel's AI Comeback Is No Longer Just a Story—It's Starting to Show Up in the Numbers
For the past few years, Intel has been one of the most debated companies in the technology sector.
Some investors believed the company had permanently fallen behind in the AI race, while others argued that rebuilding a semiconductor giant would take years rather than quarters.
This week's earnings don't end that debate, but they do change it.
Intel reported $16.1 billion in second-quarter revenue, up 25% year over year—its fastest revenue growth in more than fifteen years and well ah
INTC-7.90%
NVDA-0.83%
AMD-3.29%
post-image
post-image
  • Reward
  • 2
  • Repost
  • Share
Venüs_:
2026 GOGOGO 👊
View More
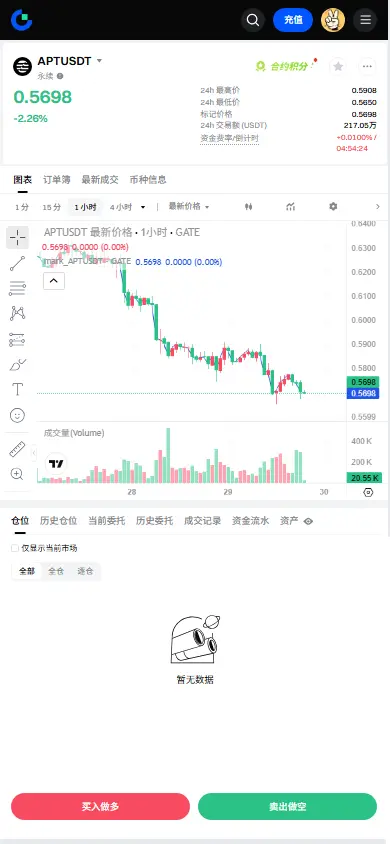
The weekend market is relatively calm, especially on Saturday—prices are fairly stable, so you don’t need to watch the chart all the time. Just place limit orders and wait for the market to give you an opportunity #Gate事件合约首发狂欢
You can also predict the market and “bet” on the price for the next five minutes
View Original
post-image
  • Reward
  • 5
  • Repost
  • Share
GateUser-c0c72dbe:
love this
View More
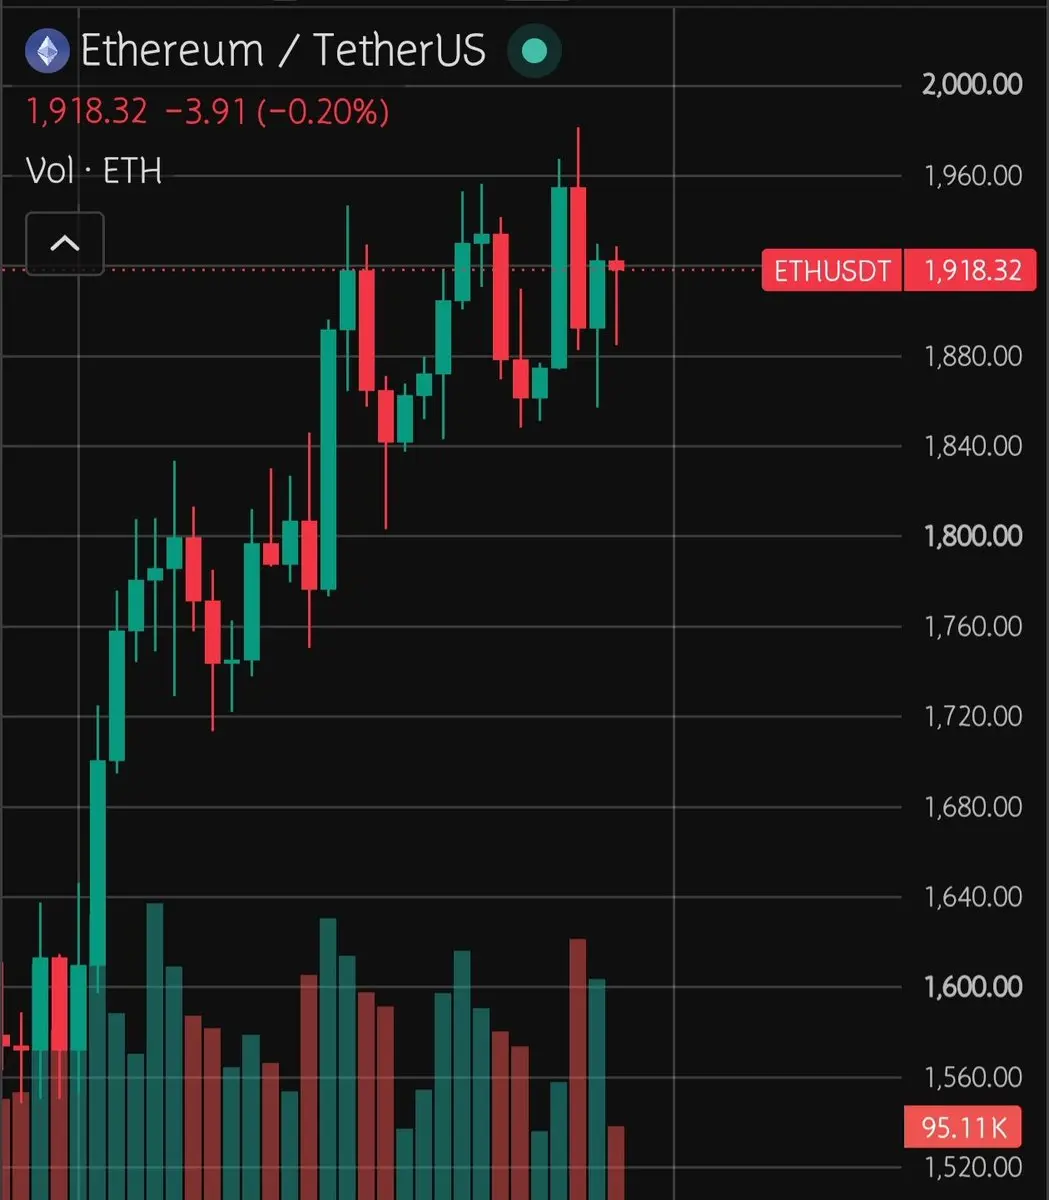
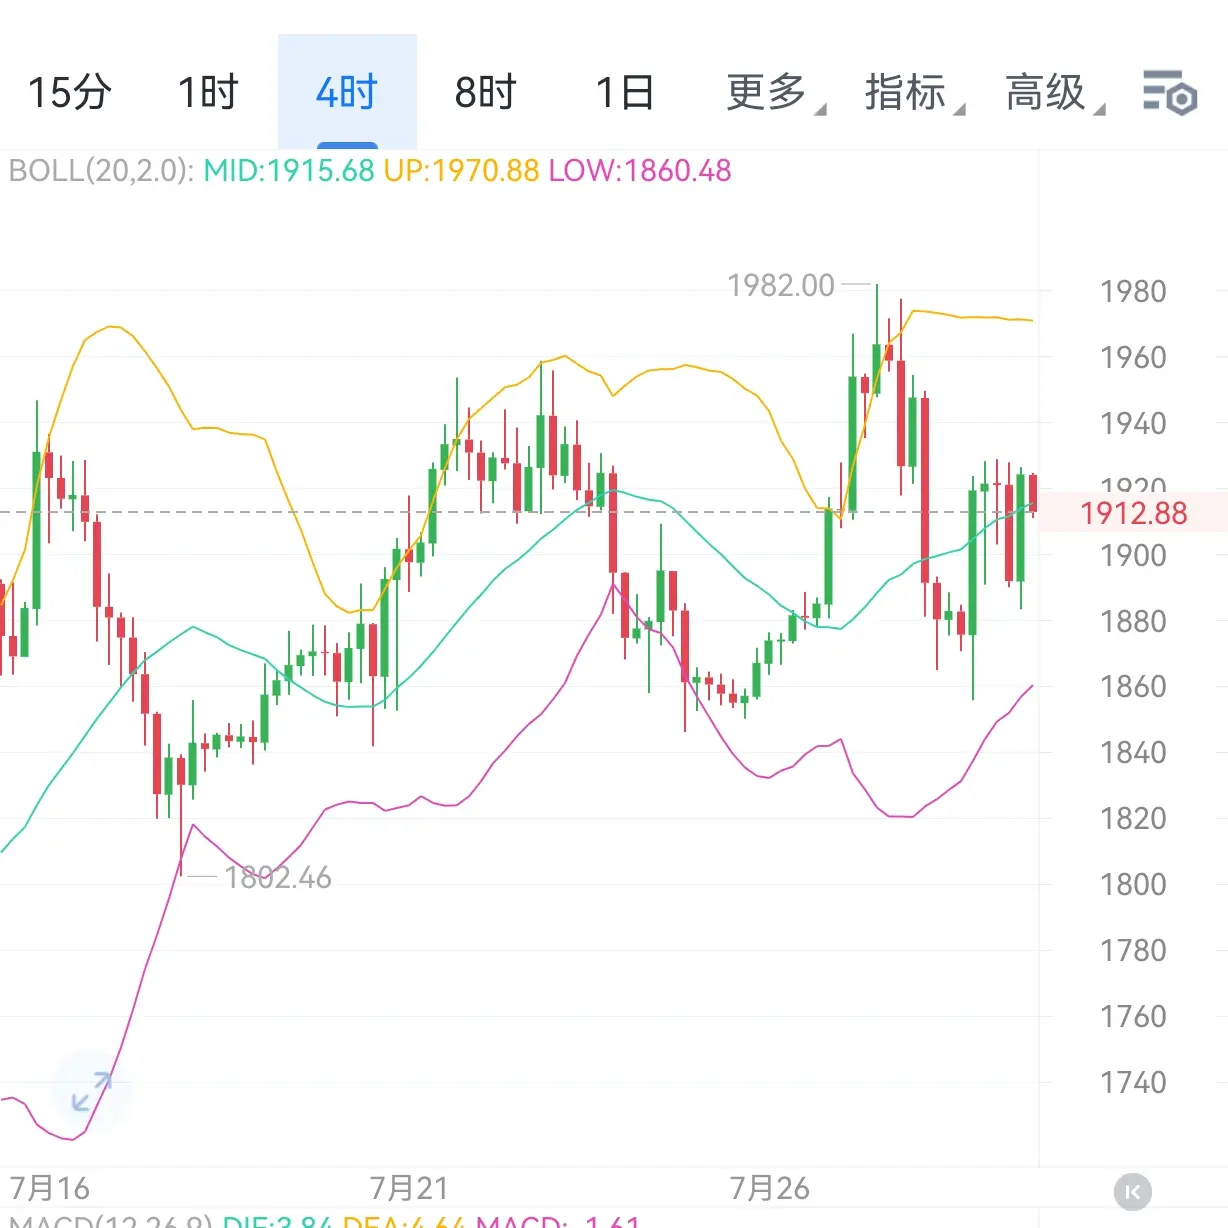
On July 25th, the weekend $ETH move—this one is still relatively weak for now.
I checked the current market: the 4-hour structure has already worked through a pullback, and price has been staying pressed near the short-term moving averages. The rebound strength is clearly not enough. The 1-hour timeframe has stabilized with some recovery, but I haven’t seen any real signal of a genuine shift to strength yet.
Also, it’s the weekend—U.S. stocks are closed, so overall market liquidity is low. In this kind of environment, it’s easiest for price to poke up and down with those “needle” wicks. A lot
ETH-1.18%
BTC-1.95%
AKE25.69%
SOL-2.41%
LAB3.98%
View Original
post-image
ETHUSDT
Short
Cross 200X
Return %
+574.39%
Entry Price(USDT)
1,920.48
Mark Price(USDT)
1,858.18
  • Reward
  • 5
  • Repost
  • Share
GalaxyTradingNotesBit:
DYOR 🤓
View More
New market update
gate liveLIVE
51
  • Reward
  • Comment
  • Repost
  • Share
GWEI/USDT (1H) Trade Plan
$GWEI #UStoImpose10To12.5PercentTariffsOn60Economies
Current Price: 0.02927
Market Structure
Strong bullish trend with higher highs and higher lows.
Price is trading above the MA5, MA10, and MA30, confirming bullish momentum.
MACD remains above the signal line, although the histogram is beginning to flatten, suggesting momentum may cool after the recent surge.
The pair has rallied nearly 46% in 24 hours, so volatility is elevated and chasing green candles carries higher risk.
Key Levels
Immediate Resistance: 0.03175 (recent high)
Next Resistance: 0.03350–0.03500
Su
GWEI48.50%
  • Reward
  • Comment
  • Repost
  • Share
$DEXE The swings feel great
DEXE140.01%
View Original
post-image
post-image
  • Reward
  • Comment
  • Repost
  • Share
$VELVET is waiting for you to pump the market—experts, please help!
VELVET3.50%
View Original
post-image
  • Reward
  • Comment
  • Repost
  • Share
7🈷️25 Korea-Japan job league has two featured matches; for more information, please contact TG @lclm168
View Original
post-image
post-image
  • Reward
  • Comment
  • Repost
  • Share
Load More

Join 40 M users in our growing community

⚡️ Join 40 M users in the crypto craze discussion
💬 Engage with your favorite top creators
👍 See what interests you
  • Pinned