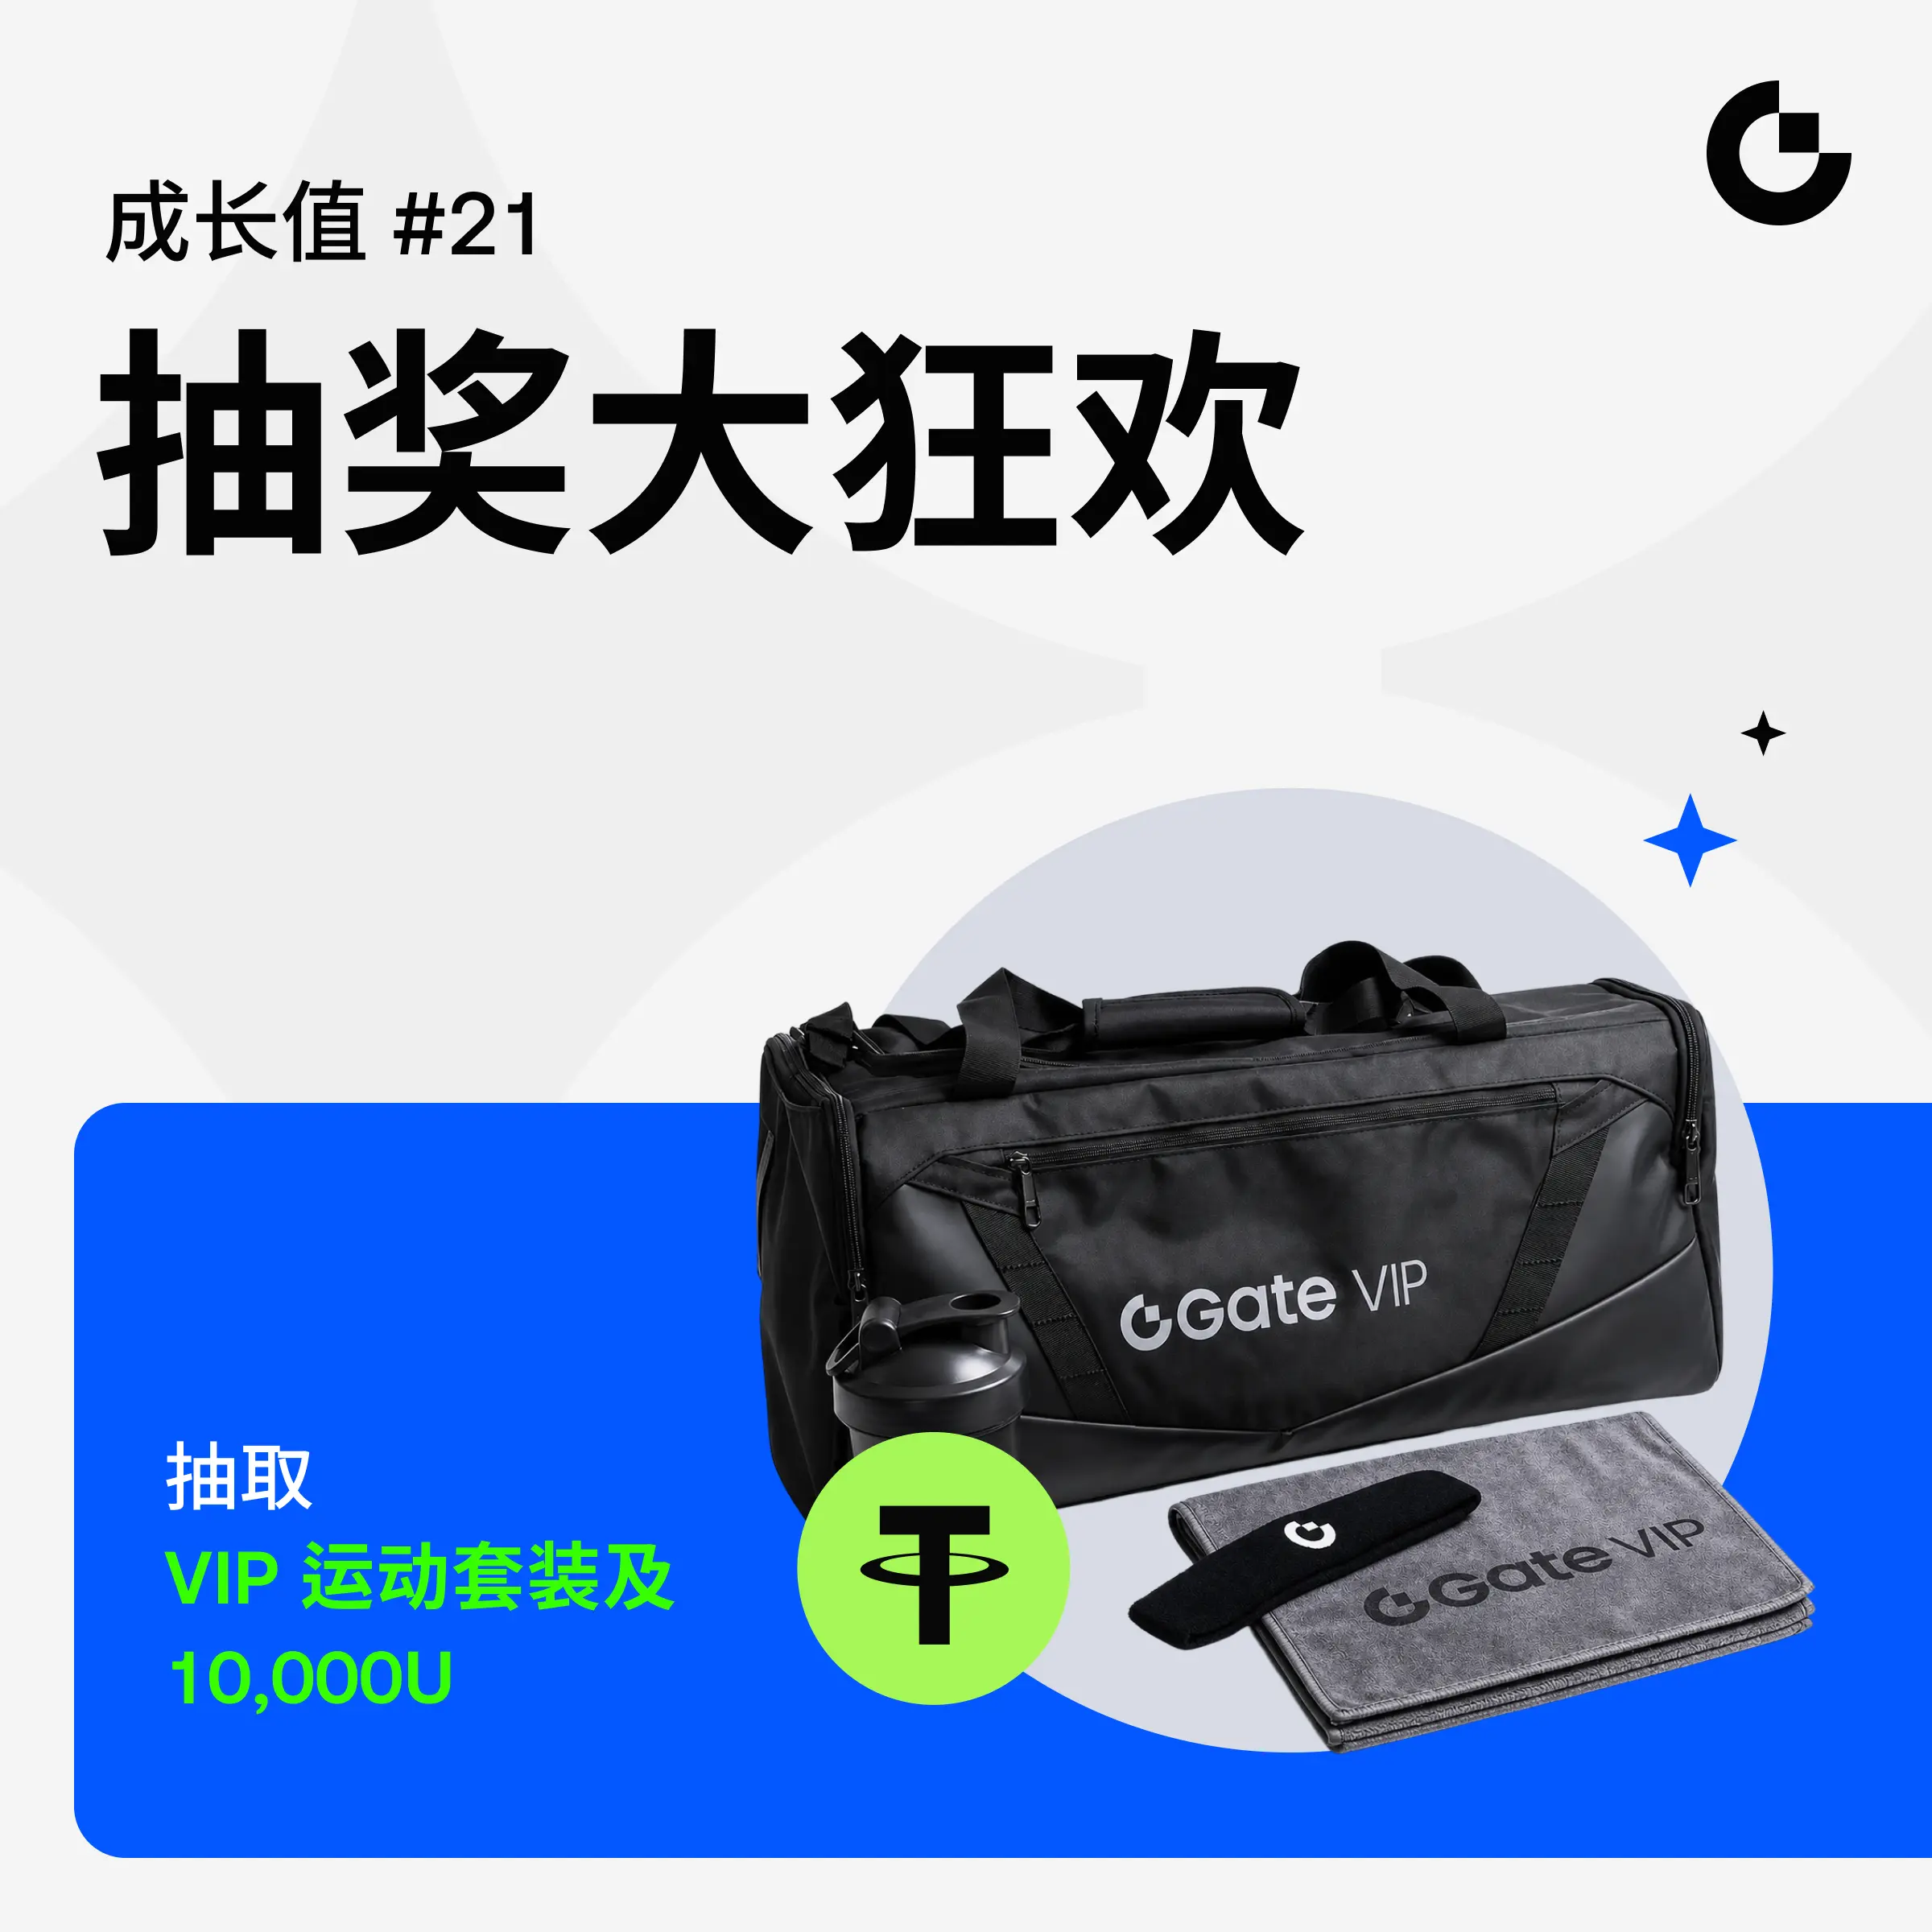
Share crypto content and earn up to 60% commissions through content mining.
placeholder
gatefun
Brothers, $PHA this short position was perfectly executed! A while ago, when the price was at 0.04805, I already sensed that the market was off, the momentum was not catching up, and the whales weren’t supporting the market, with the entire order book full of sell orders. I immediately notified to short. Now the price has dropped to 0.03753, with a profit of +536.87%. Those who followed have all made money. Remember, taking profits and securing gains is the key. Earlier, some big players made $20,000! I now recommend taking 80% of profits, and holding the remaining orders to see if the price
PHA2.01%
BTC-2.64%
ETH-4.52%
View Original
post-image
  • Reward
  • Comment
  • Repost
  • Share
#LAB Stay away from this trash, empty Ether, bottom at 1750
LAB-17.97%
ETH-5.34%
View Original
post-image
  • Reward
  • Comment
  • Repost
  • Share
BTC slips below $66k as of today, drifting ~1.92% in 24h. Brief price weakness into support zones may draw fresh spot demand from traders eyeing a rebound. $BTC
BTC-2.64%
post-image
  • Reward
  • Comment
  • Repost
  • Share
$ETH Signal】Short Sniping: Weak Rebound, 1H MACD Golden Cross Shrinking
$ETH Bid/Ask Depth Ratio 2.30 indicates strong buying support, but after the 1H MACD golden cross, the momentum bars continue to shrink, indicating very weak rebound strength. The lower Bollinger Band around 1829 on the 4H chart remains unbroken, with price oscillating narrowly around 1850. The recent short target zone is between 1822-1809. The current risk-reward ratio is about 1.5, making short-term shorts somewhat cost-effective, but after RSI becomes deeply oversold, a technical rebound may be triggered. Strict stop
ETH-5.34%
View Original
post-image
  • Reward
  • Comment
  • Repost
  • Share
#分享美股交易赢英伟达股票 Goldman Sachs predicts Nvidia's stock price will reach $285: Can the stock hit this target in June?
Breaking through the consolidation range on June 1st, the stock rose 6.26% that day, and Goldman Sachs reaffirmed the $285 target price, sparking renewed questions about how long the rally can last.
Breakouts are bullish reasons, and the new round of optimism from analysts after the GTC Taipei conference theme speech also supports this. But one indicator shows the opposite trend, causing Nvidia executives to hesitate between two development paths for the rest of the month.
Nvidia's
NVDA-3.36%
View Original
post-image
Ryakpanda
#分享美股交易赢英伟达股票 Goldman Sachs predicts Nvidia's stock price will reach $285: Can the stock hit this target in June?
On June 1, it broke through the consolidation range, rising 6.26% on that day, and Goldman Sachs reaffirmed its target price of $285, which once again raises questions about how long the rally can last.
Breakouts are bullish reasons, and a new wave of optimism from analysts after the GTC Taipei conference theme speech also supports this. But one indicator shows the opposite trend, causing Nvidia executives to hesitate between two development paths for the rest of the month.
Nvidia's stock price broke out and rose, after Goldman Sachs reaffirmed its $285 target price.
Nvidia (NVDA) stock rose 6.26% on June 1, closing above $224, breaking out of the previous weeks-long downtrend channel. Trading volume approached 213 million shares, consistent with late April levels. This rally marked the peak of a bullish flag pattern, characterized by a sharp price increase, followed by a sloped consolidation phase, and then a breakout higher.
Nvidia's stock price rose from a low of $164 to a high of $236, a 44% increase, then pulled back within the flag formation channel. On June 1, the price finally broke through the bullish flag.
The timing was no coincidence. On the same day, after Nvidia delivered a keynote speech at Computex Taipei during the GTC conference, Goldman Sachs reiterated its "buy" rating on Nvidia and maintained its $285 target price.
Goldman Sachs reaffirmed its "buy" rating and $285 target price for Nvidia, citing the company's ambitious AI PC initiatives, continued leadership in data centers, and the growing popularity of artificial intelligence agents.
On June 1, analyst James Schneider pointed out that Microsoft is aggressively entering the AI personal computer space, Nvidia leads in data centers, and AI agent applications are expanding. He also added that Nvidia's next-generation AI chip system—the Vera Rubin platform—is progressing smoothly. Nvidia also released RTX Spark, a desktop AI computer designed to run AI agents locally. This is the second bullish signal in less than two months, after Susquehanna set a $275 target in May.$NVDA – Analysts raised Nvidia's target price to $275 amid surging AI demand.
Susquehanna analyst Christopher Rolland raised Nvidia's target price from $250 to $275, maintaining a "positive" rating ahead of the company's May 20 earnings report.
Even as prices rise, capital flow continues to decline
Not all signals support this trend. The Chaikin Money Flow (CMF) indicator measures whether institutional funds are flowing into or out of a stock. Nvidia's CMF has struggled to stay positive for months, possibly due to funds moving between competing AI stocks. The indicator briefly rose to around 0.58 in early May but fell back to zero by June 1. Additionally, from late April to early June, prices trended upward while the CMF indicator declined, indicating a lack of strong buying support for this rally. This is a bearish divergence. Although the breakout candlestick volume significantly increased, the CMF did not show a corresponding rise. Buyers flooded in on the breakout day, but the indicator has yet to confirm sustained institutional accumulation.
On the other hand, some changes could occur. If institutions start buying heavily, and the CMF indicator moves back above zero, it would strengthen the case for a genuine breakout.
Currently, capital flow has not been convinced, so the next focus should be on holdings data. Options bets lean bullish, but leverage levels appear balanced. The options market offers a way to break the deadlock. The put/call ratio compares put options to call options; the lower the ratio, the more traders favor calls, indicating bullish sentiment. Based on trading volume, the ratio is 0.39, with calls clearly dominating and bullish sentiment more pronounced. Daily new bets also favor calls. The open interest ratio is more balanced at 0.81, close to equilibrium. This gap is crucial. The daily chart shows bullishness, but long-term leverage levels are not unbalanced.
Open interest is healthy. If Nvidia's stock price pulls back, fewer long positions would need to be closed, reducing the risk of a sharp decline.
Overall, this suggests bullish bets but without dangerous leverage, aligning with a breakout that still needs confirmation from capital flow. As a result, the price chart can only show two possible directions for this month’s price movement.
Nvidia's stock levels in bull and bear scenarios. Nvidia's setup clearly divides into two paths, each with its own triggers.
Bullish signals start when the daily close exceeds $225. This confirms a breakout and opens Fibonacci extension levels at $244, $253, and $265. The next major target is $280, close to Goldman Sachs' forecast of $285, and if the 44% decline fully repeats, the target could reach $310. The key trigger here is demand. If the production of RTX Spark AI-PC and the launch of Vera Rubin attract institutional buyers this month, capital flow could turn positive, and the $300 target from DA Davidson would further boost this trend.
The bearish scenario is the opposite. Falling below $208 would weaken this pattern, and closing below $194 would break it entirely. At that point, market sentiment would turn cautious. Deutsche Bank maintains a "hold" rating with a $255 target; Goldman Sachs previously pointed out margin risks due to rising costs. These could all contribute to a decline in stock price.
If buyers do not appear and funds continue flowing into competing AI stocks, the breakout could retreat into the channel, slowing the rally. There is a key link between the two. Currently, this rally lacks confirmation from capital flow, so the bullish path depends on a change in funds; the bearish path only requires continued absence of buying.
For Nvidia stock, these two lines determine the future trend over the next month. If the daily close exceeds $225, it is likely to reach the $280 target before June and meet Goldman Sachs' forecast; if it falls below $194, the bears will regain control.
repost-content-media
  • Reward
  • 4
  • Repost
  • Share
discovery:
2026 GOGOGO 👊
View More
Dear partners, let's synchronize the latest price of $BIO at 0.03448. I have already been warning everyone to position for long positions in advance, and the market has played out as expected, with the price rising to 0.03448 at a key level, showing a strong bullish trend. Currently, the price around 0.03448 is a technical pullback during the upward process, not a trend reversal, and the overall upward structure remains intact. To protect position profits and avoid unnecessary retracements, it is recommended that everyone execute stop-loss orders as planned to achieve capital preservation and
BIO5.3%
BTC-2.64%
ETH-4.52%
View Original
post-image
  • Reward
  • Comment
  • Repost
  • Share
Grayscale staking-style HYPE ETF set to launch soon
gate liveLIVE
647
live-coin
  • Reward
  • Comment
  • Repost
  • Share
$CLO Signal】Long + 1H pullback test 4H support
$CLO Buy and sell order depth ratio 1.49, the buyer's bid to support is clear. 1H MACD shows a death cross but the price is stuck above the EMA20, and the 4H Bollinger middle band at 0.1213 provides distant support. Currently, the pullback volume is shrinking, selling pressure is weakening, suitable for low buy-in dips.
🎯Direction: Long
⚡Entry/Order: 0.1808259 - 0.1813700
🛑Stop loss: 0.1795563
🚀Target 1: 0.1840906
🚀Target 2: 0.1854508
🛡️Trade management:
- Execution strategy: Reduce 50% of the position after reaching Target 1
CLO26.33%
View Original
post-image
  • Reward
  • Comment
  • Repost
  • Share
If you bought 100 $XMR in 2017 when you were in your 20s.
Congrats!
You will soon be 30, and the price is exactly the same.
  • Reward
  • Comment
  • Repost
  • Share
To be honest, $TA this bullish rhythm is a bit beautiful, profits have already been realized.
When the previous wave just moved, it was repeatedly testing around 0.08094, showing signs of capital inflow during the session, and as long as the pullback didn't break the level, it started pushing upward.
My idea is to go long.
The price reached 0.09264, +354.72% has already been reflected on the account, and the rhythm has been established.
Next, stay steady first, take 85% profit, and keep the remaining 15% to see if there's a second wave.
Discipline on the move, don't forget to set st
TA-9.51%
View Original
post-image
  • Reward
  • Comment
  • Repost
  • Share
$OPN Hello, just like that, went from over 18 to 11, immediately taking off. Watch a block.
OPN70.89%
View Original
post-image
  • Reward
  • Comment
  • Repost
  • Share
I woke up and saw $PIEVERSE start moving, this long position is indeed a bit aggressive.
Earlier when I was watching the market, the price was around 0.8984, I saw it consolidate at a low level for a while before increasing volume and rising, the rebound signs were very obvious, so I decisively reminded everyone to go long earlier.
The price reached 0.9995, +540.18% has already been realized on the books, the rhythm has been set.
My suggestion is to take 70% of the profit first, and take the remaining 30% lightly, don’t give back what you’ve gained.
Stay disciplined in the car, don’t
PIEVERSE-14.53%
View Original
post-image
  • Reward
  • Comment
  • Repost
  • Share
$ENA Signal】Long position, strong breakout on 1H
$ENA 1H RSI 77.75, buying pressure stacking, MACD histogram continuously expanding. 4H Bollinger Bands opening upward, price moving along the upper band.
🎯Direction: Long
⚡Entry/Order: 0.11573 - 0.11608
🛑Stop loss: 0.1149192
🚀Target 1: 0.1178212
🚀Target 2: 0.1186918
🛡️Trade management: Reduce Target 1 by 50%, move the stop loss up to break-even. If price drops back to the entry level, exit.
Funding rate 0.0034% is neutral, and OI shows no anomalies. Risk-reward ratio is 1.5x, with limited room but a higher win rate.
View real-time market
ENA20.59%
BTC-2.64%
ETH-4.52%
SOL-5.33%
View Original
post-image
  • Reward
  • Comment
  • Repost
  • Share
$BCH This wave of short positions was perfectly realized! 🔥
From 363.55 → 246.93, this wave of profit reached +2276.12%, brothers who followed this wave achieved +2276.12%! 🚀
I told everyone before that this kind of "dry pull without volume" market can't go far, a decline is inevitable. Now the verification and judgment, strength speaks.
📌 What's the next move?
1. 80% of the position takes profit first, only when the money is in hand is it truly yours;
2. Keep holding the remaining 20% and see, but be sure to execute the stop-loss as planned, absolutely cannot let the profit be p
BCH-13.59%
BTC-2.64%
ETH-4.52%
View Original
post-image
  • Reward
  • Comment
  • Repost
  • Share
Which is your most favourite Dogs?
#DroverInu $Grok #Aidoge #BabyDoge #Doge #Hydrachain
#Milo #PolyDoge #Shib $Wif $CKOM
#Elon #Kishu #Floki #BONK
DOGS-0.35%
GROK-6.55%
AIDOGE2.46%
BABYDOGE-3.35%
post-image
  • Reward
  • Comment
  • Repost
  • Share
$PHB Dropped from 0.085 to 0.0128, follow the trend and take profit at 80%, lock in gains. The remaining 20% watch for key levels later, and execute stop-loss as planned. The altcoins is highly volatile, don't give back your profits. Those who haven't entered the market yet, don't chase now, wait for my next signal.
$BTC $ETH
PHB-6%
View Original
post-image
  • Reward
  • Comment
  • Repost
  • Share
#分享美股交易赢英伟达股票 The U.S. stock market has surged 16% in two months: only occurred four times in history, most recently before the 1987 crash!
The strong rebound in the U.S. stock market over the past two months is triggering historical warnings. The S&P 500 index has risen 16% from April to May, a gain that has only happened four times since World War II, three of which occurred during recovery phases after recessions, with the only non-recession precedent being just a few months before the 1987 "Black Monday" crash.
Deutsche Bank macro strategist Henry Allen pointed out that this current rally
NVDAON-4.07%
View Original
post-image
Ryakpanda
#分享美股交易赢英伟达股票 The U.S. stock market has surged 16% in two months: it has only happened four times in history, the most recent being before the 1987 crash!
The strong rebound in U.S. stocks over the past two months is triggering historical alarms. The S&P 500 index has risen 16% from April to May, a gain that has only occurred four times since World War II, three of which happened during recovery phases after a recession, with the only non-recession precedent being just a few months before the 1987 "Black Monday" crash.
Deutsche Bank macro strategist Henry Allen pointed out that this current rally is not occurring in the context of a recession recovery, making historical comparisons particularly striking. Meanwhile, credit spreads remain at historic lows, but signals of consumer pressure are accumulating, Fed rate hike expectations are rising, and divergence between the sovereign bond market and stocks continues to widen. With multiple risk factors stacking up, tail risks in the market are unusually concentrated.
Henry Allen wrote in his report, "The tail risks currently distributed are exceptionally prominent, both geopolitically and in the market."
Rare historical precedent, only one in a non-recession context!
The S&P 500 index gained 16% over April and May, a rare occurrence only four times since WWII. Three of these were strong rebounds following recessions: the recovery after the COVID-19 pandemic from April to May 2020, the rebound after the global financial crisis from March to April 2009, and the recovery after the first oil crisis from January to February 1975. The fourth was from January to February 1987. At that time, only a few months remained before October's "Black Monday"—when the S&P 500 plunged 20% in a single day.
Henry Allen emphasized that this rally is supported by fundamentals, including enthusiasm for artificial intelligence and strong economic data, but "the pace of the rise has already broken all recent precedents." In an economy that has not emerged from a recession, such a rapid rebound has never ended well in history. Additionally, the S&P 500 is on track to achieve its fourth consecutive year of double-digit gains, a record that has not been seen since the late 1990s.
Overly optimistic credit markets, consumer pressure signals being ignored!
The stock market's strength is also spreading to credit markets. Credit spreads in the U.S. and Europe are now narrower than before the U.S.-Iran conflict erupted, indicating high risk tolerance. However, warning signals at the consumer level are accumulating. The U.S. savings rate in April was only 2.6%, a level only seen during two periods in history: a single month in 2022 (when excess savings accumulated during the COVID-19 pandemic were being depleted), and just before the global financial crisis. Meanwhile, the University of Michigan consumer confidence index hit its lowest level since records began in 1952 in May. The monetary policy environment is also tightening. The European Central Bank is widely expected to raise interest rates this month, and market bets on the Fed raising rates in 2026 are heating up—April’s U.S. PCE inflation was 3.8% year-over-year, supporting this expectation.
Henry Allen pointed out that historically, hawkish Fed stances tend to coincide with widening credit spreads, as seen in 2022, late 2018, and from 2015 to 2016. The current calm in credit markets is a clear deviation from this historical pattern.
Bond markets alone under pressure, divergence from stocks continues to widen!
Despite the stock and credit markets showing high immunity to geopolitical risks, the sovereign bond market has taken a very different path. Over the past month, the 10-year U.S. Treasury yield has almost completely followed oil prices, diverging sharply from other asset classes. In mid-May, sovereign bond yields hit multi-year highs: the 30-year U.S. Treasury yield rose to 5.18%, the highest since 2007; the 10-year German bund yield rose to 3.19%, the highest since 2011. At that time, stocks were just a step away from their all-time highs, while bond yields reached levels unseen in over a decade. This divergence has shown no signs of convergence to date.
Henry Allen believes that bonds price inflation and fiscal risks more directly, making them more sensitive to geopolitical shocks. The ongoing divergence between stocks and bonds itself reflects the fragility of the current market.
Oil prices unexpectedly stable, becoming a key support for risk assets!
The blockade of the Strait of Hormuz lasted much longer than initially expected, but oil prices responded surprisingly mildly, partly explaining the resilience of risk assets. When the Iran-U.S. conflict erupted on February 28, the White House initially projected the action would last 4 to 6 weeks. However, the Strait of Hormuz remains blocked to this day. According to Polymarket data, the probability of normal navigation resuming by the end of June has dropped sharply from about 80% in mid-April to 22%.
Nevertheless, oil futures curves remain relatively stable. Two weeks after the conflict broke out on March 13, Brent crude oil six-month futures closed at $85.66 per barrel; by June 1, the contract was still around $84.88, nearly unchanged.
Henry Allen pointed out that because oil futures curves have not shifted significantly upward, investors have not priced in severe stagflation risks, avoiding larger-scale sell-offs in risk assets. However, he also warned that if the Strait of Hormuz remains blocked, whether this support can be maintained remains uncertain. $US500
repost-content-media
  • Reward
  • 3
  • Repost
  • Share
HighAmbition:
good information 👍
View More
$GUA Signal】Bullish breakout, 1H Bollinger upper band trading
$GUA 1H RSI 79, price closely hugging the Bollinger upper band at 1.1004, buying pressure shows no signs of exhaustion. 4H MACD bars continue to expand, bullish momentum still accumulating. Market depth indicates slight increase in selling pressure, but funding rate at 0.0667% is relatively low, indicating bullish sentiment is not yet overheated. Current risk-reward ratio is about 1.5, within an acceptable range.
🎯Direction: Long
⚡Entry/Order: 1.081346 - 1.084600
🛑Stop loss: 1.073754
🚀Target 1: 1.100869
🚀Target 2: 1.109003
🛡️T
GUA32.37%
View Original
post-image
  • Reward
  • Comment
  • Repost
  • Share
Crypto live chart
gate liveLIVE
583
  • Reward
  • Comment
  • Repost
  • Share
Load More