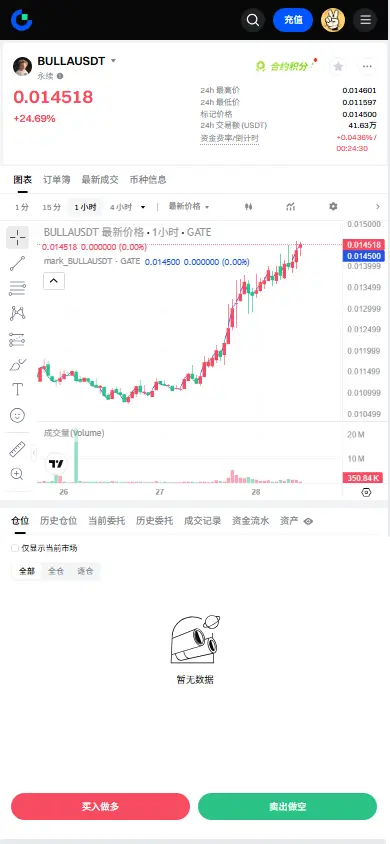
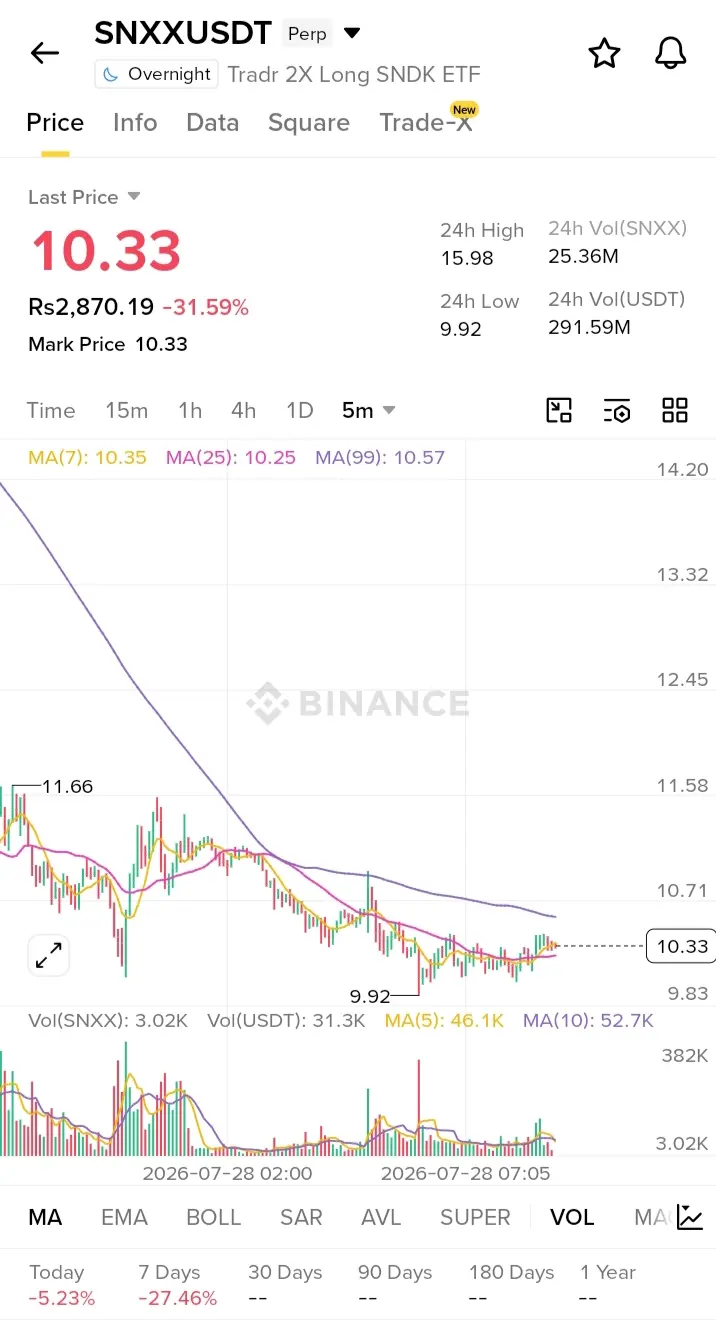
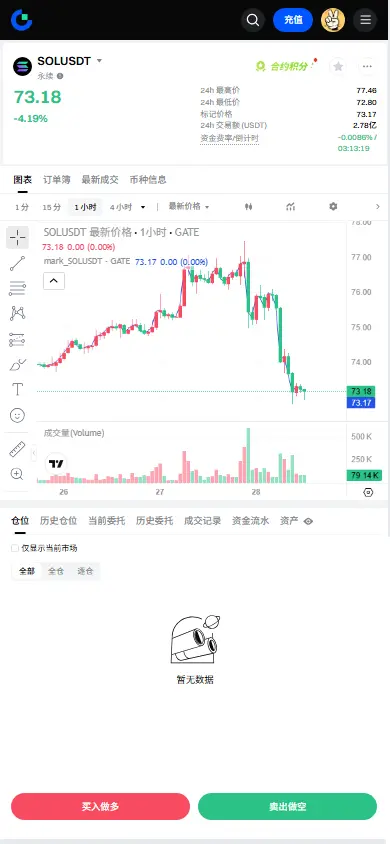
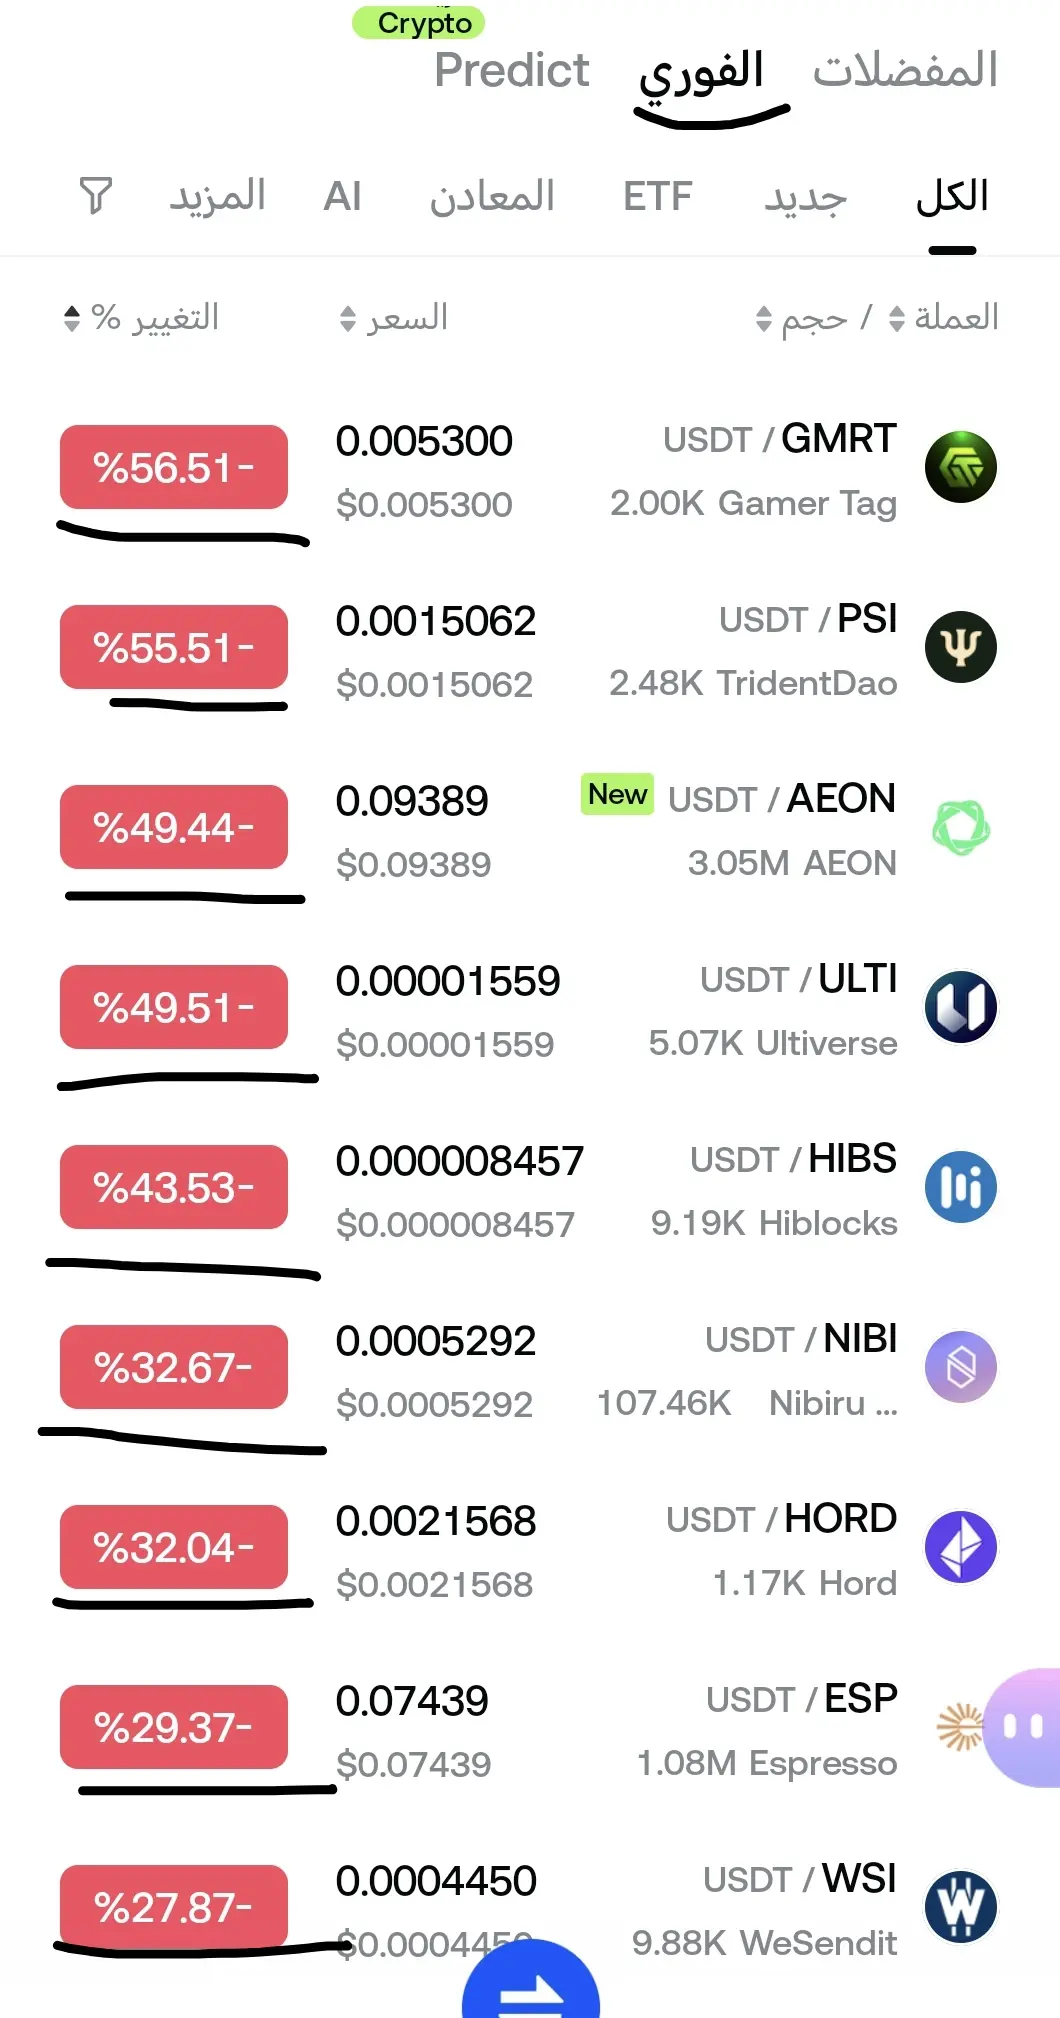
Share crypto content and earn up to 60% commissions through content mining.
placeholder
gatefun
JUST IN: South Korea’s equities setup points to a sharp Sell-off before a dip-buy, with 7050 on the radar and heavy 5x leverage among retail traders. If sentiment darkens pre-market, a 15-20% single-day drop could hit, triggering possible circuit breakers. $KOSPI
post-image
  • Reward
  • Comment
  • Repost
  • Share
#BitcoinETFSees7272BTCOutflow
Bitcoin ETF Sees 7,272 BTC Outflow: Record 13-Day Streak Signals Structural Shift
U.S. spot Bitcoin ETFs have recorded one of the most dramatic capital exodus events in crypto history. Between May 15 and June 3, 2026, approximately 7,272 BTC flowed out of the funds as part of a record-breaking 13 consecutive days of net outflows, totaling roughly $4.4 billion in redemptions. The streak finally paused on June 4 with a modest $3.05 million net inflow, but the damage to sentiment and positioning was already significant.
The outflows dragged total Bitcoin ETF assets
BTC0.91%
ETH1.69%
post-image
EagleEye
#BitcoinETFSees7272BTCOutflow
14 Days. 66,000 BTC. $4.5 Billion Gone. What This ETF Outflow Streak Actually Tells Us About Market Perception
On June 4, U.S. spot Bitcoin ETFs recorded a net outflow of 7,272 BTC — roughly 657.54 million in a single day. That day marked the 14th consecutive trading day of outflows, a streak never seen since the ETFs launched. BlackRock's IBIT alone shed approximately 342 million, and Fidelity's FBTC lost around 54 million. Over the full 14-day stretch, cumulative redemptions climbed to roughly 66,000 BTC, exceeding 4.5 billion. Bitcoin briefly dipped below $62,000, touching a near four-month low.
The numbers are staggering, but the real story isn't in the arithmetic. It's in what those numbers reveal about how markets perceive value, how sentiment and fundamentals interact, and why different investors respond to the same data in completely different ways.
Let's start with the most misunderstood dynamic in crypto: the gap between business fundamentals and investor sentiment. Bitcoin's network fundamentals — hash rate, adoption curves, institutional infrastructure development — have not collapsed. The blockchain is running. Developers are building. Countries are still drafting regulatory frameworks around digital assets. But fundamentals don't move prices on a 14-day timeframe. Sentiment does. And sentiment, right now, is being driven by something fundamentals can't counter: the visual of capital leaving the very vehicles that were supposed to bring it in.
Spot ETFs were hailed as the bridge between Wall Street and Bitcoin. They were the narrative that turned "institutional adoption" from a prediction into a product you could buy on your brokerage dashboard. When that bridge starts bleeding — when IBIT, the flagship from the world's largest asset manager, sees $342 million walk out in one day — the narrative cracks. Not because the product is broken, but because perception shifts. Investors begin asking: if the institution that built this bridge is watching people leave, should I be leaving too?
This is the interaction between businesses, expectations, and market sentiment over time. ETF providers like BlackRock and Fidelity aren't just passive conduits. Their brands carry weight. When IBIT posts outflows, it signals something beyond a number — it signals that even the "smart money" channel is experiencing pressure. The expectation was that ETFs would create a floor of institutional demand. The reality is that institutions are not a monolith. Some are tactical allocators rebalancing quarterly. Some are hedge funds executing momentum strategies. Some are wealth managers responding to client risk tolerance changes. They all use the same ETF wrapper, but their strategies, timeframes, and reasons for exiting are entirely different.
Recognizing that different investors use different strategies is essential to reading this moment correctly. The 14-day streak doesn't mean "everyone is dumping Bitcoin." It means a subset of ETF-positioned capital is realigning. Some of that realignment is driven by macro headwinds — hawkish Fed rhetoric pushing risk-off positioning. Some is profit-taking after earlier accumulation phases. Some is genuine fear. And some, paradoxically, may be rotation into other opportunities — the AI infrastructure boom has attracted approximately $400 billion in deployment over the past six months, and capital is fluid. It flows toward perceived momentum. Right now, that momentum isn't in crypto.
Which brings us to the hardest part: discipline. When you see 14 consecutive days of redemptions, when BTC drops below $62,000, when the Fear & Greed Index reportedly touched levels suggesting near-capitulation — maintaining discipline is not a slogan. It's a real, psychological, gut-level challenge. Your portfolio is shrinking. The narrative that justified your position is being challenged daily. The people you trusted to hold the floor are walking away. And every instinct in your body says: cut the loss, step aside, wait for clarity.
But here's what discipline actually means in practice. It doesn't mean ignoring the data — that's denial. It means processing the data without letting it dictate decisions that belong to your strategy, not your emotions. A structured investment approach says: I entered with a thesis, I sized my position to survive drawdowns, I defined my exit criteria before the drawdown happened, and I'm not rewriting those criteria because the market printed 14 red candles. The investor who follows structure rather than impulse is the one who, historically, captures recoveries. The one who exits on fear is the one who sells the bottom to someone who stayed.
Now the deeper question: which is actually more difficult — staying disciplined during volatility, or identifying the right opportunity at the right time? Honestly, they're the same skill seen from different angles. Discipline is the ability to act on what you already know without second-guessing it under pressure. Timing is the ability to recognize when new conditions create an opening that aligns with your framework. Both require you to separate signal from noise. Both require you to resist the gravitational pull of crowd sentiment. And both require you to accept that you won't always be right — but you'll be wrong in a way you can learn from, rather than a way that devastates your capital.
The 14-day outflow streak is noise for some investors and signal for others. For tactical traders, it's a signal to reduce exposure until flows stabilize. For long-term allocators, it's noise — a temporary dislocation that may create entry opportunities once sentiment resets. For observers of innovation and growth across industries, it's context: capital rotates between sectors, and right now AI is drawing the tide. Bitcoin's long-term trajectory doesn't depend on a 14-day flow streak. Its short-term price does.
What matters most is not whether you interpret this as bullish or bearish. What matters is whether your interpretation comes from a structured framework or from the emotional reflex of watching $4.5 billion walk out the door. The market doesn't reward conviction born from panic. It rewards conviction born from process.
This streak will end. Flows will eventually reverse — they always do, historically, after extreme streaks, sometimes within days. The question isn't when. The question is whether, when that reversal comes, you'll be positioned according to your plan or according to your fear.
repost-content-media
  • Reward
  • 2
  • Repost
  • Share
MasterChuTheOldDemonMasterChu:
Just charge forward 👊
View More
#ALLO Data analysis from Aice100 shows that when $ALLO price is around $0.31247, the 24-hour price change is +23.49%.
In other words, the short-term rally has been pushed again, and funds are still following the trend.
Regarding risk, the large investors' long and short positions are at 57:43, clearly leaning bullish, so the pullback depends on whether the support below can hold.
Let's see if $0.30466 can hold, with $0.32184 being the resistance level.
Position volume: 71.62 million → 78.06 million (up 9.0%)
Large investors' long and short ratio: 0.49 → 0.43 (bearish dominance)
Active absorp
ALLO26.08%
View Original
post-image
  • Reward
  • Comment
  • Repost
  • Share
Everyone’s waiting for a breakout, but SLX is quietly setting up for a trap below 0.174.

$SLX /USDT - SHORT

Trade Plan:
Entry: 0.17267 – 0.17557
SL: 0.18802
TP1: 0.16370
TP2: 0.15675
TP3: 0.14632

Why this setup?
RSI is neutral at 46.8 on the 15m—no momentum to push higher. Daily trend is range, not bullish. With a 4h SHORT bias at 55% confidence, the entry zone 0.172-0.175 is a low-risk squeeze spot. Why now? ATR is tight at 0.0058, meaning volatility is compressed—breakouts fail here.

Debate:
Is this a fakeout to TP1 at 0.163 or a dead cat bounce to the long alt target?
SLX1.07%
post-image
post-image
  • Reward
  • Comment
  • Repost
  • Share
BTC and eth update
gate liveLIVE
200
  • Reward
  • Comment
  • Repost
  • Share
#BitcoinETFSees7272BTCOutflow
THE GREAT BITCOIN ETF EXODUS
The numbers are staggering and the implications are profound. US spot Bitcoin ETFs suffered 13 consecutive days of net outflows from May 15 through June 3, 2026, totaling approximately $4.4 billion in capital extracted from the funds. This represents the longest and most severe outflow streak since spot Bitcoin ETFs launched in January 2024, and the 7,272 BTC that left the ETF structure during this period tells a story that every crypto investor needs to understand.
THE SCOPE OF THE DAMAGE
The cumulative impact extends far beyond the
BTC0.91%
ETH1.69%
post-image
  • Reward
  • 2
  • Repost
  • Share
HighAmbition:
good information 👍
View More
$ALLO Signal】Long + 1H Oversold Rebound / Negative Fee Rate Support
$ALLO 1H RSI 40.95, Deep Imbalance -10.27%, Price has broken below the 1H Bollinger lower band.
4H MACD bullish histogram narrows, but buy orders are densely clustered around 0.318 within 30 minutes, indicating clear signs of capital support.
Negative fee rate -0.0098% coexists with stable OI, and short covering pressure is accumulating.
🎯Direction: Long
⚡Entry/Order: 0.31836 - 0.31932 (Place orders within the suggested range)
🛑Stop Loss: 0.3161268
🚀Target 1: 0.3241098
🚀Target 2: 0.3265047
🛡️Trade Manag
ALLO26.08%
BTC0.91%
ETH1.69%
View Original
  • Reward
  • Comment
  • Repost
  • Share
Bitcoin and Ethereum Market Insights Live Stream
gate liveLIVE
486
live-coin
  • Reward
  • Comment
  • Repost
  • Share
$DOGE No signs of major capital buying the dip! Pumping to lure in sellers, then short them!!!
Under the catastrophe of the overall market, even the once most resilient Meme faith has completely collapsed. $DOGE Although it slightly rebounded within the day to around $0.08383 following the market, this cannot hide the destructive wipeout experienced over the past week. Not long ago, it directly fell below the critical bull-bear line of $0.1, with the lowest even ruthlessly crashing to $0.07766, and the technical pattern has fully entered a frozen period.
Moving averages exert heavy pressure,
DOGE3.66%
View Original
post-image
  • Reward
  • Comment
  • Repost
  • Share
#6月3日,美國眾議院以215票對208票通過戰爭權力決議,要求川普停止對伊朗軍事行動,未經國會授權不得繼續作戰。4名共和黨議員與民主黨共同投下贊成票,係2月開戰以來首次。雖決議象徵意��
🥇 GOLD AT THE CROSSROADS: War Powers Vote Shakes Markets
Technical Breakdown & Trading Strategy
Published: June 7, 2026 | Gate Research Desk
EXECUTIVE SUMMARY
Gold is currently sitting at a critical decision zone after a strong multi-month rally that pushed prices into historically elevated territory above $4,000. The recent U.S. House war powers resolution vote (215–208) against continued military engagement in Iran has added a new layer of geopolitical uncertainty.
While the vote is largely symbo
post-image
post-image
post-image
post-image
  • Reward
  • Comment
  • Repost
  • Share
$VELVET Signal】Multi-cycle resonance, short-term bullish opportunity
$VELVET 1H rebound above EMA20, sideways around 0.1895, 4H MACD histogram shrinking but line still above zero, bulls and bears tug-of-war.
Market depth imbalance is only -1.11%, with thicker orders below.
RSI_14 at 78.6, high-level fatigue risk exists, but funding rate at 0.005% is relatively low, no crowded long positions.
Currently, risk-reward ratio is 1.5, odds are acceptable.
🎯Direction: Long
⚡Entry/Order: 0.18897 - 0.18954
🛑Stop loss: 0.18764
🚀Target 1: 0.19238
🚀Target 2: 0.19380
🛡️Trade manage
VELVET27.99%
View Original
  • Reward
  • Comment
  • Repost
  • Share
$ICP From a 2.629 short position in the layout, we are currently continuing to observe the trend, reaching a recent new high. Friends who followed along have taken profits on this wave. Strategy update: watch for take profit at high levels, with the target first set at subsequent key levels; execute stop-loss as planned to prevent pullbacks. The current price is not suitable for chasing again; those who haven't entered should wait and see, awaiting my next signal.
$BTC $ETH
ICP6.67%
BTC1.1%
ETH1.87%
View Original
post-image
  • Reward
  • Comment
  • Repost
  • Share
JUST IN: A ~2.6% Friday dip in the S&P 500 is framed as a routine pullback rather than a trend reversal, with history showing markets rebound and set new highs after major declines. $SPX
SPX7.22%
post-image
  • Reward
  • Comment
  • Repost
  • Share
$WLFI Previously, around 0.05777, we synchronized and notified about the previous brother's short position layout. The current decline logic is clear: main force continues to unload, buying interest weakens, and trading volume shrinks, indicating a clear bearish trend. The price has now fallen back to 0.05542, and the positions aligned with the layout have achieved a 2x profit. It is recommended that everyone manage profit-taking carefully, either by taking profits in stages or setting break-even stop-losses, to flexibly respond to subsequent market movements.
$BTC $ETH
WLFI-1.13%
BTC1.1%
ETH1.87%
View Original
post-image
  • Reward
  • Comment
  • Repost
  • Share
$SOL Signal] Bearish Sniper: 1H Divergence + Deep Imbalance
$SOL Negative Fee Rate -0.0174%, Deep Imbalance -3.43%, Clear gap in buy orders. Although 4H MACD shows a golden cross, volume is decreasing, and 1H MACD bars are contracting, indicating weakening bullish momentum. The current price is between the 1H Bollinger upper band at 64.42 and EMA50, with upward momentum exhausted.
🎯Direction: Short
⚡Entry/Order: 64.0174 - 64.2100
🛑Stop Loss: 64.8521
🚀Target 1: 63.2468
🚀Target 2: 62.7653
🛡️Trade Management:
- Execution Strategy: Reduce 50% of the position after reaching Tar
SOL2.2%
View Original
post-image
  • Reward
  • Comment
  • Repost
  • Share
🎯 $SAGA Short position wins big!
From 0.02284 → 0.01374, accurately predicting a 40% drop, those who followed directly gained 8 times+ 💰
📌 What to do now?
① Close the position first +1918.72%, lock in the profit;
② The remaining 20% bet on the trend, move the stop-loss up to the cost price;
③ Those who haven't entered the market, take a break first, wait for the next signal, there are many opportunities recently, not missing this one.
$BTC $ETH
SAGA2.7%
BTC1.1%
ETH1.87%
View Original
post-image
  • Reward
  • Comment
  • Repost
  • Share
$LAB Strong rally or just a trap for more buying?
A trap for more buying to push the price up, covering up a defeat:
Don’t be fooled by the so-called intraday reversal +31.64%! Currently, $LAB ’s price has forcibly rebounded to around $12.75, but this is just a precise “trap for more buying” after the main players’ big escape at the top. Just a few days ago, it plummeted from a sky-high price of $27.95 in a vertical drop, halving twice down to $8.46! The current rebound hasn’t even recovered half of the previous decline.
MA25 Mountain pressing down:
On the 4-hour K-line chart, the 25-pe
LAB32.29%
View Original
post-image
LAB Trend Analysis
Much
Empty
0 ParticipantsEnds In 9 Hour
  • Reward
  • Comment
  • Repost
  • Share
I paused for a moment when I just opened the market, $BAS This wave really has a bit of a takeoff vibe.
Earlier when I was watching the chart, the price was around 0.027874, I saw it accumulated at the low level for a while then surged with increased volume, the rebound signs were very clear, so I decisively reminded everyone to go long earlier.
Now the price has reached 0.031703, and the profit has reached +270.67%, this move has played out.
My suggestion is to take 70% of the profit first, and take the remaining 30% lightly, don’t give back what you’ve earned.
Don’t force it at this
BAS6.39%
BTC1.1%
ETH1.87%
View Original
post-image
  • Reward
  • Comment
  • Repost
  • Share
🚀 $APT As expected, it plummeted, from 0.952 to 0.6776, a drop of over 28.82%!
Friends who followed have gained +2045.18%, this is the power of trend-following shorting. 💥
⚠️ Latest instructions:
1 Suggest closing 80%, lock in profits;
2 Keep the remaining 20% to continue trend betting;
3 Move all stop-losses up to the cost price, prioritizing capital preservation.
Friends who missed out don’t need to chase orders, recent opportunities are dense, just wait for my next clear signal.
$BTC $ETH
APT3.38%
BTC1.1%
ETH1.87%
View Original
post-image
  • Reward
  • Comment
  • Repost
  • Share
GM ☀️
Will you say it back though?
post-image
  • Reward
  • Comment
  • Repost
  • Share
Load More