Share crypto content and earn up to 60% commissions through content mining.
placeholder
gatefun
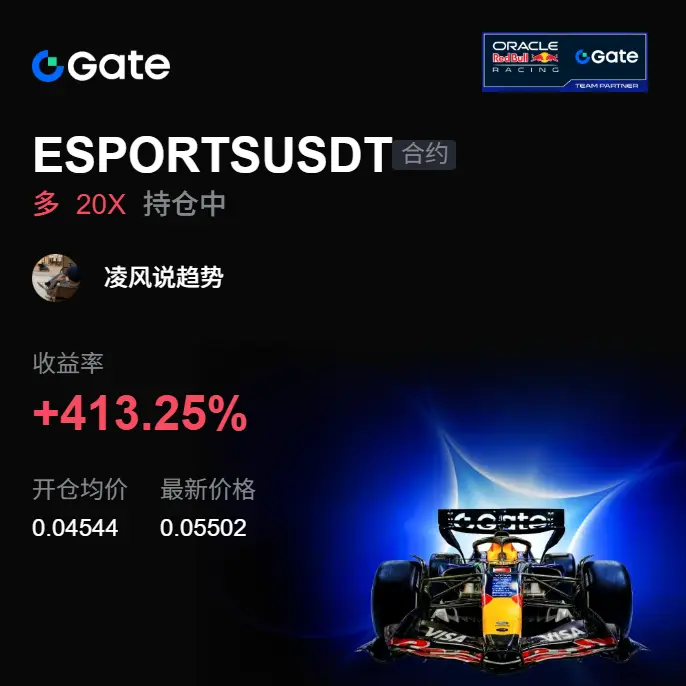
$DOT From 1.28, it indicated a high-level pullback to short, currently at 1.257, with cumulative gains reaching +127.49%. Previously, a partner made a profit of $16,900 in a single trade, congratulations to those who followed the operation. Trading suggestion: take profit on 80% at the current position to lock in gains, keep 20% in light position for subsequent key levels; set stop-loss according to plan, defend the key support below. Friends who haven't entered yet, do not chase now. For such highly volatile coins, be patient and wait for my next signals.
$BTC $ETH
DOT1.86%
View Original
post-image
  • Reward
  • Comment
  • Repost
  • Share
$HIGH This coin has been added to the major exchange watchlist. When will it be delisted?
HIGH-20.59%
View Original
post-image
  • Reward
  • Comment
  • Repost
  • Share
sol
Current trend: Volatile decline
Support below: 85
Strong support below: 86.3
Short-term resistance above: 83.6
Immediate strong resistance above: 81.3
SOL0.08%
View Original
post-image
  • Reward
  • Comment
  • Repost
  • Share
May 27, Wednesday, Zhongling Morning BTC/ETH Market Update
Bitcoin's price once fell below the bottom of the range at 76,000, but judging from the ongoing decline, it only dipped to around 75,600 before finding support and rebounding. The bearish momentum also clearly weakened during the volume increase, entering a consolidation phase. Ethereum's trend is basically consistent with Bitcoin.
Overall, the short-term market remains in a weak oscillation and correction stage. The rebound will first face resistance at the middle band of the Bollinger Bands. If it cannot break through effectively, th
BTC-0.89%
ETH-0.46%
SOL0.08%
HYPE3.68%
View Original
post-image
  • Reward
  • Comment
  • Repost
  • Share
What the heck is this? The bank sent me another loan text message. Industrial and Commercial Bank sent it at 8:24, and Bank of China sent it at 9:06. They said I have a credit limit of 300,000 that I can use for daily spending and for handling cash flow. How would they know I’m short on money? Did they install some monitoring plugin on my phone? They didn’t even give me a clear entry point for where to apply.
With a sum this large, I don’t dare to borrow it. I can at most borrow a few hundred on Jiebei. I wouldn’t even dare to think about borrowing several hundred thousand. This month, my Jieb
View Original
post-image
  • Reward
  • Comment
  • Repost
  • Share
$PHA Signal】Long + 1H pullback to EMA20 + Negative funding rate short squeeze expectation
$PHA 4H MACD bullish momentum slowing but no death cross, 1H price retraced near EMA20, buying interest densely accumulated around 0.0526.
Order book depth imbalance -14.54% indicates sellers' orders are thicker, funding rate at -0.0069% with negative value stacking, open interest stable, short positions' cost rising.
1H RSI at 54.41, neutral leaning lower, limited downside.
Short-term trading sentiment turning, risk-reward ratio still acceptable.
🎯Direction: Long
⚡Entry/Order: 0.0527513 - 0
PHA16.4%
View Original
post-image
  • Reward
  • Comment
  • Repost
  • Share
ETH Analysis$ETH
1. Today's direction: Consolidation trend
2. Current movement: Price is above the 1-hour Bollinger Band lower band and above MA5, with the Bollinger Band lower and upper bands opening downward
3. Resistance points above: 2140, short-term minor resistance point: 2100
4. Support points below: 2000, short-term minor support point: 2050
#美军打击伊朗
ETH-0.46%
View Original
post-image
  • Reward
  • Comment
  • Repost
  • Share
#USStrikesIran #USStrikesIran
The geopolitical landscape of the Middle East has once again entered a period of extreme uncertainty after reports surrounding began dominating global headlines. Financial markets reacted instantly, oil prices experienced sharp volatility, and investors across the world rushed toward safe-haven assets as fears of a broader regional conflict intensified. From Washington to Tehran, the tension is no longer being viewed as a temporary diplomatic dispute — analysts now describe the situation as one of the most dangerous geopolitical flashpoints in recent years. The po
BTC-0.89%
post-image
post-image
  • Reward
  • 2
  • Repost
  • Share
BlackBullion_Alpha:
Bull Run 🐂
View More
Yesterday ZEC was short at 630-572, losing 58 points in anger.
It steadily declined all the way down to a low of 561, and although it didn't catch the fish tail, the entire team stood up with full momentum. #股票交易挑战最高赢17000U
ZEC-9.37%
View Original
post-image
  • Reward
  • Comment
  • Repost
  • Share
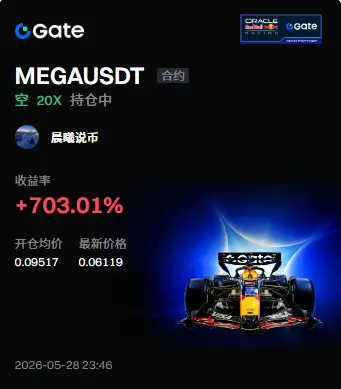
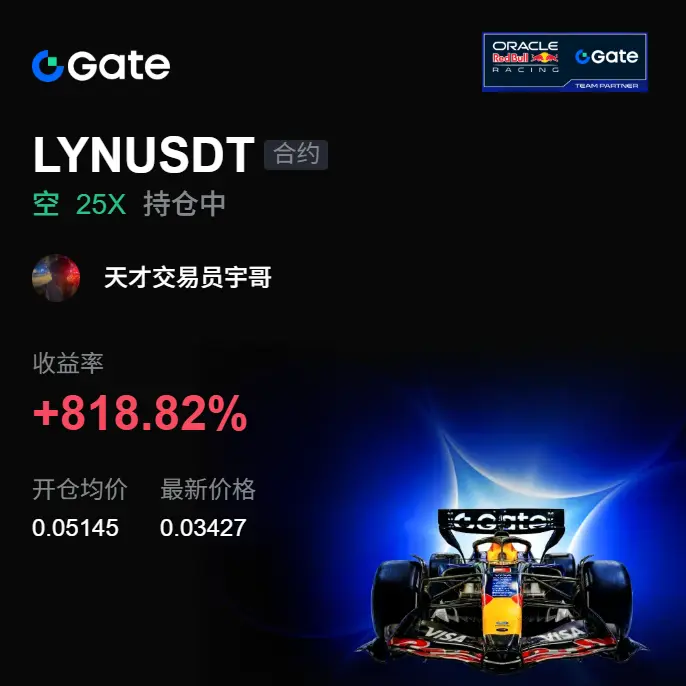
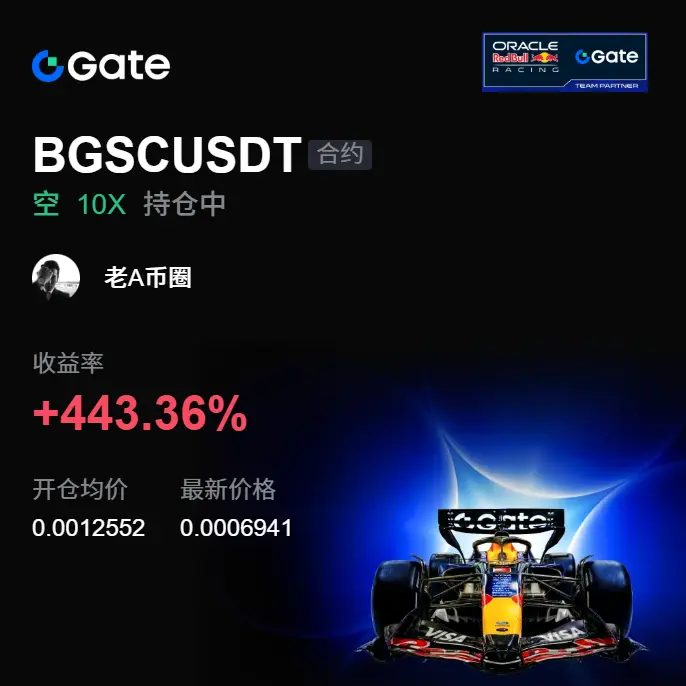
A few days ago, it was already announced in advance, $MEGA at a price of 0.09517 to directly go short. Currently, the market has fallen to 0.06937, with an overall profit of +533.78%! For those who followed the rhythm and entered the market, all have securely harvested profits. The current level is approaching the rebound point, so it is recommended to take profits and lock in gains first. Remember in trading, don't be greedy, don't chase the fish head or tail; the profits you have are the real gains. Friends who haven't yet followed the layout, please patiently wait. Precise signals will con
MEGA-4.2%
BTC-0.89%
ETH-0.46%
View Original
post-image
post-image
  • Reward
  • Comment
  • Repost
  • Share
#TradFi交易分享挑战
Deep Analysis of Today's International Oil Prices
On May 27, international crude oil (WTI) closed at $93.89 per barrel, Brent crude oil closed at $96.67 per barrel, with intraday fluctuations and a moderate increase in volume. Technical indicators show a consolidation and recovery pattern, with a tug-of-war between bulls and bears. In the short term, the market is influenced by a sharp drop in EIA inventories and ongoing U.S.-Iran negotiations, while in the medium to long term, geopolitical risk premiums and rising global refinery demand support prices. However, a strong dollar
BZ0.05%
View Original
post-image
LittleGodOfWealthPlutus
#TradFi交易分享挑战
Today’s In-Depth Analysis of International Oil Prices
On May 27th, international crude oil (WTI) closed at $93.89 per barrel, Brent crude oil closed at $96.67 per barrel, with intra-day fluctuations and a moderate increase in volume. Technical indicators show a consolidation and recovery pattern, with a tug-of-war between bulls and bears. In the short term, the market is influenced by a sharp drop in EIA inventories and ongoing U.S.-Iran negotiations, while in the medium to long term, geopolitical risk premiums and rising global refinery demand support prices. However, a strong dollar and market sentiment volatility limit upward potential.
Market Trends
Today, WTI opened at $93.39, briefly dipped to $91.68 in the early session, touching the previous day’s low support, then found buying interest around $92.50. In the afternoon, it gradually strengthened, reaching a high of $95.50, and closed at $93.89, with a daily range of 2.27%, a typical “bottoming out and rebound, range-bound oscillation” pattern. Brent crude oil moved in tandem, opening at $96.37, reaching a high of $97.20 during the session, and closing at $96.67, slightly stronger than WTI. The spread remained around $2.8. Volume increased by about 9% compared to the previous day, indicating renewed market participation without panic selling. From the weekly chart, oil prices have retraced about 10% from the high of $105 on May 18, but have not fallen below the key psychological level of $90, forming a gentle recovery channel characterized by “higher lows and oscillating higher highs,” with the trend intact and direction to be determined.
Technical Indicators
On the daily chart, the RSI (14) is at 48.35, in a neutral to slightly weak zone, not entering oversold or overbought territory, indicating market sentiment is not extreme, with bulls and bears approaching equilibrium; the MACD shows DIF at -0.01, DEA at 0.12, and the MACD histogram at -0.13, with green momentum bars gradually narrowing, indicating a clear weakening of bearish momentum. Although a golden cross has not formed, the MACD is approaching a “momentum inflection point,” signaling a shift from downward correction to oscillation. The Bollinger Bands show WTI trading above the middle band (93.50), with the upper band at 96.20 and the lower at 90.80. Bandwidth continues to narrow, volatility has fallen to near two-week lows, suggesting the market is entering a low-volatility consolidation phase. A volume breakout above the upper band could trigger a trend-following buy signal. Candlestick patterns show two consecutive “hammer” and “bullish engulfing” formations, hinting at a bottom reversal pattern and suggesting short-term bearish forces are exhausted.
Key Support and Resistance Levels
The current technical structure is clear, with support and resistance defined by price action, psychological levels, and Fibonacci retracements:
On the downside, the zone of $92.50–$93.00 is a dense trading area and coincides with the 5-day moving average, forming the first strong support. If broken, the price could fall toward $91.68, the recent low on May 26, which is also the lower boundary of the recent five-day volume cluster and the last line of defense for bulls. A further breach would see $90.00 as a critical psychological and 200-day moving average support zone since 2026, marking a long-term bull-bear dividing line.
On the upside, the resistance zone of $95.50–$96.00 is the recent high area, tested multiple times since May 20 without breaking through. A breakout above this zone could open space toward $97.50 (previous high resistance) and $98.50 (Fibonacci 61.8% retracement). If unable to break through, $95.00 may serve as a short-term high, potentially triggering technical corrections.
Based on the $91.68–$97.20 range:
- 38.2% retracement: $95.10 (current price just below this level)
- 50% retracement: $94.44 (current price slightly above)
- 61.8% retracement: $93.78 (current price nearly at this level)
The current price of $93.89 is above the 50% retracement, indicating bulls are gradually regaining control.
Market Outlook
In the short term, oil prices face technical resistance in the $95.50–$96.00 range. Without major positive catalysts (such as a renewed escalation in Middle East tensions, unexpected OPEC+ production cuts, or a significant decline in the dollar index), prices may continue to oscillate between $91 and $97, awaiting a directional move. However, technical signals show bearish momentum weakening and bulls gradually recovering, so a break above $96 could trigger trend-following buying, with potential targets of $98–$100.
In the medium to long term, geopolitical risk premiums remain the core driver: despite expectations that progress in U.S.-Iran negotiations might suppress prices, risks such as the Strait of Hormuz shipping disruptions and Iran’s high alert status could rapidly push prices higher if conflicts erupt. Additionally, the latest EIA data shows U.S. crude inventories decreased by 5.07M barrels, far exceeding the market expectation of 1.35 million barrels, providing solid fundamental support. The “short-term bullish, long-term bearish” strategy remains valid: in the short term, consider long positions above $90, and monitor the negotiations’ progress by month-end; in the long term, consider short positions above $100 with profit targets around $80.
repost-content-media
  • Reward
  • Comment
  • Repost
  • Share
Ebola virus🦠 is it really the way to eat it in the video?
A 40% fatality rate! Alerts have been sounded in 10 countries! The largest outbreak to date!
Currently, there are no approved vaccines, nor any specific treatments.
Since Ebola was discovered in 1976, this strain has only appeared twice before, in 2007 and 2012; this is the third time.
Why has Ebola gotten so out of control?
On one hand, the public's lack of attention, extreme distrust of local governments, refusal to cooperate with antiviral quarantine treatments, believing it's a government scam, and wanting to use them for
View Original
post-image
  • Reward
  • Comment
  • Repost
  • Share
Performance-wise!
It still depends on the zoo.
View Original
  • Reward
  • Comment
  • Repost
  • Share
JUST IN: Nikkei +1.36% and KOSPI +2.43% at open. If equities follow, crypto risk-on could extend gains on risk sentiment, especially for altcoins and BTC pairs. $BTC $ETH
BTC-0.89%
ETH-0.46%
post-image
  • Reward
  • Comment
  • Repost
  • Share
Trends that haven't been defined are meaningless!
View Original
  • Reward
  • Comment
  • Repost
  • Share
$DRIFT Signal] Long | Funding rate extremely negative, short squeeze logic activated
$DRIFT Funding rate -1.0173%, bears crowded but price stubbornly holds at 0.0455, 1H Bollinger upper band at 0.0467 not broken but rejected the pullback. 4H MACD histogram still expanding, buying pressure accounts for 43% but resists selling pressure, this combination of negative funding rate + firm price has historically triggered accelerated short squeezes multiple times. Current risk-reward ratio is 1.5, making it worthwhile to set a small stop-loss and gamble for an upward pulse.
🎯Direction: Long
⚡E
DRIFT30.55%
View Original
post-image
  • Reward
  • Comment
  • Repost
  • Share
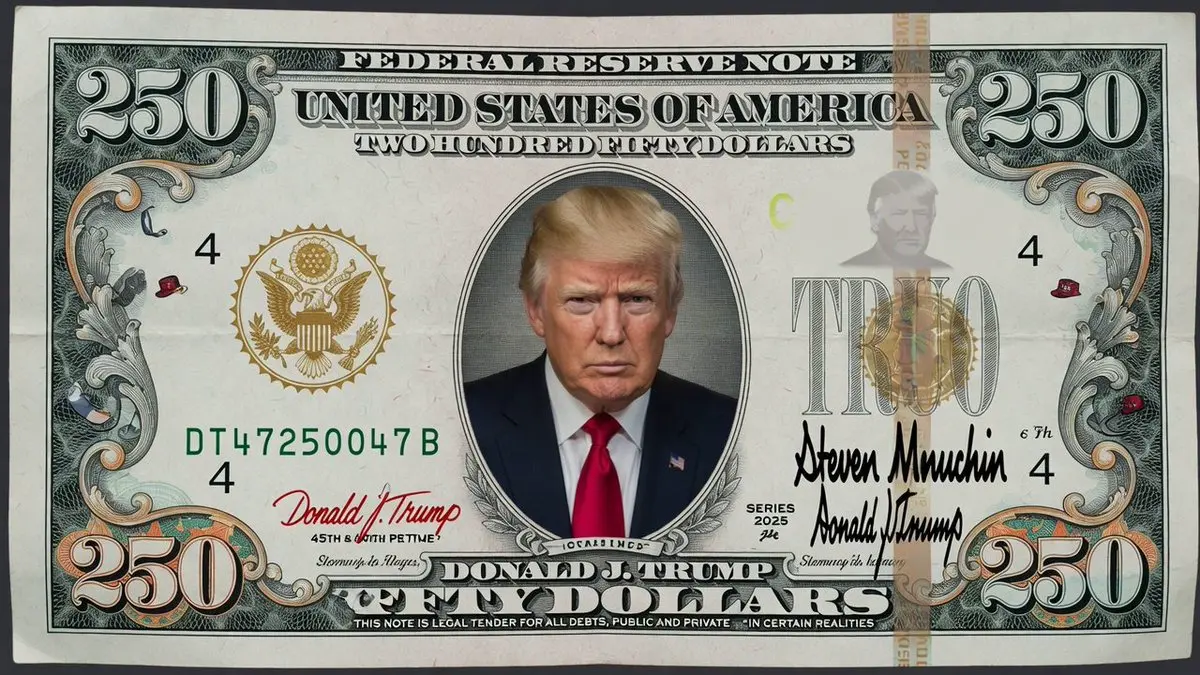
Everyone says Trump is the president who supports the crypto world the most. After taking office, he issued two coins
solana:6p6xgHyF7AeE6TZkSmFsko444wqoP15icUSqi2jfGiPN and solana:WLFinEv6ypjkczcS83FZqFpgFZYwQXutRbxGe7oC16g both dropped dozens of times. When short on money, come to the crypto world to make some.
Then, as liquidity was almost drained, several major exchanges in the crypto world started listing on the US stock market. The president indeed loves cryptocurrencies the most. 😂😂
SOL0.08%
View Original
post-image
post-image
  • Reward
  • Comment
  • Repost
  • Share
Ethereum Today Analysis 2026.5.27
ETH is still fluctuating after the sharp decline, range 2050-2130, and the bearish momentum remains strong
Resistance levels: 2400, 2160, 2600 Support levels: 2100, 2000, 1800
Long entry: Consider going long around 2020, add positions near 2000
Stop loss: Break below 1980 effectively
Take profit: Near 2130, long positions are not recommended for pattern
Short entry: Establish short positions around 2130, add positions near 2180
Stop loss: Break above and stabilize at 2200
Take profit: First take profit near 2000, if the decline is smooth, reduc
ETH-0.46%
View Original
post-image
  • Reward
  • Comment
  • Repost
  • Share
Remember, remember, remember!
Do not transfer the money withdrawn from @_Global directly to other exchanges!
Otherwise, it will trigger an audit or even freezing!
View Original
  • Reward
  • Comment
  • Repost
  • Share
Ethereum Analysis Today 2026.5.27
ETH is still fluctuating after the sharp decline, range 2050-2130, and the short position pressure remains strong
Resistance levels: 2400, 2160, 2600 Support levels: 2100, 2000, 1800
Long entry: Consider going long around 2020, add positions near 2000
Stop loss: Break below 1980 effectively
Take profit: Near 2130, long positions are not recommended for a pattern
Short entry: Establish short positions around 2130, add positions near 2180
Stop loss: Break above and stabilize at 2200
Take profit: First take profit near 2000, reduce positions durin
ETH-0.46%
View Original
post-image
  • Reward
  • Comment
  • Repost
  • Share
Load More