Square
Following
Hot
News
Notifications
Profile
Share your thoughts
placeholder
Article
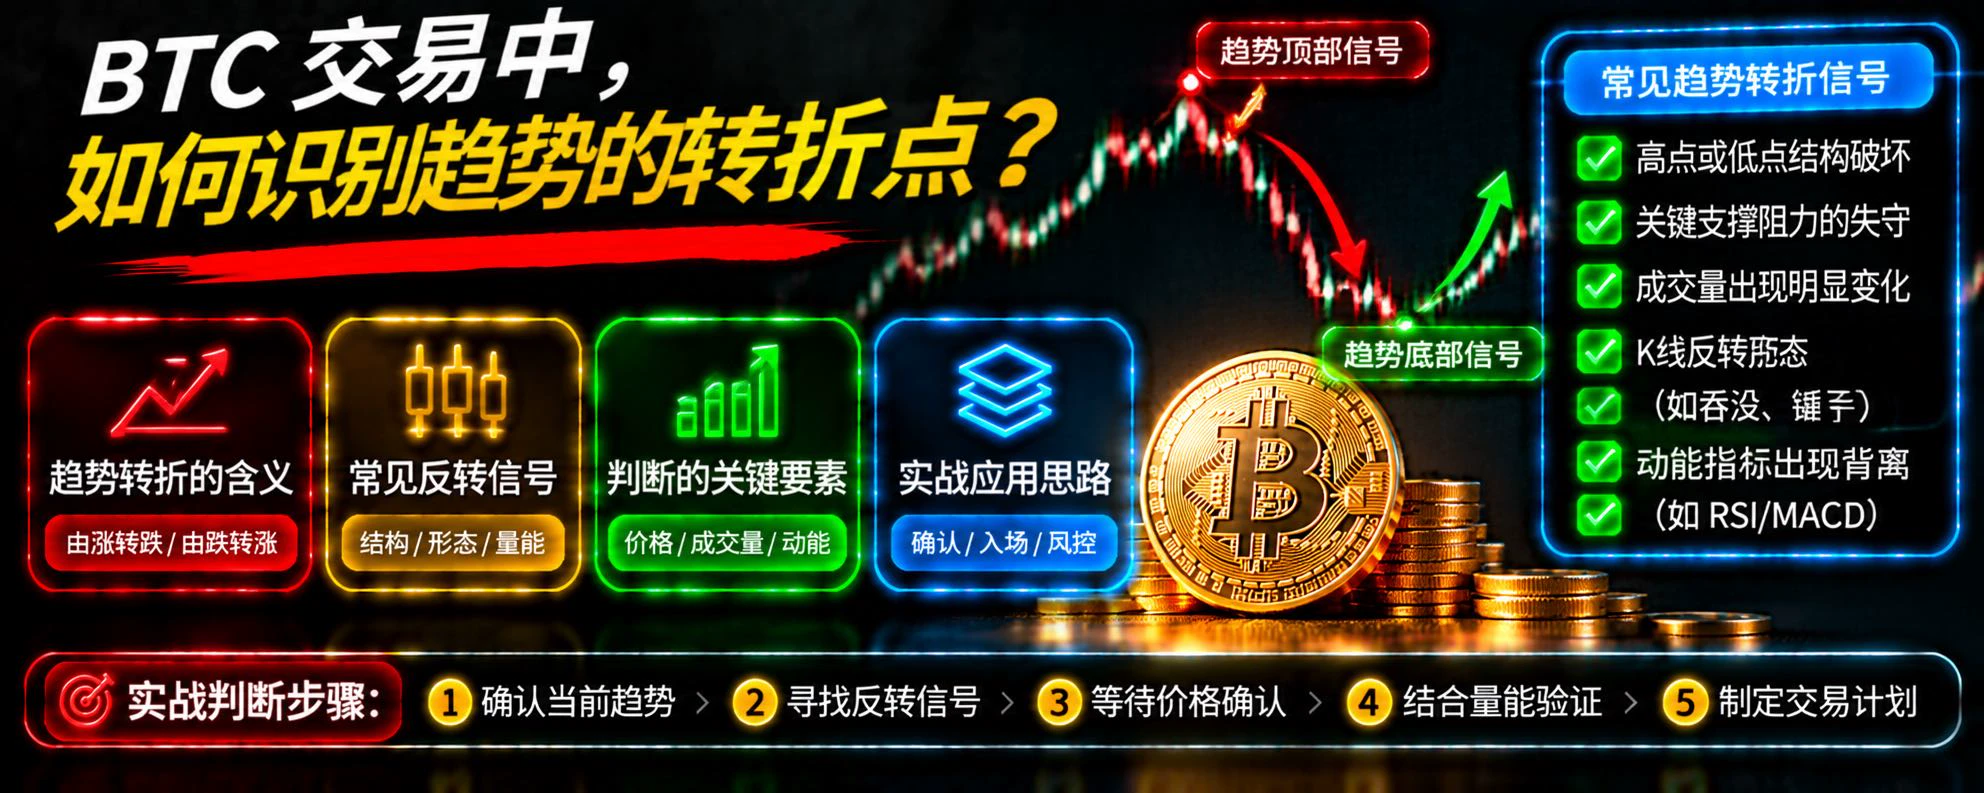
How to Identify Trend Reversals in BTC Trading?

In BTC trading, what many people most want to do is buy before an uptrend begins and sell before a downtrend starts. But the real challenge is that a price rebound does not necessarily mean the trend has reversed, and a sudden drop does not necessarily mean the bull market is over.

So, how can you identify a genuine trend reversal?

First, watch the structure of highs and lows. An uptrend typically forms a series of higher highs and higher lows. If the price fails to make a new high and starts breaking below a previous significant low, be alert
post-image
BTC-0.67%
#CPI数据前瞻 October CPI is expected to be released around 9:30 Beijing time on November 11. The market broadly expects inflation to cool, so weak data may have a limited impact; only hotter-than-expected figures are likely to trigger significant volatility.

How BTC, U.S. stocks and gold could react under three scenarios
·In line with or slightly below expectations: Rate-hike expectations are unlikely to change much. U.S. stocks may trade unevenly, while gold and Bitcoin may see a muted reaction.
Headline inflation elevated, core inflation cooling: The market may think the Fed can wait and see. T
BTC-0.67%
SPX500+0.19%
NDAQ+0.28%
Trenches
ZIG
Z
bade
b
ZIG
0x8c...1145
Market Cap
$.
Change
.
24h Vol
$.
Holders
.
STONK
S
bade
b
STONK
6GmA...UNgx
Market Cap
$.
Change
.
24h Vol
$.
Holders
.
IDOL
I
bade
b
IDOL
0x3b...ab07
Market Cap
$.
Change
.
24h Vol
$.
Holders
.
CLAUDIA
C
bade
b
CLAUDIA
2j5S...W2ZM
Market Cap
$.
Change
.
24h Vol
$.
Holders
.
MAGGIE
M
bade
b
MAGGIE
8rHo...PmZV
Market Cap
$.
Change
.
24h Vol
$.
Holders
.
#GateSquareTradingChallenge
#ShareMyFuturesReturn

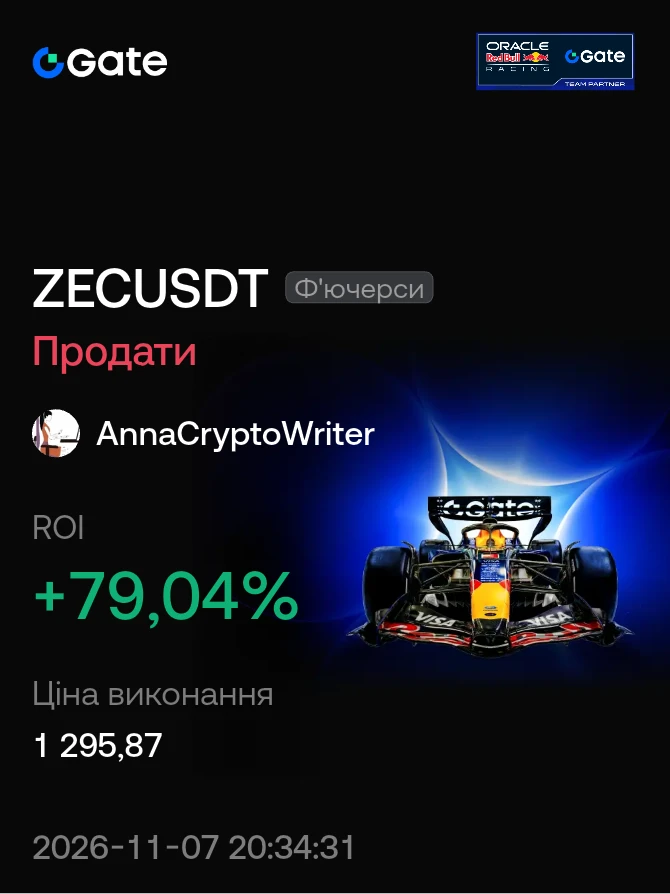
ZEC/USDT brought me a very nice result today! 📈 I opened a long position and secured a profit of 9.72 USDT with a return of 79.04 %. The average entry price was 1,295.87 USDT. I'm happy with this outcome, especially considering how quickly market conditions can change. Moments like this remind me how important it is to recognize potential upward movements and find good entry opportunities. Even a relatively short price move can bring a solid profit.

Now I'm curious to see whether ZEC has enough strength to continue its upward move. I would
post-image
ZEC+1.29%
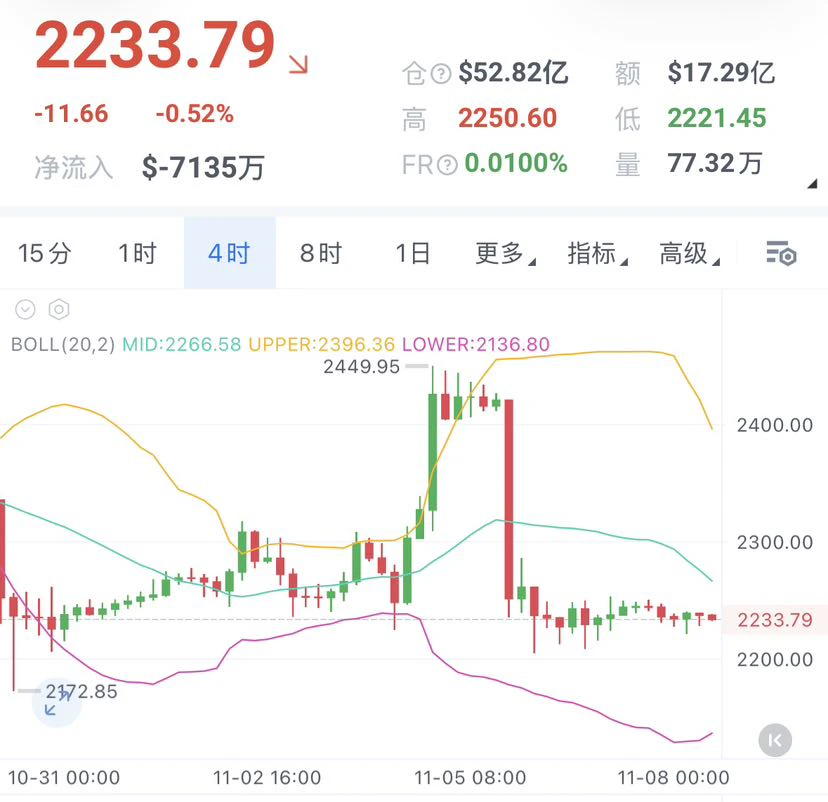
Tong Ge's 11.8 ETH outlook
$ETH Short around 2250-2270, stop loss at 2290, targets: 2210-2180-2150.

After the nearly 500-point A-shaped crash a few days ago, ETH has clearly lost momentum over the past two days, grinding back and forth within a range of just 20 to 30 points.
Seeing that it has stopped falling, many people are starting to wonder if the bottom is in, with their hands already reaching for the buy-the-dip button.
A reminder from Tong Ge: the fact that it has stopped falling doesn't mean it's ready to rise.
Looking at the charts, the 1-hour Bollinger Bands continue to contract, an
post-image
ETH-1.23%
#美股AI板块遭遇重挫 #每周来晒 This latest sell-off in U.S. AI stocks was a deleveraging-driven rout, but the AI trade has entered a deeper correction. From here, tech giants with stable cash flows look more attractive, while chip stocks need to be repriced based on valuations and expected returns.

Why it’s about more than deleveraging
The trigger was political: Democrats won both chambers, raising market concerns about tighter data center permitting and power-use regulations.
AI investment returns are being reassessed: Five cloud providers spent $556.9 billion on capital expenditures in the first nine m
NVDA+2.80%
MSFT-0.95%
INDEX+0.00%
SPX500+0.19%
XAU+0.38%
EVENT CONTRACT
live-cover
LIVE2,537
BTC Trading Psychology: How to Control Greed and Fear?
In BTC trading, many people don't lose to the market—they lose to their own emotions. They may have a trading plan in place, yet often chase prices after a sudden rise and panic-sell after a brief drop. Repeating this behavior over and over makes it difficult to achieve ideal trading results, even with solid technical analysis skills.
First, beware of greed. When BTC rises continuously, many people fear missing out and start chasing prices higher, even adding to their positions beyond their original plan. But an uptrend doesn't mean prices
post-image
BTC-0.65%
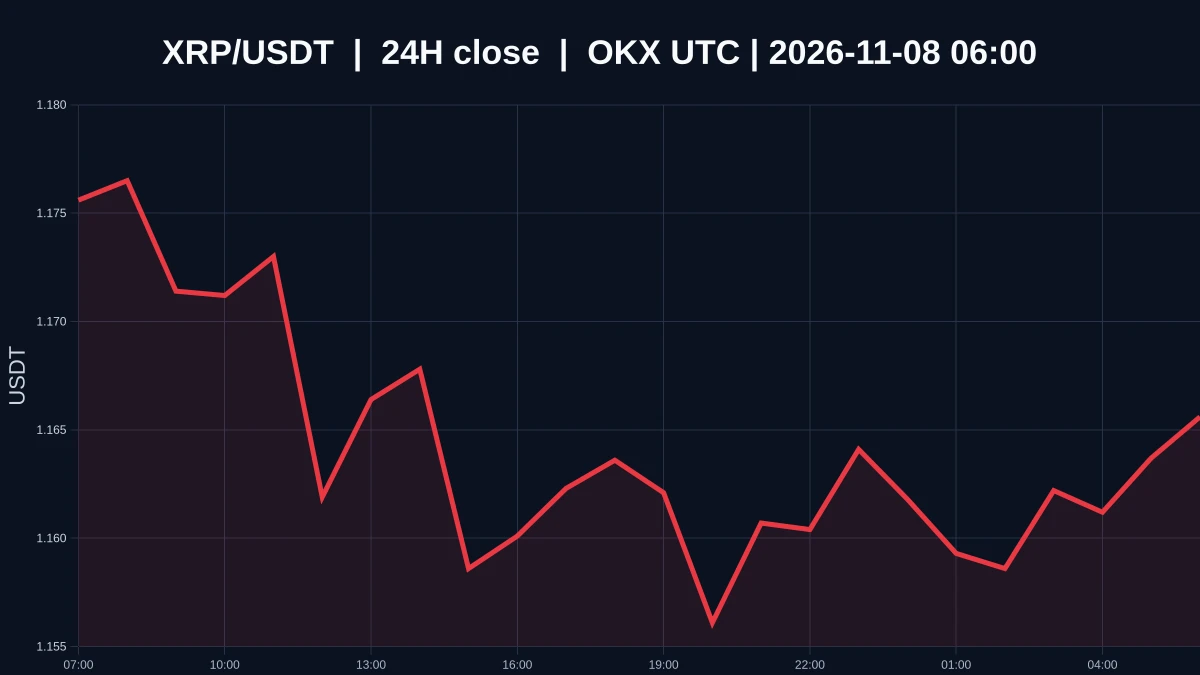
$XRP ’s 1-hour and 4-hour charts give opposite signals. Which one is more reliable?

$XRP is currently priced at 1.1659, up 0.37882049074471347% over the past 24 hours, with an intraday high of 1.1821 and low of 1.1495. The 1-hour trend is bullish, while the 4-hour trend is bearish. The volume ratio is 0.0759448457701905. The short-term trend has turned bullish, but the broader trend remains bearish. This means the market has yet to establish a clear direction; the shift has appeared only on a shorter time frame so far.

On the 1-hour chart, support is at 1.1495 and resistance is at 1.1821. At
post-image
XRP-1.15%
#70%OfAltcoinsFallBelow200DMA
70%. Let me say the number first, then we can talk about what it means.

In an analysis dated November 7, about 70% of listed altcoins were trading below their 200-day average. So 7 out of every 10 altcoins are below their long-term average. Only about 30% are left above it. The same analysis says that, with Bitcoin and stablecoins left out, altcoin market value has melted about $200 billion from its peak.

Why do I care about this number, because the 200-day average is not a short-term line. When a coin drops below its 200-day average, we do not say "it fell to
post-image
BTC-0.67%
牛来-1.82%
AEON-9.26%
HINT+0.63%
MOVE-1.45%
  • 1
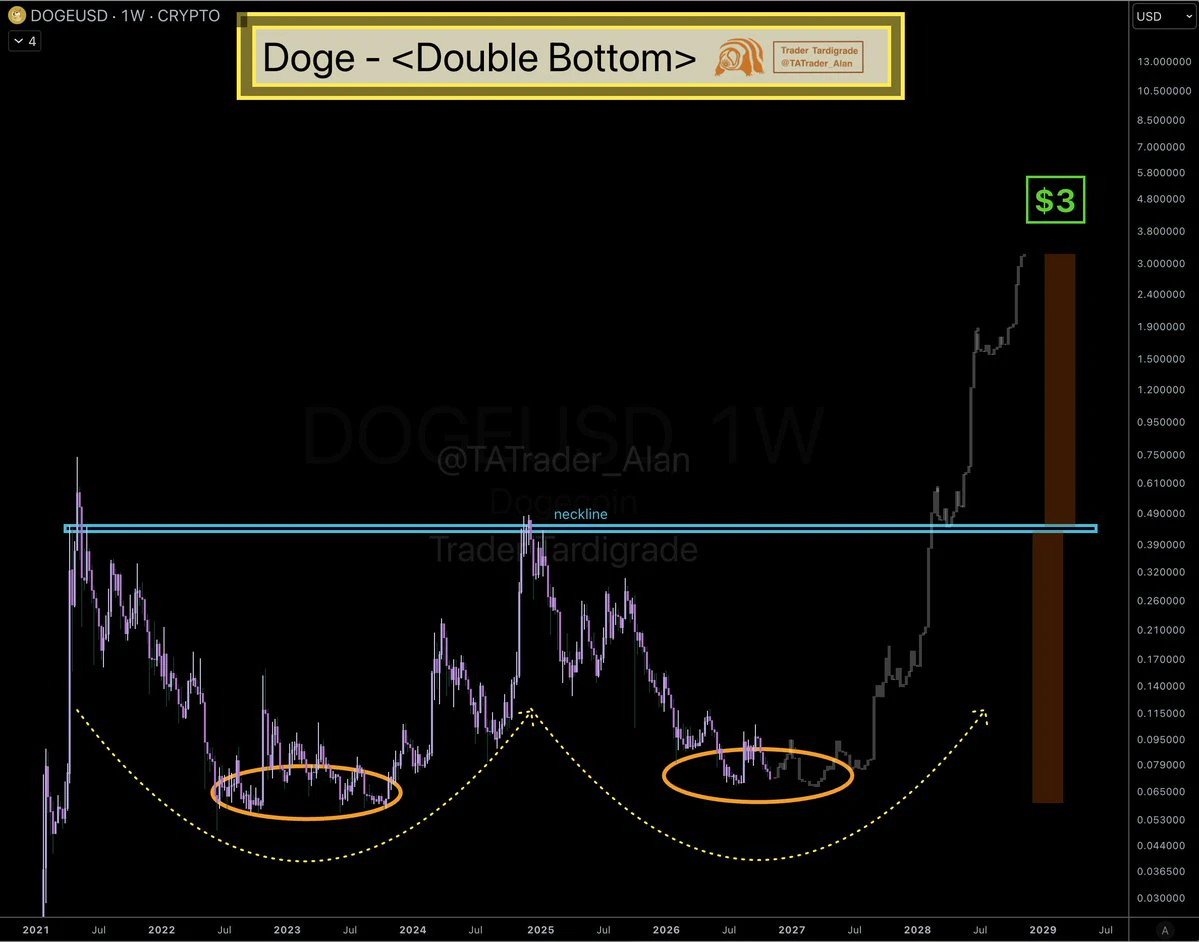
$Doge Double Bottom forming
✍️ $3 target still in play, no change
post-image
DOGE-0.22%
$ACT Short-term alert—sellers are back‼️$ACT Facing strong resistance near $0.0130, momentum is weakening. A break below $0.01120 could trigger another decline! Entry: $0.01120 – $0.01150Targets: $0.01100 / $0.01050 / $0.01000Stop-loss: $0.01195For reference only; this is not financial advice. Please manage your risk.
post-image
ACT-1.19%
BTC News Analysis: How Can Market News Improve Trading Decisions?
In BTC trading, many people study candlestick charts, MACD, and RSI every day, yet overlook an important factor that can significantly affect market movements: news.
Sometimes, BTC suddenly rises or falls in a short period, not because technical indicators signaled it in advance, but because of new policies, economic data, or changes in capital flows. Shifts in the news can quickly change investor expectations and, in turn, affect the balance between buyers and sellers.
So, how should you use news analysis when analyzing BTC?
Fi
post-image
BTC-0.67%
[NEW STREAMER]market update💕
live-cover
LIVE2,201
#Gate股票畅聊季 U.S. stocks shed over $4 trillion in a week. When will the data center panic end?

Wall Street endured another turbulent week, with the combined market capitalization of the three major U.S. stock indexes falling by about $4.1 trillion.
The market panic stems from Democrats taking control of both chambers of Congress after the U.S. midterm elections. Investors fear tighter regulation of the artificial intelligence (AI) industry and slower approvals for data center construction, triggering a concentrated sell-off in tech stocks. Treasury yields surged after the latest nonfarm payroll
SPX+0.33%
JPMG+0.82%
HSBC-0.62%
  • 1
#StakeOnLaunchpoolToShare450KVLX Here is a professional, engaging Gate-style post for the VLX Launchpool campaign, written in a natural human tone with market-focused analysis.
🚀 **450,000 VLX REWARDS ARE UP FOR GRABS! Is This Your Opportunity to Join the Next Launchpool Campaign?**
The crypto market is constantly creating new opportunities, and one of the most interesting ways to participate in emerging token ecosystems is through launchpool campaigns. This time, the spotlight is on VLX, with a total reward pool of **450,000 VLX** available for eligible participants through the Gate Launchpo
post-image
VLX+0.00%
📉 US AI STOCKS HIT HARD — INVESTORS REASSESS THE AI RALLY

US artificial intelligence stocks are facing renewed selling pressure as investors reassess elevated valuations, earnings expectations and the sustainability of the massive capital spending cycle surrounding AI.

After a powerful period of gains across the technology sector, the latest weakness highlights an important reality: even the strongest AI companies remain sensitive to valuation concerns, market positioning, interest rates and changing expectations around future growth.

🔻 Why Are AI Stocks Under Pressure?

The AI trade has
Is a Company Worth Buying? Don’t Just Look at Its Share Price—The Real Story Comes Later!

When investing in stocks, the worst situation is seeing a share price fall like it’s on sale and getting excited as if you’ve struck gold. Then, after buying in, you realize it’s not the stock that’s cheap—it’s the market’s expectations for it!
When I’m bullish on a company, I focus on three signals first.
First, does it have real earnings power? Revenue growth is just an appetizer; profit growth and improving cash flow are the main course. If reported profits look good but operating cash flow remains we
NVDA+2.80%
  • 31
‍#每周来晒 #广场交易达人 #WCTCS9

Crude Oil Outlook for Next Week

Crude oil plunged last week amid hopes that U.S.-Iran tensions would ease, falling more than $15 over the week and officially forming a double-top pattern. For medium-term trading, the focus should now be on short positions, but after the sharp short-term decline, a rebound is also likely, so the short-term focus should be on long positions:

I. Technical Analysis

After last week's decline, the double-top pattern has been confirmed in the broader trend. On the daily chart, after rebounding with a bullish candle on Thursday, prices pull
post-image
XBRUSD-1.42%
  • 5
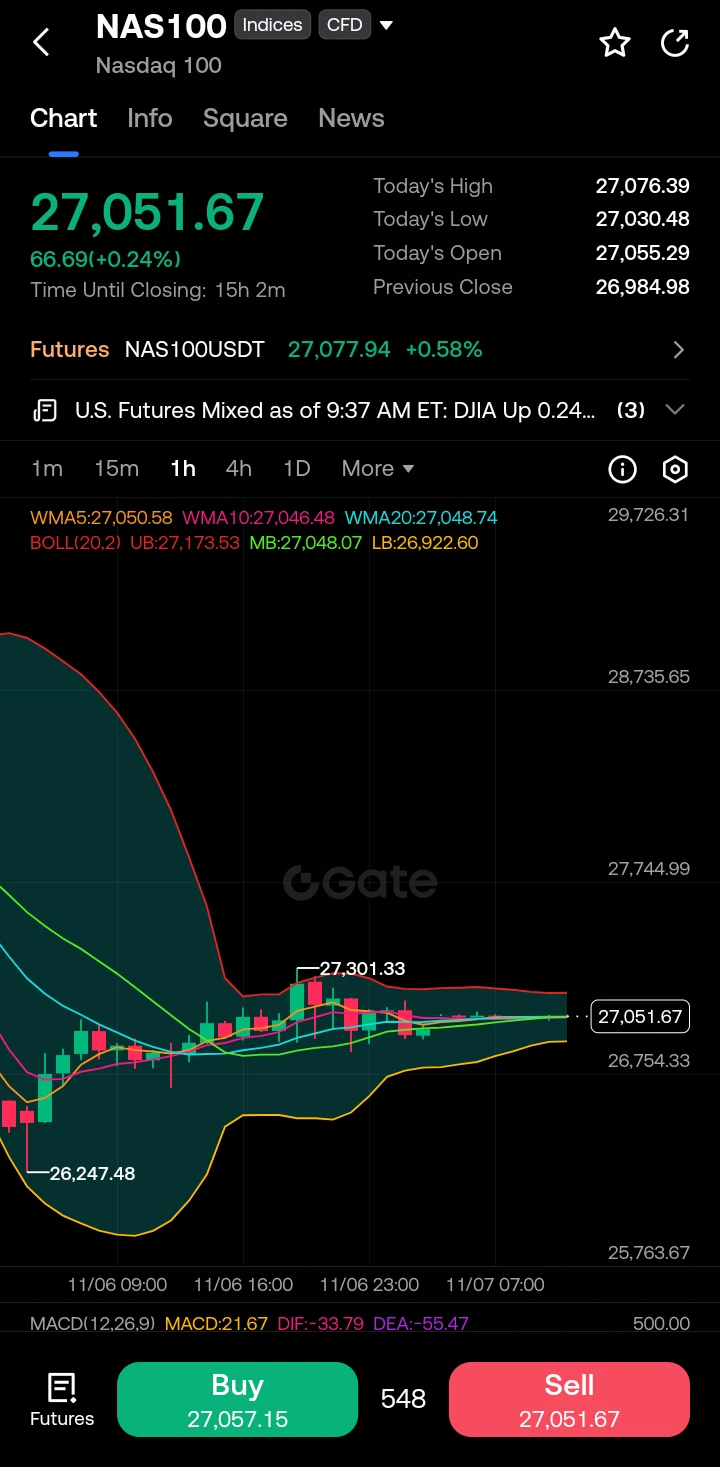
NAS100 1H Structure & Bias
$NAS100 ‌
Price sits at 27,051.67, tightly coiled at the confluence of WMA5 (27,050.58), WMA10 (27,046.48), WMA20 (27,048.74) and Bollinger middle band (27,048.07).

Upper band resistance sits at 27,173.53. Lower band support at 26,922.60. Local swing high marked at 27,301.33; prior swing low at 26,247.48.
MACD (12,26,9) shows histogram positive at +21.67 while DIF (-33.79) remains above DEA (-55.47).

Momentum has shifted from deep negative territory and is attempting to cross higher on the 1H.

Key Observations.

Price is mean-reverting after the rejection from 2
post-image
NAS100-0.07%
Load More

Join 40 M users in our growing community

⚡️ Join 40 M users in the crypto craze discussion

💬 Engage with your favorite top creators

👍 See what interests you

Trending Topics

USCPIDataIncoming

4.16k Views1.53k Discussing

The U.S. October CPI report will be released on November 10 at 8:30 a.m. ET. September CPI came in at 3.7% year over year, and markets will be watching closely for signs that inflation is cooling, especially in core CPI. A softer-than-expected reading could strengthen rate-cut expectations, while hotter inflation may pressure risk assets through higher Treasury yields and a stronger dollar. How do you think this CPI print will move $BTC, U.S. stocks and gold?

USAIStocksHitHard

24.99k Views3.71k Discussing

USNonfarmPayrolls

44.93k Views4.44k Discussing

View More