For crypto day traders and swing traders, combining Stochastic RSI with trend direction and support levels can help refine entry timing. The challenge is distinguishing a temporary momentum reset from a developing trend reversal.
Key Takeaways
-
Stochastic RSI measures where current RSI sits within its recent range, making it more sensitive than standard RSI.
-
A bullish re-entry setup often develops when Stoch RSI moves below 0.20 and produces a bullish crossover near support.
-
Trend direction, moving averages, price structure, and trading volume help filter unreliable signals.
-
Traders should wait for price confirmation instead of entering immediately when Stoch RSI becomes oversold.
-
Strong trends can keep momentum indicators near extreme levels, making risk management essential.
How Stochastic RSI Identifies Pullback Re-Entries
Stochastic RSI, also called Stoch RSI or StochRSI, is a technical analysis indicator that applies the stochastic oscillator formula to Relative Strength Index (RSI) values rather than standard price data.
Developed by Tushar Chande and Stanley Kroll and introduced in their 1994 book The New Technical Trader, StochRSI was designed to increase sensitivity when identifying overbought and oversold conditions.
The Relative Strength Index measures the speed and magnitude of price movements. Stochastic RSI takes a different perspective by measuring the current RSI reading relative to its recent highest and lowest values.
That makes Stochastic RSI two calculation steps away from actual price.
As TradingView's Stochastic RSI documentation explains, this increased sensitivity produces more frequent signals but can temporarily disconnect indicator movement from price behavior.
For pullback trading, that sensitivity can be useful. A short-term momentum reset may appear before price resumes its broader trend.
The catch? A momentum reset doesn't automatically mean buyers are returning.
Stochastic RSI Formula, Settings, and Overbought Oversold Levels
The StochRSI formula compares current RSI with its highest and lowest readings over a predefined range.
StochRSI = (Current RSI − Lowest RSI) / (Highest RSI − Lowest RSI)
A common configuration uses a 14-period RSI, a 14-period stochastic lookback, and three-period smoothing for the %K and %D lines.
Raw StochRSI oscillates between 0 and 1, although some charting platforms display an equivalent 0–100 scale.
| StochRSI Value |
Momentum Interpretation |
| Below 0.20 |
Oversold conditions; possible bearish momentum exhaustion |
| 0.20–0.50 |
Lower momentum range |
| 0.50–0.80 |
Improving bullish momentum |
| Above 0.80 |
Overbought conditions; strong upward momentum |
The fast %K line tracks smoothed StochRSI movement, while the slower %D line acts as its signal line.
A bullish crossover occurs when %K crosses above %D. A bearish crossover occurs when %K falls below %D.
Smoothing can reduce the StochRSI oscillator's volatility, but excessive smoothing delays signals. Shorter settings improve responsiveness while increasing noise.
Unlike traditional RSI levels of 70 and 30, StochRSI commonly uses 0.80 and 0.20 for identifying overbought or oversold conditions.
These thresholds describe relative momentum, not guaranteed turning points.
How to Use Stochastic RSI for Bullish Re-Entries
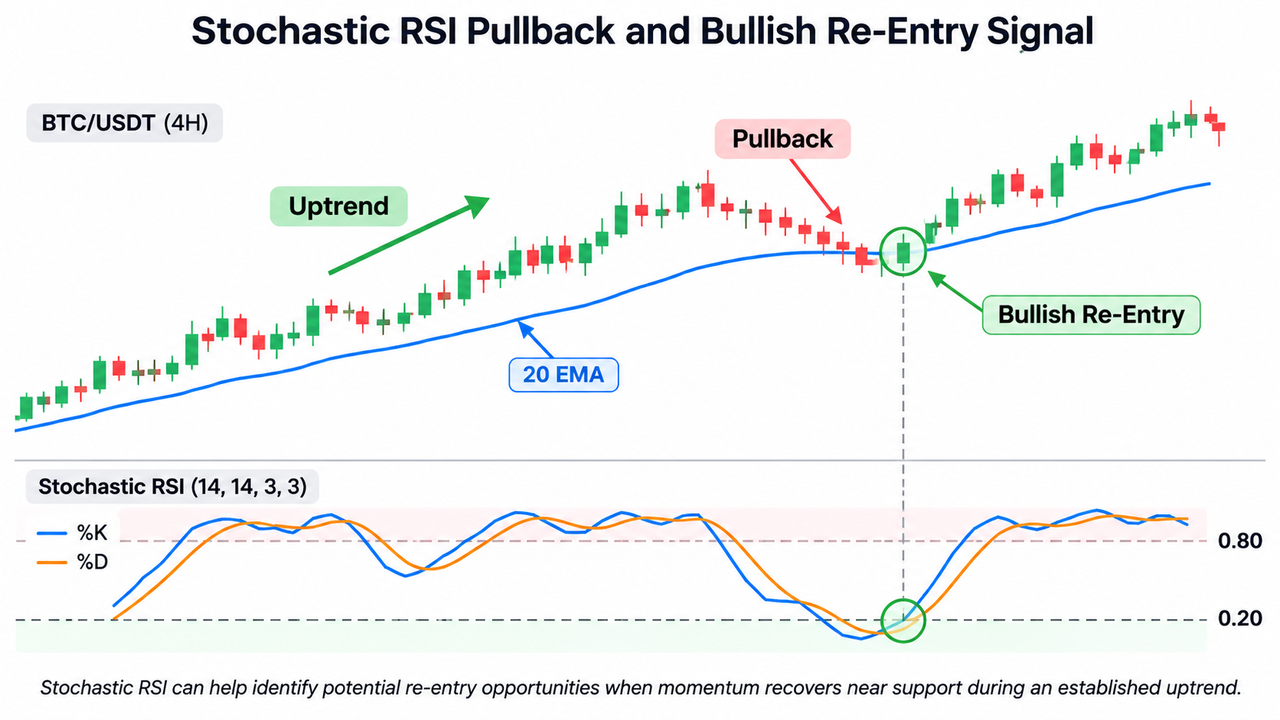
A bullish Stochastic RSI re-entry setup combines an established uptrend, a pullback toward support, and renewed buying momentum.
Step 1: Confirm the Main Uptrend
Start by checking whether price is producing higher highs and higher lows.
A rising 20-period or 50-period moving average can support the trend assessment. Traders may also use ADX and ATR together to distinguish directional strength from volatility.
If price repeatedly breaks important swing lows, the apparent pullback may represent a genuine downtrend.
Step 2: Identify a Pullback Toward Support
Look for price retreating toward an established support zone, such as previous resistance-turned-support, a rising moving average, or a recent breakout level.
An EMA and VWAP pullback strategy can help establish whether price remains near meaningful intraday support.
Ideally, the pullback develops without invalidating the broader bullish market structure.
Step 3: Watch Stoch RSI Enter Oversold Territory
When StochRSI drops below 0.20, short-term RSI momentum is near the bottom of its recent range.
This suggests a possible momentum reset, but traders shouldn't enter simply because the indicator touches oversold levels.
Wait for the fast %K line to cross above the slower %D line, preferably as the oscillator begins recovering from oversold territory.
Step 4: Confirm the Re-Entry With Price Action
A bullish crossover becomes more useful when price closes above a recent minor swing high, produces a higher low, or forms a convincing bullish candle near support.
Volume can provide another layer of confirmation. Buying and selling pressure helps assess whether the bounce reflects meaningful participation.
Traders can also use multiple timeframe analysis to align short-term momentum recovery with the larger trend.
Step 5: Define Risk Before Entering
Place the trade's invalidation level below a relevant swing low or established support area, allowing for normal market volatility.
ATR can help assess whether the proposed stop-loss is unusually tight.
Position size should reflect the distance between entry and stop-loss, while potential reward should justify the risk.
Practical Stochastic RSI Re-Entry Example
Suppose Bitcoin is trending higher on the four-hour chart, making successive higher highs and higher lows.
After reaching $100,000, BTC pulls back toward a rising 20-period EMA near $97,000.
During the correction:
-
Stochastic RSI falls below 0.20.
-
Price holds above the previous higher low.
-
The %K line crosses above %D.
-
A bullish candle closes above a minor resistance level at $97,500.
A technical trader might consider $97,500 the confirmation threshold, with a stop-loss below the recent swing low and a potential target near previous resistance.
These prices are hypothetical, not live market data.
For example, a trader using the BTC/USDT spot market on Gate.com can compare current candles, trading volume, and support levels before assessing a similar setup.
If price breaks support before confirmation, the original re-entry thesis weakens.
Combining Stochastic RSI With Other Technical Indicators
StochRSI works best when other technical indicators answer different questions.
| Indicator |
Role in Re-Entry Trading |
| Moving Average |
Identifies trend direction and dynamic support |
| ADX |
Measures directional trend strength |
| MACD |
Evaluates broader market momentum |
| Volume |
Assesses participation behind a recovery |
| Accumulation/Distribution Line |
Tracks price-volume pressure over time |
| Stochastic RSI |
Refines short-term momentum timing |
For example, MACD momentum analysis can help determine whether broader momentum remains constructive while StochRSI resets.
Bullish divergence offers another possible signal. It occurs when price makes a lower low while Stochastic RSI makes a higher low.
Still, divergence doesn't prove that a reversal has started. Price confirmation remains necessary.
Common Stochastic RSI Trading Mistakes and False Signals
Stochastic RSI generates more trading signals than traditional indicators because it responds rapidly to changes in RSI values.
This sensitivity can create bad signals, particularly in sideways markets.
Common mistakes include entering immediately at oversold levels, ignoring the main trend, treating every crossover as reliable, and repeatedly adjusting indicator settings after losing trades.
StochRSI can remain overbought during strong upward movement or oversold during persistent selling. Standard RSI can also remain at extreme levels for extended periods.
In a downtrend, traders sometimes reverse the approach by watching for overbought readings and bearish crossovers near resistance. Short selling introduces additional risks, especially when leverage is involved.
The CFTC's guidance on speculative trading risks emphasizes the dangers associated with leverage, unfamiliar markets, and short-term speculation.
A paper trading account allows traders to assess signal frequency, false entries, and stop-loss behavior before risking capital.
Conclusion
Stochastic RSI re-entry strategies work by combining momentum resets with an established trend, relevant support, and price confirmation.
The oscillator's greatest strength is sensitivity. Its main weakness is the same: frequent signals can tempt traders into premature entries.
Used alongside market structure, volume, and a consistent trading system, StochRSI can help refine pullback timing. Used alone, it cannot reliably distinguish temporary corrections from larger reversals.
FAQ
What is the best Stochastic RSI setting for re-entry trading?
The 14-period RSI, 14-period stochastic calculation, and 3-period smoothing settings for both %K and %D are common starting points. Shorter settings generate faster signals, while longer settings may reduce noise at the cost of responsiveness.
Should traders buy whenever Stochastic RSI becomes oversold?
No. An oversold reading below 0.20 indicates RSI is near the bottom of its recent range, not that price has reached a bottom. A bullish crossover supported by price action and trend direction provides a more complete setup.
Is Stochastic RSI better than RSI for pullback entries?
Stochastic RSI is generally more sensitive, making it useful for short-term entry timing. Standard RSI is smoother and may provide clearer broader momentum context. Neither indicator is consistently superior across all market conditions.
Can Stochastic RSI identify bearish re-entry opportunities?
Yes. During an established downtrend, traders may watch for StochRSI rising above 0.80 before a bearish %K/%D crossover develops near resistance. Price confirmation is still necessary, and short positions carry additional risk.
Does Stochastic RSI work on all crypto timeframes?
Stochastic RSI can be applied to different chart intervals, but signal quality varies with volatility, liquidity, and market structure. Lower timeframes often generate more noise, while higher timeframes provide fewer, slower-moving signals.
Disclaimer: This content is for educational purposes only and does not constitute financial or investment advice. Cryptocurrency trading involves significant risk, including volatility, liquidity changes, and potential capital losses. Technical indicators and historical patterns do not guarantee future results. As the SEC's investor bulletin explains, past performance cannot reliably predict future investment outcomes. Seek advice from a qualified professional where appropriate. Trading products and restrictions may vary by jurisdiction.