For day traders who regularly chase breakouts or enter too early, this approach provides a more structured way to identify entries at a potentially better price. The setup works best when both indicators support the same trend direction, although neither guarantees a successful trade.
Key Takeaways
-
VWAP identifies intraday market bias, showing whether price trades above or below the session's volume-weighted average price.
-
The 9 EMA and 20 EMA track short-term momentum, helping traders identify potential pullback entry zones.
-
A bullish setup develops when price holds above VWAP, the EMA slopes upward, and buyers return after a pullback.
-
Entry confirmation may come from a green candle, VWAP reclaim, higher low, or improving trading volume.
-
Stop-loss placement should follow market structure, while profit targets can reference previous highs, lows, and liquidity levels.
What Is an EMA VWAP Strategy?
An EMA VWAP strategy is an intraday trading method that uses two indicators to answer different questions: Is the market trending in a particular direction, and where might a pullback offer an entry?
VWAP stands for Volume Weighted Average Price. It calculates the average price traded during a selected period, giving greater weight to periods with higher trading volume.
Its basic calculation is:
VWAP = Cumulative (Typical Price × Volume) ÷ Cumulative Volume
Typical price commonly equals (High + Low + Close) ÷ 3.
Unlike a conventional moving average, session VWAP resets at the beginning of each trading session. This makes it a useful daily fair value reference. On cryptocurrency charts, which operate continuously, the exact reset depends on the chart's session and time-zone settings.
Traders often interpret price above VWAP as a bullish intraday bias and price below VWAP as bearish. VWAP is also widely monitored in institutional execution, although trading above it doesn't prove institutional buying.
EMA stands for Exponential Moving Average. It gives more weight to recent price action, making it responsive to short-term momentum changes.
The difference between VWAP and EMA in day trading comes down to their inputs: VWAP incorporates trading volume, while a standard EMA responds to price changes without directly weighting volume.
Together, VWAP supplies directional context and EMA provides a potential entry trigger.
Best EMA and VWAP Settings for Day Trading
The 9 EMA and 20 EMA are common starting points for intraday pullback trading. Neither setting is universally best.
| Indicator |
Suggested Setting |
Trading Purpose |
| VWAP |
Session VWAP |
Intraday directional bias |
| 9 EMA |
9 periods |
Fast momentum and early pullbacks |
| 20 EMA |
20 periods |
Smoother pullback confirmation |
| Chart timeframe |
5-minute or 15-minute |
Entry structure and confirmation |
| Volume |
Standard volume bars |
Participation during pullbacks |
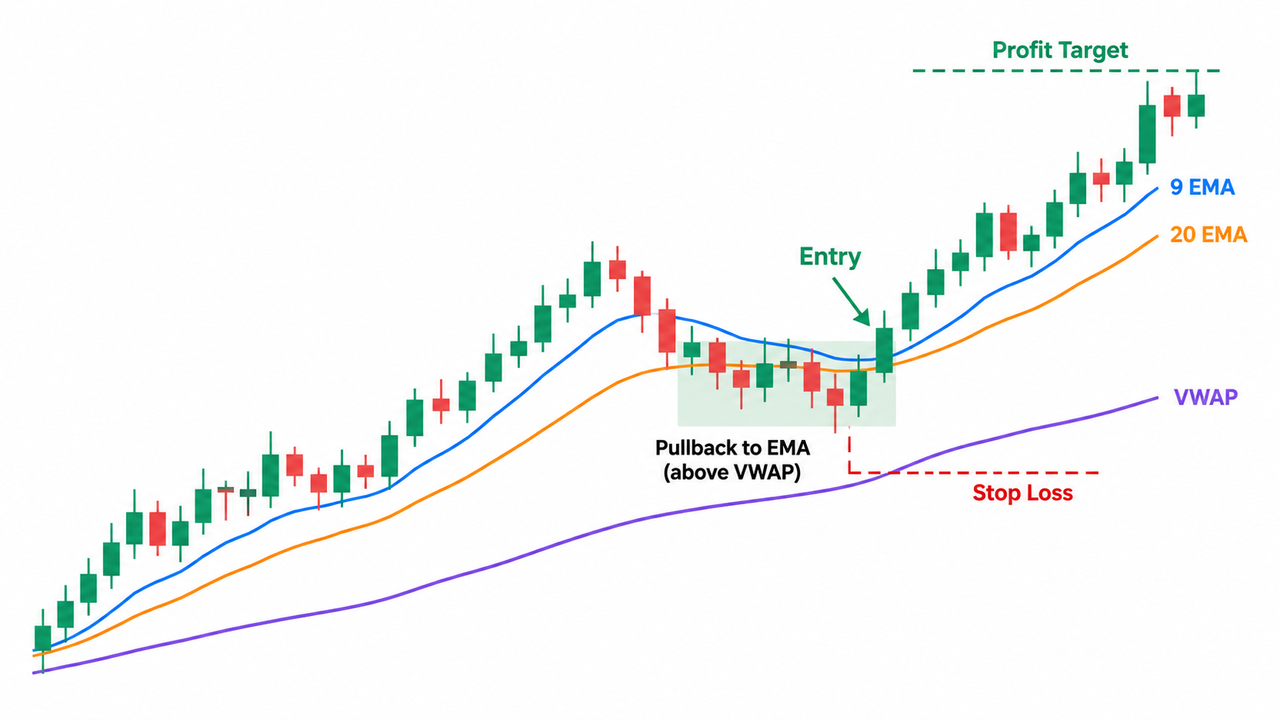
A rising 9 EMA above the 20 EMA suggests improving short-term momentum. When both remain above VWAP, the indicators may support a bullish trend-continuation setup.
However, the 9 EMA reacts quickly and can generate false signals in choppy markets. The 20 EMA responds more slowly but may offer clearer structure.
The choice depends on trading speed, volatility, and the asset being traded. Traders comparing EMA settings for scalping should also account for spread and execution costs.
How to Use an EMA VWAP Strategy for Pullback Entries
A pullback entry begins with an established trend. The objective is to wait for price to return toward a relevant support or resistance area instead of entering after an extended initial move.
Step 1: Identify the Initial Move and Opening Range
Begin by checking the broader trend and session structure.
For a bullish setup, look for price trading above VWAP, rising EMAs, and a sequence of higher highs and higher lows.
The opening range can provide useful context in stock markets, including liquid stocks and indices such as Bank Nifty. A strong morning trend supported by volume may indicate active participation.
Crypto markets operate continuously, so traders need a consistent session definition rather than assuming every market has the same opening range.
Step 2: Wait for Price to Pull Back Toward EMA or VWAP
Once the initial move develops, wait for price to retrace toward the 9 EMA, 20 EMA, or VWAP.
The most interesting zones occur when these indicators cluster near an established support level. This is called indicator confluence.
For example, price may pull back toward the rising 20 EMA while remaining above VWAP. If the previous higher low holds, the broader bullish structure remains intact.
A pullback isn't automatically an opportunity. Heavy selling volume, repeated closes below VWAP, or a broken swing low can indicate that the original trend is weakening.
Step 3: Confirm the Entry With a Green Candle
A potential long entry appears when buyers defend the pullback zone.
Confirmation may include:
-
A green candle closing above the 9 EMA after testing support.
-
A higher low forming near the 20 EMA.
-
Price reclaiming VWAP and holding above it.
-
Increasing volume as price resumes its original direction.
A VWAP reclaim occurs when price moves back above VWAP after trading below it. A successful retest can strengthen the bullish interpretation, but one candle never proves support will hold.
Price action matters more than a mechanical indicator crossover.
Step 4: Place the Stop Loss Below Market Structure
A stop loss should reflect where the trade idea becomes invalid.
For a bullish pullback, this may be below the recent swing low or the support zone supporting the entry. For a bearish trade, the equivalent level is above the relevant swing high.
Avoid choosing arbitrary distances. A 10-cent stop on a stock moving 50 cents per minute may be too narrow relative to normal volatility.
Position size should then reflect the distance between entry and stop loss, not the other way around.
Step 5: Set the First Target Near a Liquidity Level
Profit targets generally reference price structure rather than an arbitrary percentage.
The first target might be the previous intraday high, opening-range high, or another established resistance level.
A trader can also calculate the potential reward relative to the stop-loss distance.
For example, an entry at $101 with a stop at $100.50 and target at $102 offers a theoretical 2:1 reward-to-risk ratio before fees and slippage.
If the nearest reasonable target is too close, waiting for another setup may make more sense.
EMA VWAP Pullback Example on an Intraday Chart
Consider a hypothetical BTC/USDT setup.
Bitcoin trades above session VWAP, with the 9 EMA positioned above a rising 20 EMA. After a strong upward move, price pulls back toward the 20 EMA without breaking the most recent higher low.
A green candle then closes above the 9 EMA as volume increases.
The trader identifies the candle as a potential entry signal, places a stop below the pullback low, and uses the previous intraday high as the first target.
The BTC/USDT spot market on Gate.com provides a practical chart for examining recent price action, trading volume, and potential indicator alignment.
The setup becomes less attractive if price loses VWAP on heavy volume or repeatedly fails to reclaim the EMA. In that case, the expected continuation may no longer be supported by the chart.
When Should Day Traders Avoid an EMA VWAP Strategy?
EMA VWAP pullbacks are generally more useful during established trends than sideways markets.
When price repeatedly crosses VWAP and the EMAs flatten, traders may encounter multiple false entries. This behavior is common when the market lacks directional conviction.
Other warning signs include unusually wide spreads, weak liquidity, and sharp news-driven candles.
Traders should also avoid treating every VWAP bounce as proof of support. EMA and VWAP are lagging indicators, and their alignment does not establish a statistical edge without testing.
The SEC's investor education resources warn that day trading can generate substantial losses over short periods. Indicator confirmation cannot remove that risk.
Conclusion
The EMA VWAP strategy combines intraday market bias with short-term entry timing. VWAP helps identify the prevailing direction, while the 9 EMA and 20 EMA highlight potential pullback zones.
The strongest-looking setups generally involve directional alignment, intact market structure, a confirmed reaction from the pullback zone, and a clearly defined stop loss.
Patience matters. Waiting for price to return toward support or resistance can produce a more structured trade than chasing the initial move, but past performance does not guarantee future results.
Frequently Asked Questions
Is VWAP better than EMA for day trading?
Neither is universally better. VWAP measures a volume-weighted average price over a selected period, while EMA responds more directly to recent price changes. Combining them may help traders separate directional bias from entry timing.
Which EMA works best with VWAP?
The 9 EMA and 20 EMA are commonly used for short-term intraday trading. The 9 EMA responds faster, while the 20 EMA provides smoother signals. Traders should test both against their chosen timeframe and market conditions.
Can traders use VWAP on a daily chart?
Yes, but session VWAP is generally designed for intraday analysis. On a daily chart, a session-reset VWAP may contain only one bar per calculation period. Weekly, monthly, or anchored VWAP settings may be more useful for longer-term analysis.
What is a VWAP bounce strategy?
A VWAP bounce strategy looks for price to touch or approach VWAP and then move away in the direction of the prevailing trend. Traders often seek candlestick confirmation, market structure, and volume support before considering an entry.
Can EMA and VWAP provide short-entry signals?
Yes. A bearish setup may develop when price remains below VWAP, the EMAs slope downward, and a rally fails near EMA or VWAP resistance. A red candle and a lower high may provide additional confirmation.
Does EMA VWAP confluence guarantee profitable trades?
No. Confluence identifies agreement between indicators, not certainty about future price movement. Volatility, liquidity, transaction costs, and changing market structure can still produce losing trades.
Disclaimer
This content is provided for educational purposes only and does not constitute financial or investment advice. Cryptocurrency trading involves significant risk, including possible loss of capital. Technical indicators and historical patterns do not guarantee future results. Trading rules and product availability may differ by jurisdiction.