For intraday traders working with repeatedly defined sessions, Pivot Points can create a consistent price map. Traders following larger swing moves may prefer Fibonacci levels because they adapt to the selected swing high and swing low. Understanding that difference matters because choosing the wrong tool for the market structure can create false signals, weak entries or poor trade execution.
Key Takeaways
-
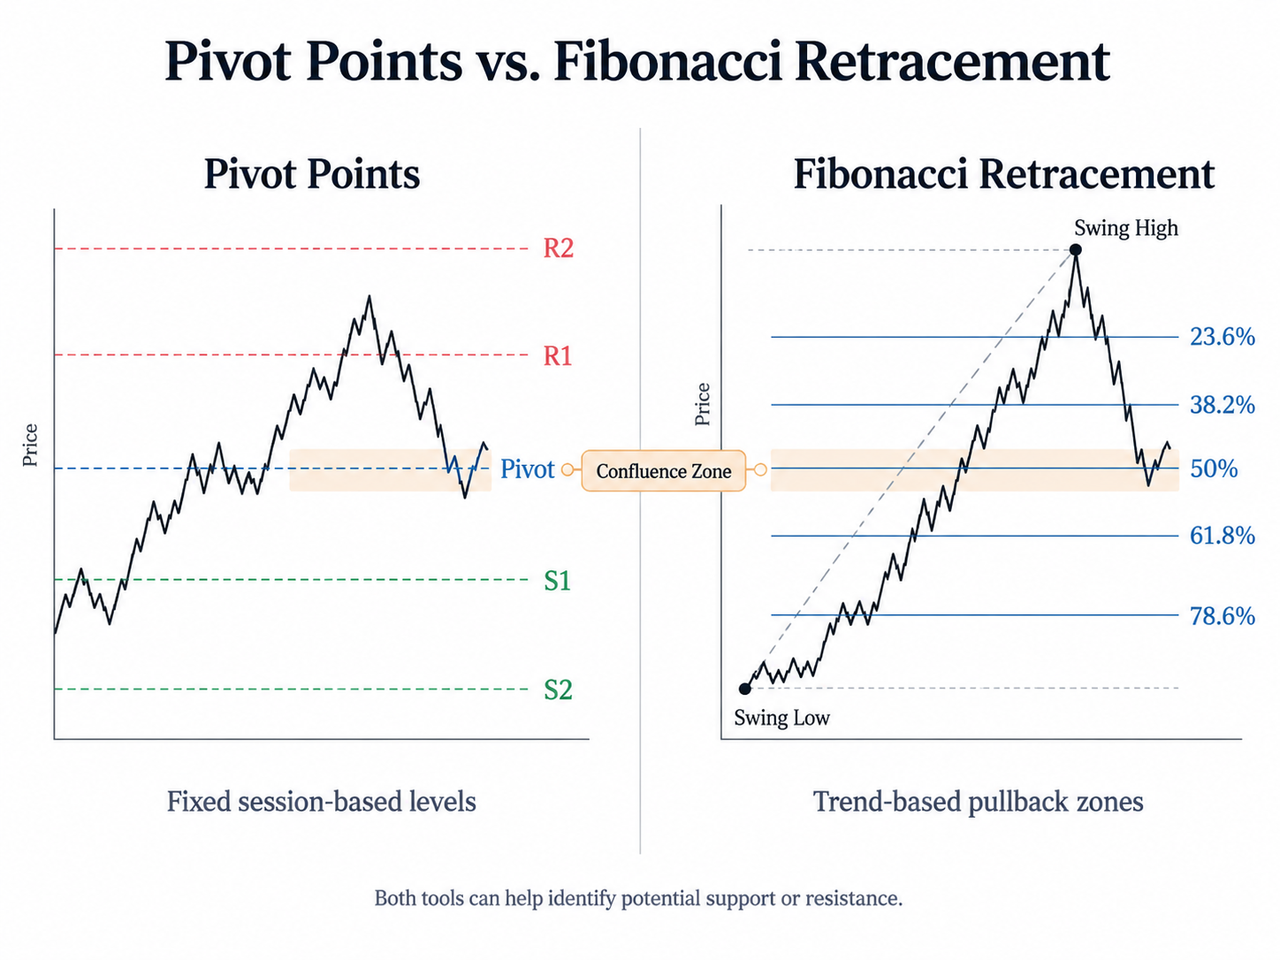
Pivot Points calculate objective support and resistance levels from the previous period's high, low and close, making them particularly useful for intraday trading.
-
Fibonacci Retracement maps potential pullback zones between a significant swing high and swing low, making it more adaptable to trending markets.
-
Common Fibonacci retracement levels include 23.6%, 38.2%, 50%, 61.8% and 78.6%, although 50% isn't mathematically derived from the Fibonacci sequence.
-
Pivot Points remain fixed during their chosen session, while Fibonacci retracements can change when traders select new significant price moves.
-
When a Pivot Point and Fibonacci level appear in the same price zone, that confluence can make the area more useful to monitor, but it still doesn't guarantee support or resistance will hold.
Pivot Points vs. Fibonacci Retracement: Which Is Better for Support and Resistance Trading?
The main difference is where the price levels come from.
Pivot Points use a formula based on the previous period's high, low and closing prices. With the classic method:
Pivot Point (P) = (High + Low + Close) / 3
Support and resistance levels such as S1, S2, R1 and R2 are then calculated around that central pivot. Because the inputs are predetermined, two traders using the same market period and formula should receive the same price levels. The CMT Association describes the classic pivot as the average of the previous trading day's high, low and close and documents the associated support and resistance calculations.
Fibonacci Retracement starts somewhere else: with a significant price move selected by the trader. The Fibonacci retracement tool draws horizontal lines between a swing low and swing high using percentage retracement levels. Fidelity lists 0%, 23.6%, 38.2%, 50%, 61.8% and 100% among its standard retracement lines.
| Factor |
Pivot Points |
Fibonacci Retracement |
| Main purpose |
Session support and resistance |
Pullback support and resistance |
| Inputs |
Previous high, low and close |
Selected swing high and swing low |
| Level selection |
Formula-based |
Depends partly on swing selection |
| Best-known use |
Intraday trading |
Trending and swing markets |
| Levels |
P, S1, S2, R1, R2, etc. |
23.6%, 38.2%, 50%, 61.8%, 78.6% |
| Changes |
Normally fixed for the session |
Changes with selected price swing |
| Main weakness |
Breakouts can invalidate levels |
Swing selection can be subjective |
The practical distinction is simple: Pivot Points answer “Where are today's calculated reference levels?” Fibonacci Retracement asks “Where might this particular price move pull back?”
How Fibonacci Retracement Levels Come From the Fibonacci Sequence
The mathematical idea behind Fibonacci trading begins with the Fibonacci sequence:
0, 1, 1, 2, 3, 5, 8, 13, 21...
Each Fibonacci number is formed by adding the previous two numbers. Relationships between increasingly large Fibonacci numbers generate ratios that technical analysts apply to financial markets.
The best-known is approximately 61.8%, related to the golden ratio of approximately 1.618. Other commonly used Fibonacci ratios include 23.6%, 38.2% and 78.6%. CME Group identifies 38.2%, 50% and 61.8% as widely followed retracement references while noting that 50% itself isn't derived directly from the Fibonacci sequence.
Fibonacci Retracement Construction
Suppose a crypto asset moves from a swing low of $80 to a swing high of $100. The significant price move covers $20.
A 38.2% Fib retracement would represent a pullback of:
$20 × 38.2% = $7.64
For an upward move, the corresponding price level would therefore be approximately:
$100 − $7.64 = $92.36
The same calculation can identify other potential support levels. These aren't predictions that price must bounce. They are areas where traders may watch price action more closely.
Fibonacci trading tools can also be combined with trend lines, moving averages, volume analysis or candlestick patterns rather than treated as standalone signals.
When Pivot Points Work Better for Market Analysis
Pivot Points have an advantage when traders need consistent levels before an intraday session develops.
Because the levels are calculated from completed price data, the central pivot and associated resistance levels remain rigid during that selected trading period. A trader doesn't have to decide which swing high is significant enough or whether a pullback should be measured from one low rather than another.
That makes Pivot Points particularly convenient for intraday trading, liquid markets and range-based price action.
Imagine BTC trading above its daily pivot but below R1. A trader might treat the pivot as potential support and R1 as potential resistance, then wait for price action or volume to confirm signals. If price breaks R1 decisively, R2 may become the next reference rather than automatically assuming R1 will force a reversal.
For a live application, a trader can use the BTC/USDT market on Gate.com, place Pivot Points on the price chart and compare the calculated levels with current candles and volume instead of evaluating them in isolation.
The catch is strong momentum. During a major breakout or unusual volatility, price can move through several pivot levels rapidly. Support and resistance are generally better understood as zones rather than barriers that price must respect; CME Group makes the same distinction when describing technical support and resistance.
When Fibonacci Trading Works Better
Fibonacci Retracement usually has the clearer use case when a market is already showing a meaningful trend.
Suppose a currency pair or cryptocurrency is trending upward, creates a significant swing high, and then moves in the opposite direction. A Fib retracement can map potential pullback zones before the trader decides whether the original trend remains intact.
The 38.2%, 50% and 61.8% retracement levels are commonly monitored. The 61.8% level receives particular attention because of its relationship with the golden ratio, but no Fibonacci level should automatically be considered a reversal point.
Fibonacci Retracement is also more flexible across different markets and timeframes. A trader could measure a move lasting several hours, days or months. That flexibility comes with subjectivity: choosing different swing highs and lows can produce different price levels.
Tools such as the Zig Zag indicator can help make significant price swings easier to see, while Fractals highlight local turning structures that may help traders evaluate potential swing points.
Fibonacci Extensions and Price Targets
Fibonacci Retracement deals mainly with pullbacks inside an existing price move. Fibonacci extensions address a different question: where might price travel after moving beyond the prior swing?
Common Fibonacci extension levels include 161.8% and 261.8%. Traders may use these projected levels as possible price targets or profit targets after a retracement.
Unlike a basic retracement constructed between two extremes, an extension commonly uses three significant price points: the beginning of a move, its end and the subsequent retracement. The Fibonacci extension levels then project beyond the existing range.
CME describes extensions as a way of applying Fibonacci ratios beyond a previous move to identify possible zones where a breakout could pause or reverse.
They can therefore create more structured exit points, but an extension is still a reference level rather than evidence that price will reach a specific target.
The most useful answer to Pivot Points vs. Fibonacci Retracement may sometimes be to use both.
Suppose a daily Pivot Point produces support at $90,500 and a 61.8% Fibonacci retracement from a recent swing independently falls near the same level. Rather than two unrelated horizontal lines, the trader now has confluence: different analytical methods identifying approximately the same price zone.
Confluence doesn't make the level certain. It gives traders a reason to pay closer attention to what happens there.
Confirmation might come from a rejection candlestick pattern, rising trading volume, a trend line or another technical indicator. A linear regression indicator can add information about trend direction, while OBV can help determine whether volume supports the price move.
This is generally more useful than stacking several tools that all measure nearly the same thing.
Risks and Limitations of Fibonacci Analysis and Pivot Points
Neither method predicts price movements reliably enough to replace risk management.
Pivot Points can lose practical relevance when breaking news, liquidation cascades or abnormal volatility send price quickly beyond the calculated support and resistance levels. A level derived from yesterday's market conditions can't account for information that arrives today.
Fibonacci analysis has another problem: selection bias. Two traders can choose different swing points and produce different retracement levels. During choppy market conditions, repeated swings may make the Fibonacci tool particularly noisy.
False signals also happen around both methods. Price may briefly bounce from potential support before breaking it, producing premature entries or stop-loss triggers.
Technical analysis itself is based on historical price behavior, so indicators should contribute to informed trading decisions rather than be treated as guarantees. Fidelity similarly describes technical indicators as tools that can help identify possible entry and exit points when used alongside other forms of analysis.
Risk tolerance, position sizing, invalidation levels and market conditions still matter.
Conclusion
Pivot Points are generally the more practical support and resistance tool for objective intraday levels, while Fibonacci Retracement is usually better suited to pullbacks within identifiable trends.
Pivot Points remove much of the subjective level selection because their calculations use fixed prior-period data. Fibonacci Retracement adapts more naturally to significant price moves but depends on selecting meaningful swing highs and lows.
For many trading strategies, the strongest setup isn't choosing one tool exclusively. A Pivot Point overlapping with a Fibonacci level, supported by price action, volume or another independent indicator, can create a more meaningful area to monitor. Even then, support and resistance can fail, and historical technical signals don't guarantee future results.
FAQ
Is Fibonacci Retracement better than Pivot Points?
Not universally. Fibonacci Retracement can be more useful for analyzing pullbacks in trending markets, while Pivot Points are often better suited to predetermined intraday support and resistance levels. Market structure and timeframe should determine the choice.
What are the most important Fibonacci retracement levels?
Common Fibonacci retracement levels include 23.6%, 38.2%, 50%, 61.8% and 78.6%. Of these, 38.2% and 61.8% are directly associated with relationships within Fibonacci numbers, while 50% is a widely used trading convention rather than a Fibonacci ratio.
Why is 61.8% called the golden ratio?
Ratios between consecutive Fibonacci numbers approach approximately 0.618, while the inverse relationship approaches approximately 1.618. This mathematical relationship is known as the golden ratio and forms part of the basis for Fibonacci trading analysis.
Do Pivot Points change during the trading session?
Standard daily Pivot Points are calculated from the previous period's high, low and close, so their levels normally remain fixed for that session. A new set is calculated when the next reference period begins.
Can Pivot Points and Fibonacci levels be used together?
Yes. If a Fibonacci retracement level and Pivot Point identify roughly the same support or resistance zone, traders may treat the overlap as confluence. Price action, candlestick patterns, trend direction and volume can then be used to evaluate whether the level is actually attracting buyers or sellers.
Are Fibonacci levels accurate?
Fibonacci levels identify potential support, resistance and retracement zones; they don't predict reversals with certainty. Their usefulness varies with market conditions, chosen swing points and confirmation from other indicators. CME similarly recommends using Fibonacci analysis with other technical information rather than in isolation.
Disclaimer
Technical indicators use historical market information and can produce false signals. Cryptocurrency prices can be highly volatile, and past price behavior does not guarantee future results.