For crypto day traders and swing traders, the challenge is distinguishing a genuine trend reversal from a brief pullback. An RSI divergence may indicate weakening momentum, but confirmation becomes stronger when price breaks a key support or resistance level with increasing volume.
Key Takeaways
-
Trend reversal indicators identify potential changes in market direction, but a single reversal signal rarely provides enough evidence for entry.
-
RSI divergence and MACD crossovers can reveal momentum shifts before or during a developing reversal.
-
Price structure, candlestick patterns, and support or resistance breaks help confirm whether a new trend may be forming.
-
Increasing trading volume and On-Balance Volume (OBV) strengthen reversal confirmation by showing market participation.
-
Proper risk management, candle-close confirmation, and stop-loss placement help traders manage false signals.
How Trend Reversals Work in Technical Analysis
A trend reversal occurs when price movement changes from an established uptrend to a downtrend or vice versa.
An uptrend generally creates higher highs and higher lows. A downtrend produces lower highs and lower lows. When this structure changes, traders begin looking for evidence that market sentiment and buying or selling pressure have shifted.
However, a potential reversal doesn't always become a sustained new trend. Price can temporarily move against the prevailing direction before continuing its original trend.
This is why validating support and resistance levels matters. A break above resistance after a downtrend carries different information than a small bounce within the same bearish structure.
Traders typically evaluate three conditions:
-
Momentum exhaustion: Buyers or sellers begin losing strength.
-
Structural change: Price breaks an important swing high, swing low, or trendline.
-
Participation: Trading volume supports the new direction.
Together, these conditions provide a practical confirmation framework rather than an attempt to predict the exact market bottom or top.
Which Trend Reversal Indicators Provide Reliable Signals?
Different indicators measure different aspects of market behavior. Combining complementary tools is generally more useful than placing several similar momentum oscillators on one chart.
| Indicator |
Reversal Signal |
Confirmation Role |
| Relative Strength Index (RSI) |
Bullish or bearish divergence |
Identifies momentum exhaustion |
| MACD |
Signal-line crossover |
Confirms shifting momentum |
| Moving averages |
Price reclaim or average crossover |
Tracks changes in trend direction |
| On-Balance Volume (OBV) |
Volume-flow divergence or breakout |
Measures participation |
| Bollinger Bands |
Volatility contraction followed by expansion |
Identifies changing volatility conditions |
| Candlestick patterns |
Engulfing candle, hammer, or shooting star |
Highlights potential turning points |
RSI Divergence and MACD Momentum Confirmation
The Relative Strength Index measures the speed and magnitude of recent price changes on a scale from 0 to 100.
Readings below 30 traditionally indicate oversold conditions, while readings above 70 suggest overbought conditions. Neither reading automatically means a reversal is imminent.
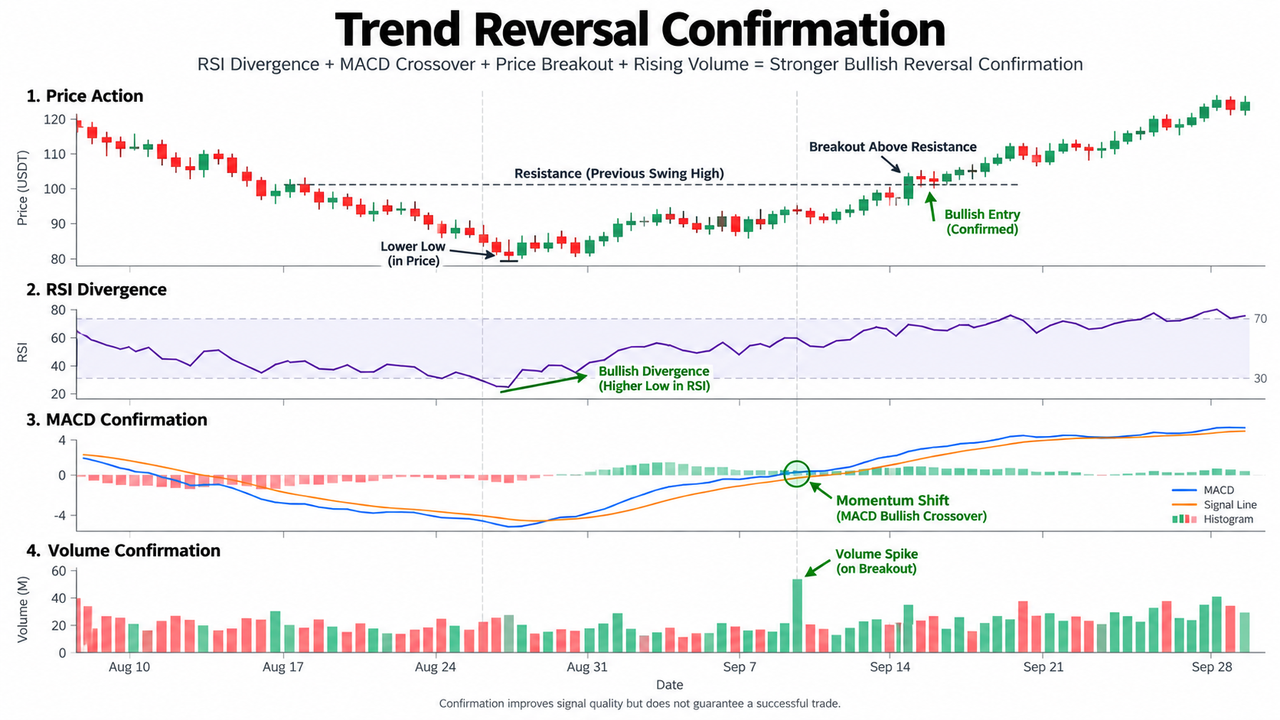
Bullish RSI divergence occurs when price creates a lower low while the RSI forms a higher low. This suggests that selling momentum may be weakening despite continued downward price movement.
Bearish divergence works in reverse: price reaches a higher high while RSI forms a lower high.
The Moving Average Convergence Divergence (MACD) indicator measures the relationship between two exponential moving averages. A bullish MACD signal-line crossover suggests momentum is improving, while a bearish crossover indicates weakening momentum.
Combining RSI and MACD entry confirmation can help filter weaker signals, although both remain price-derived indicators.
Moving Averages and Volume Confirmation
Moving averages help traders identify trends by smoothing short-term price fluctuations.
For example, price recovering above the 20-period EMA may indicate improving short-term direction. Moving average crossovers, such as the 20 EMA crossing above the 50 EMA, can provide additional confirmation, but they often appear after the initial reversal.
Volume adds a different perspective.
OBV tracks cumulative volume flow by adding volume on higher closes and subtracting it on lower closes. Rising OBV during a bullish breakout suggests strengthening participation, while declining OBV during a bearish breakdown supports selling pressure.
The CMT Association's research on volume and volatility describes volume as a useful measure of market participation and price confirmation.
High-volume breakout points generally deserve more attention than weak, low-volume price breaks, though volume spikes can also occur near exhaustion.
How to Use Price Action and Reversal Patterns for Confirmation
Price action provides the structural evidence needed to interpret indicator signals.
Several reversal patterns can appear across different market conditions and timeframes.
Head and Shoulders and Double Tops
The head and shoulders pattern typically forms after an uptrend and contains three peaks: a left shoulder, a higher head, and a lower right shoulder.
A break below the neckline provides bearish confirmation. Increasing sell volume strengthens the interpretation, although even a completed pattern can fail.
Double tops and triple tops, featuring two or three attempts to break resistance, may also indicate weakening buying pressure. Confirmation generally requires price to break below the pattern's intervening support.
Candlestick Signals and the Sushi Roll Pattern
Candlestick patterns can provide earlier warnings.
A bullish engulfing pattern or hammer near key support suggests a possible bullish reversal. A bearish engulfing pattern or shooting star near resistance may indicate the opposite.
The sushi roll pattern, associated with trader Mark Fisher, uses ten bars to identify potential reversals. Its first five bars form a relatively narrow range, while the last five expand beyond that range with higher highs and lower lows.
A bullish interpretation develops near the end of a downtrend; a bearish interpretation appears near the end of an uptrend. Directional confirmation is still needed.
These patterns reflect possible shifts in market sentiment, not guaranteed outcomes.
How to Confirm a Trend Reversal Entry Step by Step
Consider a hypothetical BTC/USDT market that has been declining for several sessions.
Step 1: Identify the prevailing trend. Mark recent swing highs, lower highs, and lower lows. Determine whether price is approaching established support.
Step 2: Look for momentum divergence. Suppose Bitcoin creates a lower low while RSI forms a higher low. This becomes an early bullish reversal warning.
Step 3: Wait for structural confirmation. Price must close above a meaningful recent swing high or resistance level. An intrabar move alone may become a fakeout.
Step 4: Validate trading volume. Look for increasing buy volume during the breakout. Rising OBV adds evidence that participation supports the move.
Step 5: Check secondary confirmation. A bullish MACD signal-line crossover or price recovery above a short-term EMA can support the setup.
Step 6: Define risk before entry. Identify a logical stop-loss below the relevant swing low, calculate position size, and evaluate whether the potential reward justifies the risk.
For a practical example, a trader can examine the BTC/USDT spot market on Gate.com, comparing candlestick structure with momentum and volume readings.
The same process works in reverse for bearish entries. Price breaks support, selling volume increases, and momentum indicators begin supporting the downtrend.
A confirmation table can make the decision easier:
| Entry Requirement |
Bullish Reversal |
Bearish Reversal |
| RSI |
Bullish divergence |
Bearish divergence |
| Price structure |
Break above swing high |
Break below swing low |
| MACD |
Bullish crossover |
Bearish crossover |
| Volume |
Increased buying participation |
Increased selling participation |
| Invalidation |
Below relevant swing low |
Above relevant swing high |
These are illustrative conditions, not a statistically validated trading system.
How Market Conditions Affect Reversal Signals
Trend reversal strategies behave differently in trending and sideways markets.
During strong trends, RSI can remain overbought or oversold for extended periods. A bearish divergence may produce only a brief pullback rather than a major decline.
In sideways conditions, repeated MACD crossovers and moving average crossovers can create false signals without a meaningful directional change.
Bollinger Bands may help identify volatility contraction before expansion, but a band squeeze doesn't predict breakout direction.
Combining reversal indicators with other technical signals can reduce some conflicting entries. Adding too many correlated indicators, however, often creates redundancy rather than greater confidence.
Managing Risk When Trading Trend Reversals
Even convincing reversal signals can fail when liquidity changes, unexpected news affects market sentiment, or the previous trend resumes.
Traders should manage risk through stop-loss placement, position sizing, and predefined invalidation levels.
A strategy's win rate also needs context. High win rates don't necessarily produce profits if average losses exceed average gains.
For algorithmic trading, reversal rules should be tested across multiple market conditions with realistic fees and slippage.
The most important distinction is between identifying a potential reversal and confirming a tradable entry. Waiting for confirmation may produce a less favorable entry price, but it can help avoid acting on premature signals.
Conclusion
Trend reversal indicators are most useful when momentum changes align with price structure and trading volume.
RSI divergence can warn that an existing trend is weakening, MACD can support a momentum shift, and a confirmed support or resistance break provides structural evidence.
No indicator reliably predicts every market turn. Combining a small set of complementary tools with proper risk management is generally more practical than trying to identify the exact reversal candle.
Frequently Asked Questions
What are the best trend reversal indicators for beginners?
RSI, MACD, and trading volume are practical starting points. RSI identifies momentum changes, MACD tracks momentum direction, and volume helps assess participation. Beginners should also understand support and resistance before entering reversal trades.
How do traders distinguish a trend reversal from a pullback?
A pullback temporarily moves against the prevailing trend without necessarily changing its structure. A reversal becomes more credible when price breaks an important swing level and establishes a new sequence of highs and lows.
Can RSI divergence confirm a trend reversal?
RSI divergence provides an early warning, not complete confirmation. Traders generally need supporting price action, such as a resistance breakout or support breakdown, before treating it as an entry signal.
Does high trading volume guarantee a successful reversal?
No. High volume can support breakout confirmation, but it can also appear during panic selling, liquidation events, or exhaustion. Volume should be interpreted alongside price direction and market structure.
What timeframe works best for reversal trading?
The appropriate timeframe depends on trading style. Day traders may examine 5-minute to 1-hour charts, while swing traders often use 4-hour and daily charts. Lower timeframes usually contain more noise, making confirmation especially important.
Disclaimer
Technical indicators, chart patterns, and historical trading performance do not guarantee future results. Cryptocurrency trading involves substantial risk, including the potential loss of capital. Traders should assess their financial circumstances and risk tolerance before making trading decisions.