Recognizing absorption helps crypto traders assess failed breakouts and potential reversals, although heavy trading without price movement doesn't guarantee a directional change.
Key Takeaways
-
Order flow absorption occurs when passive buyers or sellers absorb aggressive orders without allowing price to move significantly.
-
Footprint charts reveal absorption through unusually high executed volume concentrated at price levels where price stalls.
-
Positive or negative volume delta combined with weak price progress can indicate that aggressive traders are meeting strong opposing liquidity.
-
Cumulative volume delta (CVD), volume profile, and structural levels provide additional context for evaluating absorption.
-
Absorption may precede a reversal, failed breakout, or consolidation. Price confirmation remains necessary.
What Is Order Flow Absorption?
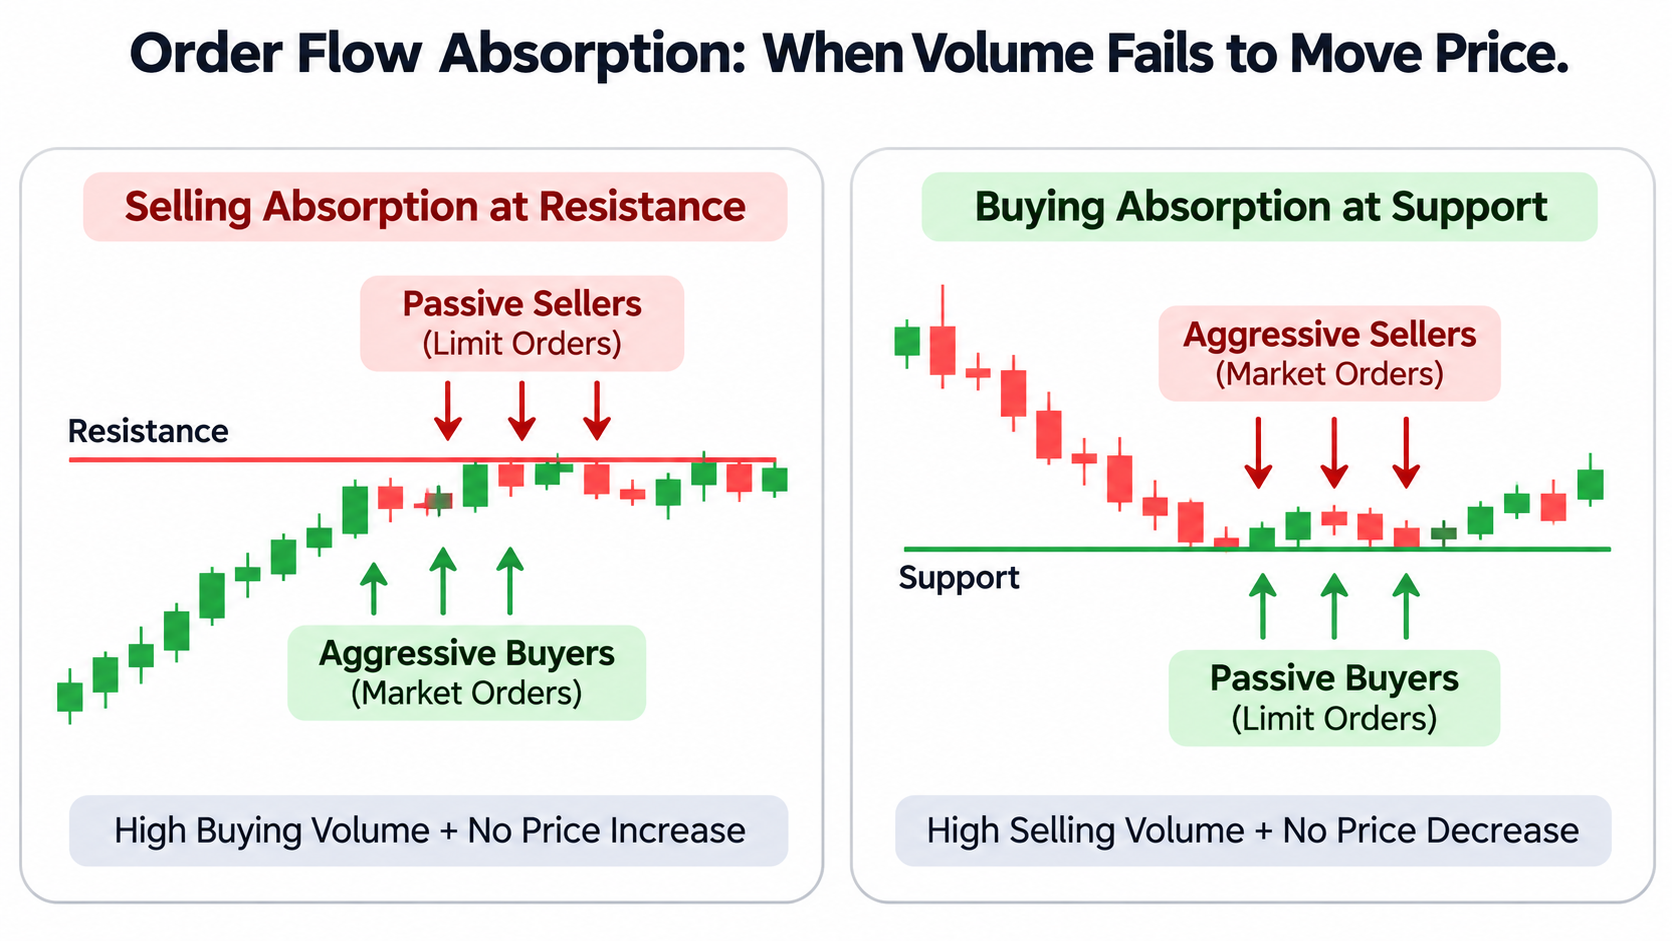
Order flow absorption describes a situation where aggressive buyers or sellers repeatedly execute market orders against resting limit orders, but price makes little progress.
Every executed trade has two sides. A market buy order consumes available sell liquidity at the ask, while a market sell order executes against buy liquidity at the bid. The SEC's explanation of market and limit orders describes this basic execution mechanism.
Consider Bitcoin approaching resistance at $100,000. Aggressive buyers submit large market orders, but passive sellers keep providing liquidity. Trading volume rises while price struggles to move beyond resistance.
That behavior suggests selling absorption.
The opposite occurs near support. Aggressive selling hits resting buy orders, yet passive buyers absorb the selling pressure.
Absorption tells traders that one side is attempting to move price while the other side is providing sufficient liquidity to resist that movement.
Large executed volume doesn't reveal whether big players, market makers, or numerous smaller participants are responsible. The identity and intention of the opposing traders remain uncertain.
How Footprint Charts Identify Order Flow Absorption
Footprint charts display executed bid and ask volume at individual price levels inside each candle. Unlike a standard candlestick chart, they reveal how trading activity developed within the candle.
A typical footprint displays seller-initiated volume at the bid and buyer-initiated volume at the ask.
Suppose a footprint shows aggressive buying of 850 BTC near resistance, while price advances only slightly before returning below that level.
The large buying volume combined with price rejection suggests that passive sellers absorbed much of the incoming demand.
Traders generally watch for three characteristics:
-
High executed volume: Unusually large transactions appear near a specific price.
-
Limited price progress: Price stalls despite continued aggressive buying or selling.
-
Rejection: Price moves in the opposite direction after the aggressive activity weakens.
A single cell with substantial volume can attract attention, but repeated interaction across adjacent prices usually provides stronger context.
The distinction matters because order flow imbalances measure aggressive activity, while absorption concerns the market's response to that activity.
Using Volume Delta and Delta Divergence
Volume delta measures the difference between buyer-initiated and seller-initiated executed volume.
Volume Delta = Aggressive Buy Volume − Aggressive Sell Volume
Positive delta means aggressive buying volume exceeds aggressive selling volume. Negative delta means sellers initiate more volume than buyers.
For example:
| Measurement |
BTC Volume |
| Aggressive buying |
720 BTC |
| Aggressive selling |
280 BTC |
| Volume delta |
+440 BTC |
| Price movement |
Nearly unchanged |
Here, positive delta indicates substantial buying pressure. If price stalls at resistance, passive sellers may be absorbing that demand.
A negative delta near support, combined with little downward movement, can suggest buying absorption.
Net volume and volume delta are different measurements, so traders should verify how their trading platform calculates each indicator.
Cumulative Volume Delta Divergence
Cumulative volume delta adds successive delta readings over time. Depending on the platform, it appears as a line or histogram.
CVD = Sum of Volume Delta Over the Selected Period
Delta divergence occurs when price moves in one direction while cumulative delta fails to confirm the move.
For example, price establishes a new high, but CVD forms a lower high. That divergence suggests reduced aggressive buying participation.
CVD moving upward while price remains trapped below resistance can also support a selling-absorption interpretation.
These patterns aren't interchangeable. A divergence alone does not prove absorption; executed-volume concentration and repeated price rejection strengthen the interpretation.
Why Volume Profile and Price Levels Matter
Absorption becomes more meaningful when it appears at established structural levels rather than random prices.
A volume profile displays the total traded volume at each price level over a selected period.
-
High-volume nodes (HVNs) indicate prices where substantial trading occurred.
-
Low-volume nodes (LVNs) represent areas with comparatively little historical trading.
-
Value area commonly identifies the price range containing approximately 70% of the selected profile's volume.
High-volume nodes are useful locations to investigate absorption because they identify historically active trading areas. That doesn't mean every HVN produces a reversal or improves trading success.
An absorption pattern near resistance, the previous day's high, or a high-volume node may carry more contextual significance than an isolated footprint imbalance.
Traders can identify support and resistance levels before examining the order flow happening inside those areas.
The CME Group's explanation of trading volume also emphasizes that high volume alone cannot establish whether buyers or sellers are gaining control.
Bid Ask Activity and Stacked Imbalance Signals
A bid ask footprint comparison reveals which side initiated more trades at a particular price.
A buy imbalance occurs when aggressive buying substantially exceeds aggressive selling under the platform's comparison method. Several adjacent buy imbalances form a stacked imbalance.
Stacked buy imbalances can accompany strong upward price moves. But if aggressive buyers repeatedly dominate near resistance without pushing price higher, selling absorption becomes a possibility.
Likewise, stacked sell imbalances near support may represent strong selling pressure until passive buyers prevent further declines.
Depth of Market (DOM) displays resting bids and asks, while liquidity heatmaps track visible order book liquidity over time.
These tools can show where passive interest appears concentrated. Still, displayed orders may disappear before execution. The CME Group's order book methodology distinguishes order creation, execution, and cancellation.
Executed trades offer stronger evidence of actual liquidity consumption than an unfilled order wall.
How to Identify Absorption Before a Crypto Trade
A practical absorption workflow combines location, executed volume, delta, and price confirmation.
Step 1: Mark important levels
Identify resistance, support, previous session highs and lows, and high-volume nodes. Previous-day high and low levels can provide reference points.
Step 2: Observe aggressive orders
As price arrives at a marked level, monitor whether market orders increase significantly. Active periods, including the New York session overlap, may produce more transactions but also more noise.
Step 3: Compare delta with price movement
Look for substantial positive delta without upward progress or negative delta without downward progress.
Step 4: Check footprint and liquidity behavior
Examine repeated executions at the same level. A footprint cluster, persistent opposing liquidity, and rejection provide more context than a single volume spike.
Step 5: Require price confirmation
Watch whether price rejects the level, reclaims a nearby structure, or breaks through and holds.
For example, a trader tracking the BTC/USDT spot market on Gate.com can examine price candles, trading activity, and the order book. Full footprint or CVD analysis may require specialized order flow tools and suitable transaction data.
A failed breakout following selling absorption may suggest a reversal, while sustained trading above resistance invalidates that interpretation.
Combining absorption with breakout confirmation and retests helps avoid treating every stalled price move as a trade signal.
Common Mistakes and Limitations
The biggest mistake is assuming that high volume with limited price movement automatically means institutional absorption.
Several conditions can produce similar readings:
-
Temporary equilibrium: Buyers and sellers may be balanced without a decisive participant controlling price.
-
Hidden or fragmented liquidity: An order book shows only available venue-level information, and some liquidity may be concealed.
-
Incorrect delta interpretation: Positive delta measures aggressive buying, not guaranteed upward movement.
-
False reversals: Absorption can precede continuation if opposing limit orders become exhausted.
-
Data limitations: Exchange-specific trade feeds, aggregation methods, and incomplete historical depth can distort comparisons.
Retail traders may also enter on the wrong side of a move after interpreting a single footprint candle as confirmation.
Open interest and volume can provide context for derivatives positioning, but neither identifies absorption independently.
Conclusion
Order flow absorption becomes visible when aggressive buying or selling produces substantial executed volume but limited price progress. Footprint charts, volume delta, CVD divergence, and volume profile help identify these conditions at meaningful price levels.
Its strongest practical use is evaluating whether a breakout attempt is struggling against opposing liquidity. Absorption remains a conditional signal, not proof that price will reverse.
Frequently Asked Questions
What is the difference between absorption and order flow imbalance?
Order flow imbalance measures the dominance of aggressive buying or selling. Absorption occurs when opposing passive liquidity prevents those aggressive orders from moving price significantly. Both can appear together.
Does positive delta mean buyers control the market?
No. Positive delta means buyer-initiated volume exceeds seller-initiated volume. Passive sellers may still prevent prices from rising, creating possible selling absorption.
Can absorption predict a crypto price reversal?
Absorption can signal weakening price progress and potential reversal conditions, but it cannot reliably predict reversals alone. Price rejection and structural confirmation improve interpretation.
Are footprint charts necessary to identify absorption?
Footprint charts provide detailed executed-volume evidence, but traders can investigate possible absorption through price-volume relationships, trade prints, CVD, and order book behavior. Standard candles alone offer less precision.
What is the difference between CVD divergence and absorption?
CVD divergence measures disagreement between price movement and cumulative aggressive trading activity. Absorption specifically involves opposing liquidity limiting price progress. Divergence can support an absorption interpretation without proving it.
Disclaimer
Order flow indicators, historical patterns, and volume-based signals cannot guarantee future price movements. Cryptocurrency trading involves market, liquidity, and execution risks. Traders should conduct independent research and consider their financial circumstances before making trading decisions.