The Accelerator Oscillator (AC) is a technical indicator that measures changes in momentum acceleration, while swing structure identifies market direction through successive highs and lows. Crypto swing traders and active technical analysts can use this combination to evaluate trend continuation, confirm potential reversals, identify entry conditions, and manage risk across different market environments.
Key Takeaways
-
The Accelerator Oscillator measures changes in momentum acceleration, while swing structure identifies whether price maintains an uptrend, downtrend, or consolidation.
-
Rising green AC bars suggest improving momentum acceleration; falling red bars indicate weakening acceleration or increasing downward pressure.
-
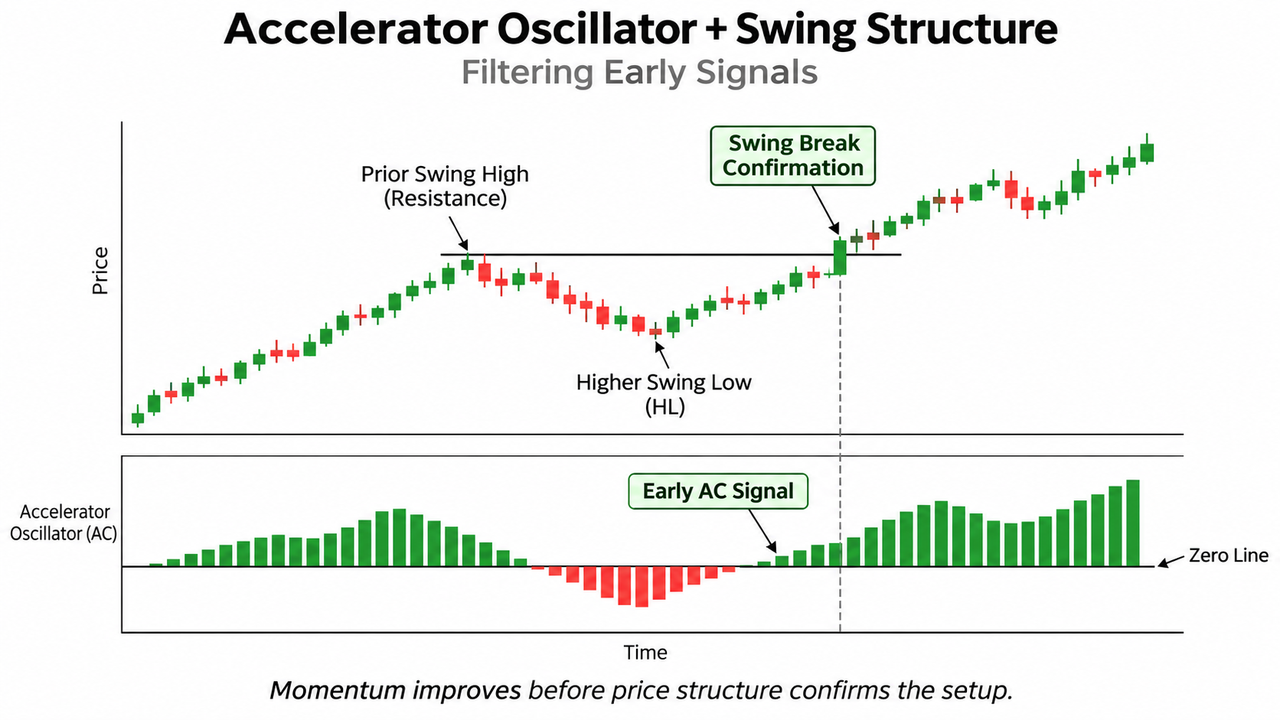
A bullish setup becomes more credible when AC strengthens near a higher swing low and price breaks a nearby swing high.
-
Divergence between AC and price can warn of weakening trends, but it doesn't independently confirm reversals.
-
Swing-based stop loss placement and higher-timeframe confirmation help control risk when early signals fail.
How Does the Accelerator Oscillator Work With Swing Structure?
The Accelerator Oscillator is a momentum indicator introduced by Bill Williams in his trading methodology during the 1990s. It measures how quickly the market driving force, represented by the Awesome Oscillator (AO), accelerates or decelerates.
The AC appears as a histogram oscillating around a zero line. Its calculation is:
AC = AO − SMA(AO, 5)
AC = AO − SMA (AO, 5)
Here, AO measures the difference between 5-period and 34-period simple moving averages of median price. AC subtracts a five-period moving average of AO, highlighting changes in the oscillator itself.
The MetaTrader technical documentation defines these calculations and explains their interpretation.
AC bars generally follow these principles:
| AC Condition |
Momentum Interpretation |
| Green bars increasing |
Acceleration is improving |
| Red bars decreasing |
Acceleration is weakening |
| AC above zero |
AO is above its recent average |
| AC below zero |
AO is below its recent average |
| AC crosses zero |
Momentum acceleration changes relative to its recent balance |
The zero line represents a balance point for acceleration, not a definitive boundary between bullish and bearish price trends.
An AC reading above zero is commonly treated as a bullish acceleration condition, while a reading below zero suggests bearish acceleration. Yet green bars can appear below zero, and red bars can appear above zero.
This distinction matters because AC measures changes in momentum acceleration rather than price direction itself.
The Accelerator Oscillator and Awesome Oscillator work together conceptually, but their signals aren't interchangeable.
How Do Swing High and Swing Low Levels Filter Early AC Signals?
A swing high is a local price peak surrounded by lower highs. A swing low is a local lowest point surrounded by higher lows.
Together, these swing points describe market structure:
-
Uptrend: Higher highs (HH) and higher lows (HL).
-
Downtrend: Lower highs (LH) and lower lows (LL).
-
Consolidation: Overlapping swings without sustained directional progress.
Swing structure establishes whether buyers or sellers have demonstrated control through price action.
Consider an uptrend where AC turns red during a pullback. Momentum acceleration is weakening, but that doesn't automatically mean the broader trend has reversed.
If price forms a higher swing low and AC subsequently prints green bars, the market may be preparing to continue upward.
The confirmation comes when buying pressure produces a meaningful break above a nearby swing high.
In contrast, an AC bullish signal during a sequence of lower highs and lower lows remains countertrend until price structure changes.
This is why RSI range shifts with market structure can produce a different interpretation from momentum readings alone.
A swing point also needs enough subsequent candles to establish a visible turning point. Identifying an unconfirmed low during a falling market can lead to repeated early entries.
How to Combine Accelerator Oscillator With Swing High Breakouts
A practical bullish setup uses AC to identify improving acceleration and price structure to confirm the opportunity.
Step 1: Establish the Existing Trend
Identify the most recent confirmed swing high and swing low on the chosen timeframe.
An established sequence of higher highs and higher lows creates a stronger context for bullish continuation than an unresolved downtrend.
The Aroon indicator can provide additional perspective on how recently significant highs and lows occurred.
Step 2: Wait for Momentum Acceleration
Watch for green AC bars appearing as price approaches support or completes a pullback.
Under conventional Bill Williams rules, two consecutive green bars above zero can form a buy setup. Below zero, the conventional requirement is three consecutive green bars.
The reverse applies to bearish setups: two consecutive red bars below zero or three above zero.
These are indicator conditions, not automatic entry instructions. A zero-line crossing alone is not a conventional AC trade signal.
Step 3: Confirm the Swing Break
For a bullish continuation, look for price to close above the relevant minor swing high after forming a higher low.
A candle close provides more information than a temporary wick above resistance. A successful retest may add confirmation, as illustrated by breakout confirmation with a retest.
Step 4: Define Risk Before Entry
Choose a stop loss below the confirmed higher swing low, with an appropriate volatility allowance.
If the stop distance is too large relative to the potential reward, the position may not justify entry.
The same logic can be reversed for short setups, using lower highs, bearish AC acceleration, and breaks below support.
How to Confirm Bearish Accelerator Oscillator Signals
Bearish confirmation follows the opposite structure.
Suppose price rallies during a downtrend but fails to exceed its previous swing high. The resulting lower high (LH) suggests sellers retain structural control.
If AC starts producing declining red bars, downside acceleration may be increasing.
A break below the latest swing low strengthens the bearish interpretation, particularly when volume supports the movement.
The MACD comparison between consecutive price swings applies a similar principle: momentum changes gain meaning when associated with specific price peaks and troughs.
Waiting for structural confirmation can prevent traders from treating every red AC bar as a sell signal.
Practical Example: Accelerator Oscillator Swing Structure on BTC/USDT
Consider a hypothetical BTC/USDT four-hour chart.
Bitcoin forms a swing high at $80,000, retraces to $77,500, and begins recovering. Its previous confirmed swing low was $76,800.
AC changes from declining red bars to rising green bars as price approaches $79,000.
At this stage, momentum acceleration has improved, but a breakout hasn't occurred.
| Observation |
Hypothetical Value |
Interpretation |
| Previous swing low |
$76,800 |
Structural reference |
| New swing low |
$77,500 |
Potential higher low |
| Resistance swing high |
$80,000 |
Breakout confirmation level |
| AC histogram |
Two rising green bars above zero |
Bullish acceleration setup |
| Price closes above $80,000 |
$80,200 |
Bullish structure confirmation |
A trader examining the BTC/USDT spot market on Gate.com can compare live candlesticks, trading volume, and nearby swing levels when assessing a similar setup.
A protective stop below $77,500 would represent structural invalidation, although the actual stop distance must account for volatility and position sizing.
These prices are illustrative, not historical trading data or a forecast.
How Can AC Divergence Identify Weakening Swing Momentum?
Divergence occurs when price moves to a new extreme without corresponding confirmation from the oscillator.
Bearish divergence: Price creates a higher swing high while AC forms a lower peak.
Bullish divergence: Price creates a lower swing low while AC forms a higher trough.
Such differences suggest momentum acceleration isn't following the latest price changes.
But divergence can persist while a strong trend continues.
For example, Bitcoin may register successive higher highs despite progressively lower AC peaks. Buying pressure might be slowing, yet price can continue rising until market structure breaks.
Comparing momentum acceleration between price swings using ROC provides another way to assess whether successive price movements are losing strength.
A divergence becomes more actionable when followed by a break in the prevailing swing structure.
How to Reduce False AC Signals in Sideways Markets
The Accelerator Oscillator is sensitive to changing acceleration, making consolidation particularly difficult.
During sideways trading, green and red bars may alternate repeatedly without producing meaningful price changes.
Several filters help:
Trend strength: Combining ADX and ATR separates directional strength from volatility.
Multiple timeframes: Confirming pullbacks across timeframes helps traders avoid taking a short-term signal against stronger market structure.
Volume confirmation: Rising volume during structural breakouts can indicate greater participation, although volume alone cannot guarantee continuation.
Entry discipline: Requiring a completed swing break prevents repeated entries based only on histogram color changes.
The catch is that stronger filters reduce trade frequency and may delay entries.
Risks and Limitations of Accelerator Oscillator Swing Trading
AC can provide an early warning system, but early warnings frequently precede incomplete or failed reversals.
Several limitations deserve attention.
First, AC derives from moving averages, so smoothing introduces lag despite the indicator's sensitivity to acceleration.
Second, swing highs and lows may only become confirmed after several candles. Historical charts can make these turning points appear easier to identify than they were in real time.
Third, stop loss placement immediately beyond obvious swing levels may expose trades to temporary volatility.
Market gaps, slippage, leverage, and thin liquidity can increase actual losses beyond planned amounts.
The CFTC's virtual currency trading advisory highlights volatility and the risks associated with speculative trading.
Traders can evaluate rules through crypto paper trading on Gate.com before risking capital.
Conclusion
Combining Accelerator Oscillator signals with swing structure creates a practical distinction between early momentum acceleration and confirmed price direction.
AC identifies possible changes before price structure responds. Swing highs and lows establish whether those changes have produced a meaningful shift in market control.
The approach works best when traders wait for structural confirmation, define invalidation levels, and avoid treating histogram changes as guaranteed reversal signals.
FAQs
Does the Accelerator Oscillator predict swing reversals?
No. AC detects changes in momentum acceleration that may precede reversals, but those changes can also occur during temporary pullbacks or consolidation. Swing structure helps determine whether a meaningful reversal has developed.
Is an AC zero-line crossover a buy or sell signal?
Not by itself. The zero line represents the balance between AO and its five-period moving average. Conventional Bill Williams signals emphasize consecutive histogram bars, while swing-based approaches add price confirmation.
Which timeframe works best for AC swing trading?
Four-hour and daily charts are commonly suitable starting points for swing analysis, although no timeframe is universally superior. Shorter intervals may generate more signals and greater noise.
Can AC divergence confirm a trend reversal?
Divergence suggests that acceleration is weakening relative to price, but it cannot independently confirm a reversal. A break of an important swing low or swing high provides stronger structural evidence.
How should traders place stop losses with AC signals?
Stops can be positioned beyond the swing level that invalidates the setup, allowing for normal volatility. Position size should reflect the distance to that stop and the amount of capital at risk.
Disclaimer
This material is for educational purposes only and does not constitute financial or investment advice. Technical indicators and historical price patterns cannot guarantee future outcomes. Cryptocurrency trading involves substantial risk, and product availability and trading restrictions vary by jurisdiction.