
Share your thoughts
placeholder
Article
Did nothing, just went to the bathroom, and when I came back, the candlestick chart had already done the work for me. I was watching $BSB when the dumping started in the morning session: it had a strong bull-trap vibe, with volume failing to keep up—a classic case of going up with no buyers to take it. So I opened a short at 0.61559. A lot of people panicked and cut their losses during that sharp drop, but I saw an opportunity emerging. When I came back, the current price was 0.1082, with a return of +1622.9%—that was a satisfying bite.

The market is waited out, and profits are held out. A q
post-image
BSB-0.31%
SNDK+9.46%
XRP-4.26%
This was purely the market being in a good mood and casually tossing out some gold coins, one of which just happened to hit me on the head. 💰
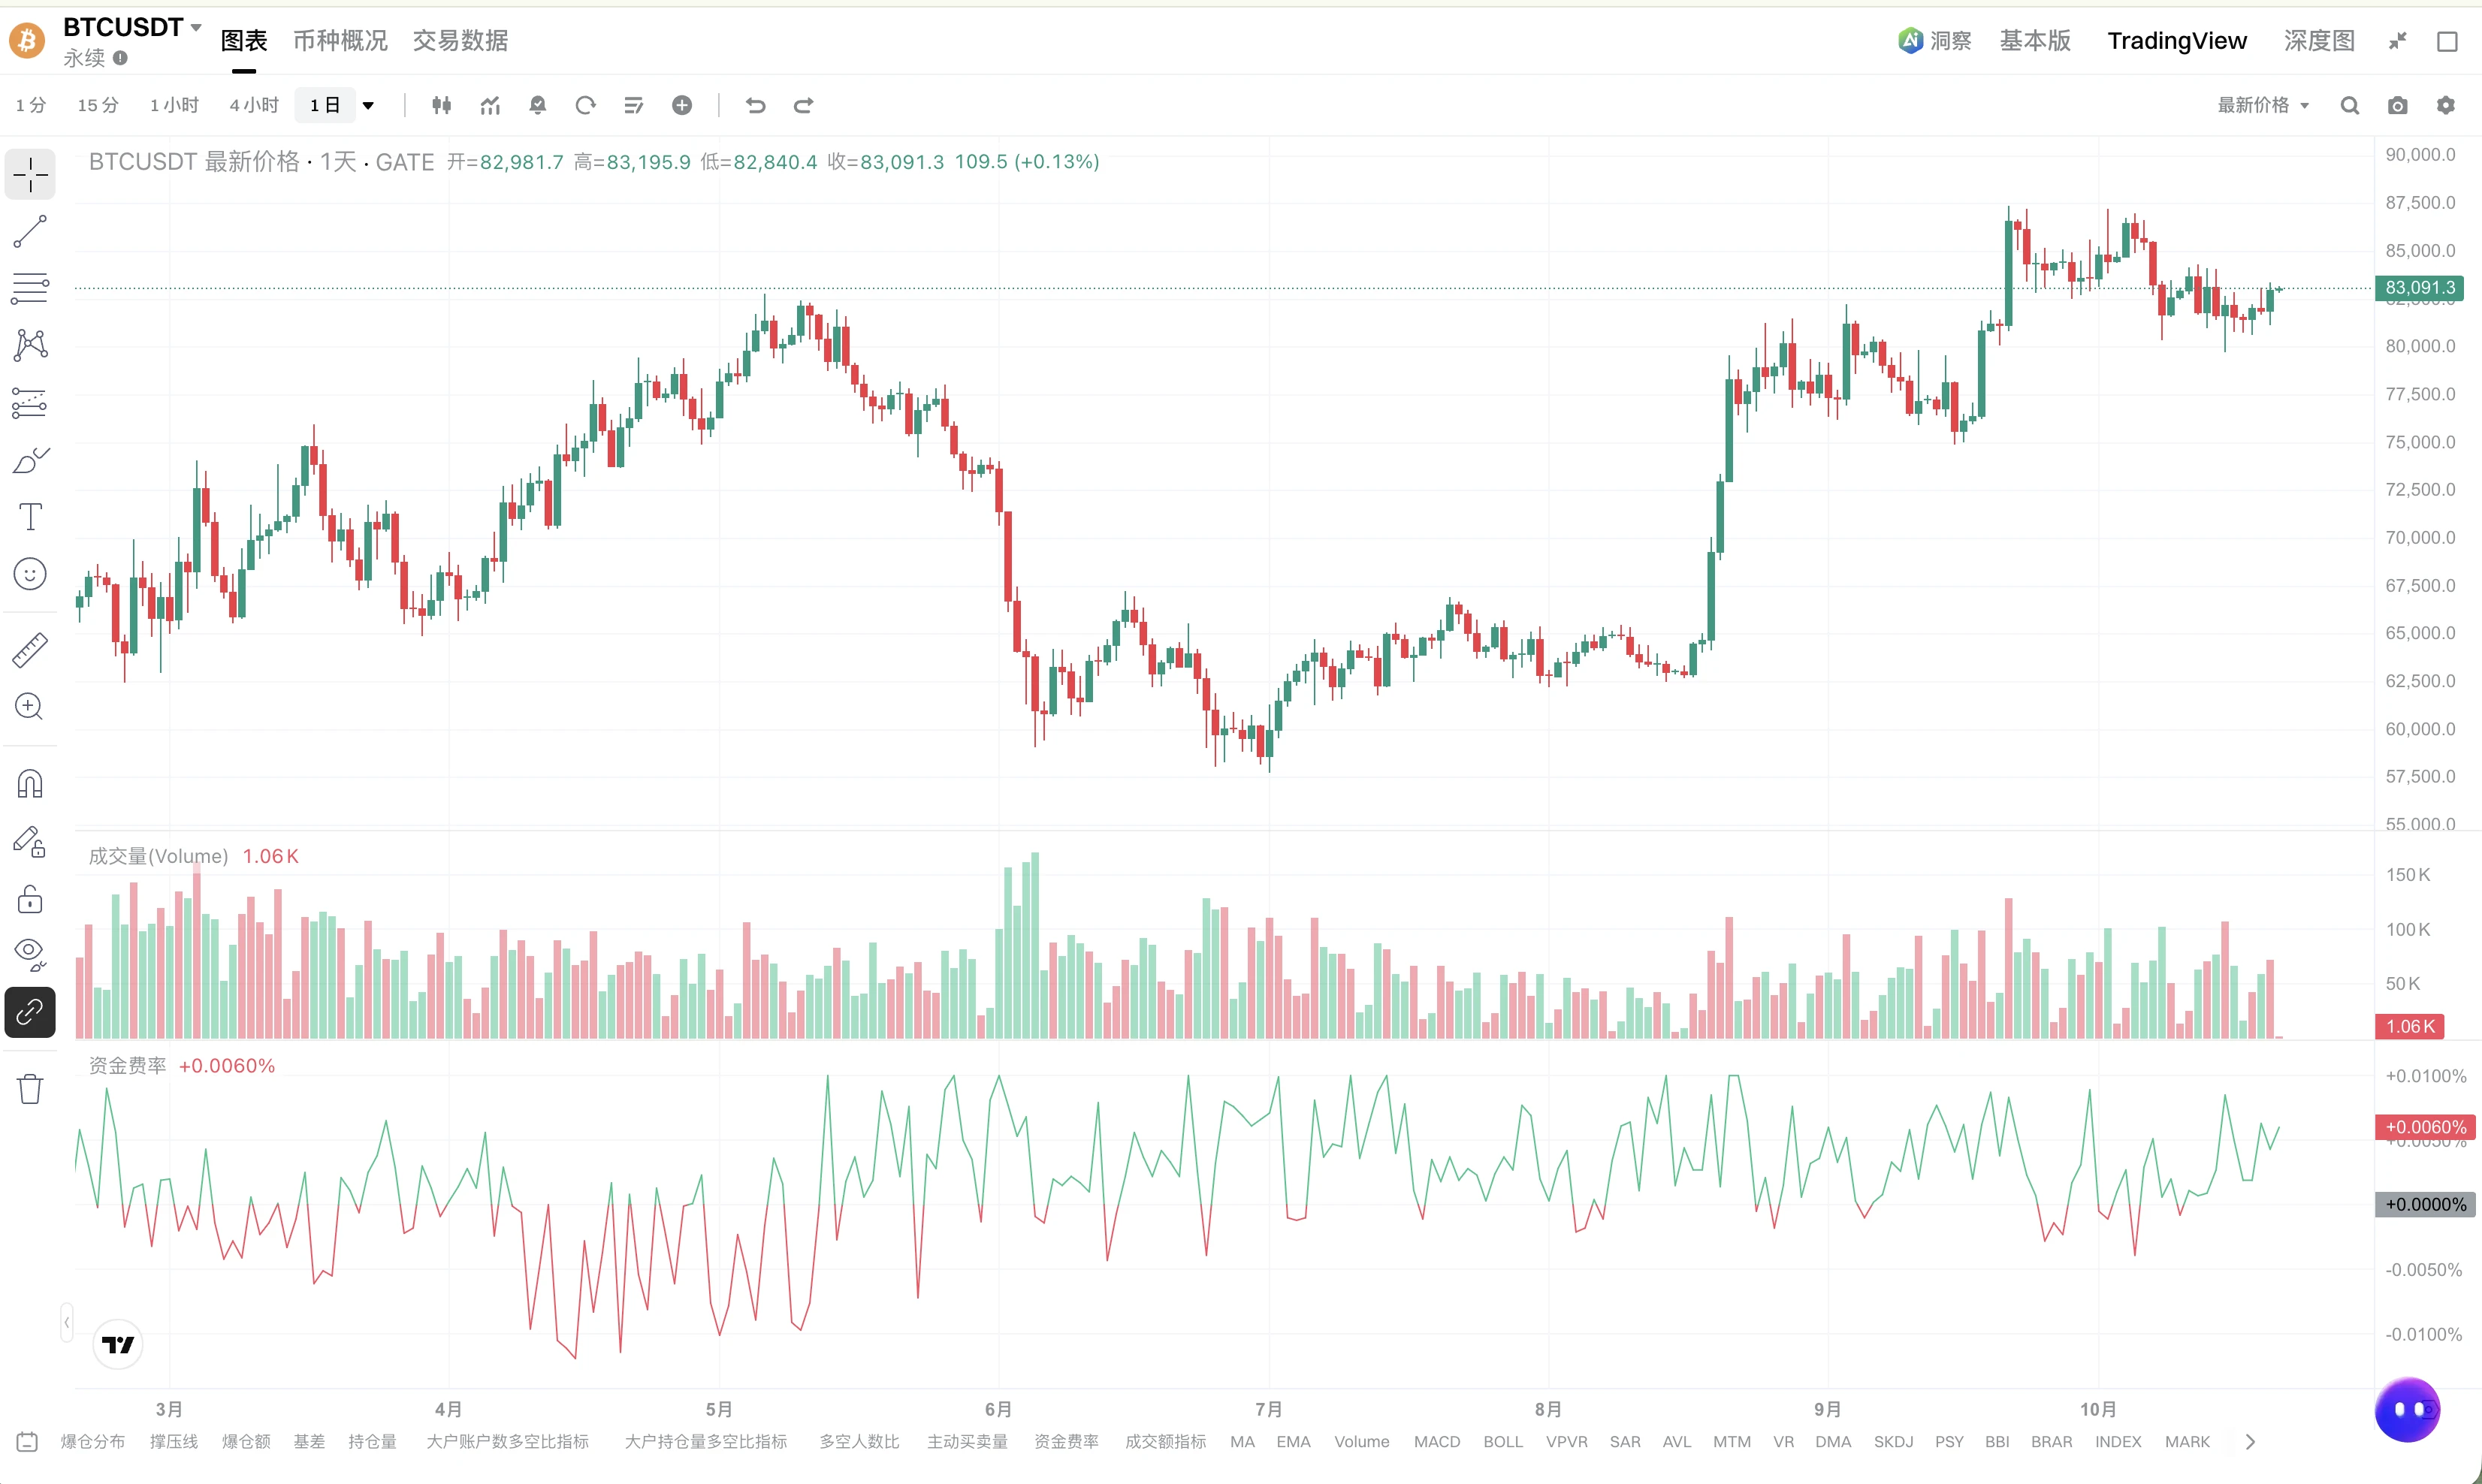
During the repeated intraday swings, $BTC moved sideways at the bottom around 78263.6 for ages. Volume kept shrinking, but the price simply wouldn't fall. I thought to myself: someone is defending the bottom, so what is there to fear? Go long. While everyone else was guessing the direction, I chose to read the chart and not guess.
Now it has risen to 79414.7, with returns at +205.77%—it feels great. But don't just look at the result; those who couldn't
post-image
BTC-2.19%
SOL-3.46%
BNB-1.08%
$MARSCOIN Signal】Long + 1H pullback support, buy orders dominate
$MARSCOIN Order-book depth imbalance 31.31%, bid depth ratio 1.91, 1H pulled back to around 0.1718, with price still above EMA20 (0.1398). The MACD histogram is 0.0044; bullish momentum is narrowing, but price has not fallen below the midpoint of the short-term high-volume candlestick.
🎯 Direction: Long
⚡ Entry/limit order: 0.1713444 - 0.1718600
🛑 Stop-loss: 0.1701414
🚀 Target 1: 0.1744379
🚀 Target 2: 0.1757269
🛡️ Trade management:
- Upon reaching Target 1, reduce the position by 50% and move the stop-loss up to breakeven
post-image
MARSCOIN+46.39%
BTC-2.13%
ETH-2.14%
SOL-3.30%
A few days ago, my hand trembled as I set the stop-loss; this morning, I realized that was unnecessary filial piety. $ETH Honestly, I never expected this long position to run so smoothly—from 2086.30 to 2452.95, with +3052.79% sitting right there. It feels great just looking at it.

During the intraday bottoming process, the price kept testing around 2086.30. I watched it the whole time: it was grinding out a bottom without breaking down, and it could still hold after each pullback. That was a good signal. I confirmed it several times before calling for a long entry around 2086.30. At the tim
post-image
ETH-2.31%
BTC-2.19%
DOGE-5.04%
If the market gives a $75k Bitcoin dip, many on here will be saying "it's over".
The real answer though: BTFD
post-image
BTC-2.13%
We made it to Friday!
Let’s start this day off on a good note
It’s almost the weekend, do you have any plans?🔥
post-image
The latest US jobs data just made the Fed outlook more interesting.
Unemployment came in at 4.1%, right in line with expectations, while the economy added 162,000 jobs in August versus just 55,000 expected.
That tells us the labor market is still holding up better than expected.
Now the focus shifts to inflation.
If next week’s inflation data stays hot, especially with oil prices moving higher, the Fed may have more room to keep rates higher for longer or even consider another hike.
For markets, the next inflation print could be the real trigger.
post-image
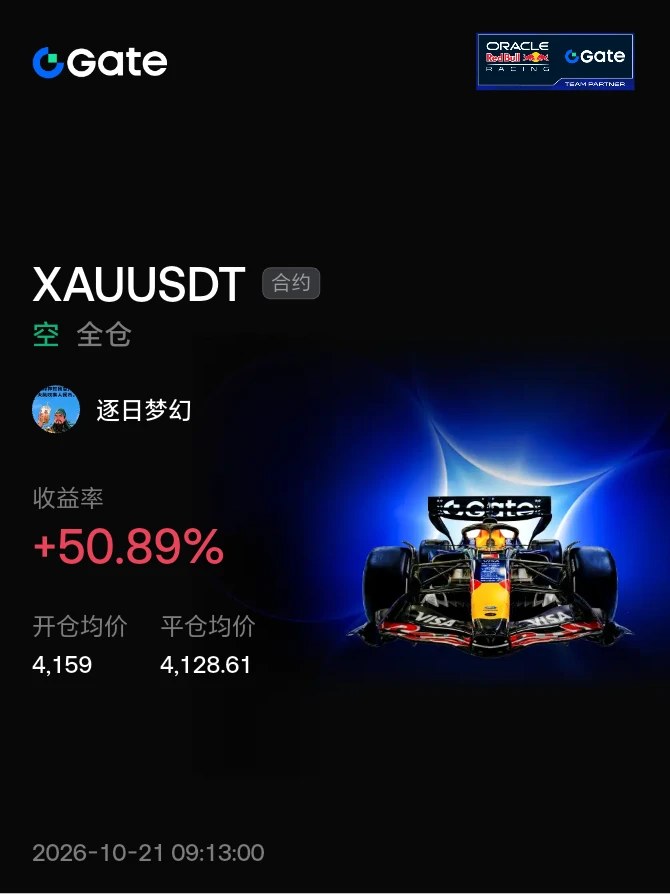
#红牛交易巡回赛第六期
$SUI SUI's performance in today's Asian session was weak, and it began falling with the broader market during the U.S. session, declining approximately 5.20% over 7 days, indicating that the overall trend remains in a correction phase.
From a technical indicator perspective, SUI's short-term signals are cautious. After rebounding in recent days, it came under pressure again, with insufficient upward momentum.
The medium-term trend is weak, and its performance over the past 7 days has lagged behind stronger trending coins. However, support below has not yet been completely lost, s
SUI-4.77%
  • 1
Those who want to follow the trades can choose not to copy positions; do not select “copy existing positions.” Just start from the next phase. I’ll open a position around next Tuesday. Once this trade is completed, please be patient when following the trades. Public-channel copy trades will be swing trades going forward, not long-term trades. Swing trading is my specialty, so there’s no need to worry. Long-term trades are available in the private channel; you can search for and follow “Maple Leaf Trading,” which is the private account, and follow the livestream to learn more.
post-image
  • 6
$Lobster
$BICO
Lobster vs. BICO
post-image
龙虾+18.24%
BICO+6.65%
bit of JDM/Anime style of my baby. and btw- got new angle kit
#bmw #bmwe36 #e36 #jdm
post-image
Crypto + stock market update
live-cover
LIVE1,848
I’m watching $BTR /USDT closely here 👀🔥
Price is holding around 0.05025 after that huge move to 0.05905. On the 15M chart, BTR is trying to build a base around the 0.049–0.050 area, and the moving averages are starting to tighten up.
If buyers step in with volume, I’d be watching this setup:
🟢 Entry Zone: 0.04950 – 0.05030
🎯 TP1: 0.05220
🎯 TP2: 0.05630
🎯 TP3: 0.05900
🛑 Stop Loss: 0.04790
The key is 0.0522 — a clean breakout and hold above this level could give the move some serious momentum. Don’t chase a sudden green candle; let price confirm the breakout first. ⚡
Trade smart, manage y
post-image
BTR+2.75%
$MARSCOIN Signal】Long continuation + pullback support
$MARSCOIN RSI 1H 69.28, after spiking to 0.19688, it pulled back to around 0.17591 and moved sideways. The 4H bullish candle closed with its body at 0.18565, while the 1H MACD red bars shortened and volume declined from its peak. Order-book bids are concentrated around 0.1690, with selling pressure slightly higher but no sustained selling.
🎯Direction: Long
⚡Entry/limit order: 0.1753823 - 0.1759100
🛑Stop loss: 0.1740412
🚀Target 1: 0.1787132
🚀Target 2: 0.1801148
🛡️Trade management:
- After reaching Target 1, reduce the position by 50% a
post-image
MARSCOIN+46.39%
Do you understand what’s happening right now???
US bond yields are surging and that too without a single rate hike
US 2 year and 5 year yields have hit their highest levels in 20 months
Meanwhile US 10 year yield has reached its highest level in 34 months
Such rapid moves in yields only happen when:
Market is expecting the Fed to hike rates
Inflation is running hot
Investors are worried about a debt crisis
For US all these are true at the same time and if it gets worse every market will feel the heat
post-image
📊 $TAO #TopMover ⚖️
🎢 TAO's Wild Round Trip: $236 → $214 → Back to $224 Which Way Breaks Next?
Bittensor carved out a deep V-shaped dip this session, bleeding all the way from $236.5 down to a low of $214.7 before staging a sharp recovery back above $230. But the latest candle just gave back a chunk of that bounce with a heavy red rejection wick, leaving price stuck right in the middle of MA5/MA10/MA30 a classic indecision zone.
Signal Block
- Pair: $TAO /USDT
- Type: SHORT
- Leverage: 7x
- Entry Zone: $224.5 – $227.0
- Take Profit:
TP1 $220.0 +22.8%
TP2 $216.5 +38.4%
TP3 $214.7 +47.5
post-image
TAO-2.61%
  • 8
  • 1
No action, no analysis, just sheer luck—this result is embarrassing even to mention🤪 When the screen was glowing green, everyone else was running, but I was watching something else—the rebound volume. Trading volume was pitifully low, while the sell orders were heavy; every pullback looked like it was barely hanging on. The overhead resistance was obvious, so in this situation, shorting was practically free money. I remember clearly: the signal was given at 0.1989, and the current price is 0.1839, with a return of +360.76%. Enough for a good meal😌 The money you make is the realization of you
post-image
DOGE-5.04%
ADA-3.05%
Trump is the most fucking badass president I’ve ever seen, and he completely breaks the mold when he speaks.
HOOD at $122—would you buy it?
First, look at the surface: normal consolidation after a massive bullish candle.
The spot price surged 16.57% in a single day yesterday, with volume exceeding 51 million shares. It hit an intraday high of 124.88, while perpetuals touched 126 before pulling back. Today, it retraced to around 122, narrowing its 24-hour gain to approximately 11%. But from the March low of 64 to now, it has nearly doubled. All moving averages are in bullish alignment, and the medium-term trend is clearly upward, but RSI is already overbought, so the short term needs consolidation.
Fi
post-image
BTC-2.13%
HOOD+0.44%
UNI+1.01%
Load More

Join 40 M users in our growing community

⚡️ Join 40 M users in the crypto craze discussion

💬 Engage with your favorite top creators

👍 See what interests you

View More