





Square
Following
Hot
News
Notifications
Profile
Share your thoughts
placeholder
Article
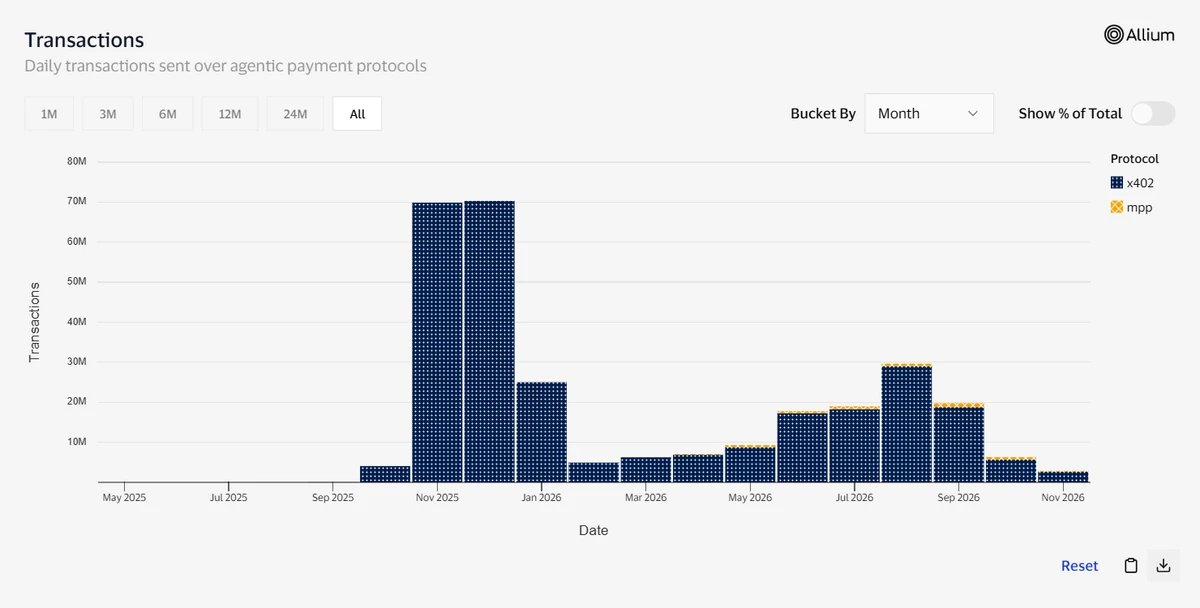
monthly AI-agent payment value dropped 94.5%.
it went from $29M to $1.59M in just a year.
i personally believe the biggest obstacle to agentic payments might be trust.
it is really an issue worth examining.
as AI agents are gaining more autonomy, security threats surrounding them are also growing.
we've already seen several confirmed incidents:
> a morse code prompt injection via AI cost @bankrbot $150k or more
> a DPRK-linked, AI-enabled social engineering cost @zerion $100K.
> HexagonalRodent malware exposed 26,584 wallets holding up to $12M.
> there are also reports of the @ $6.34B breach b
post-image
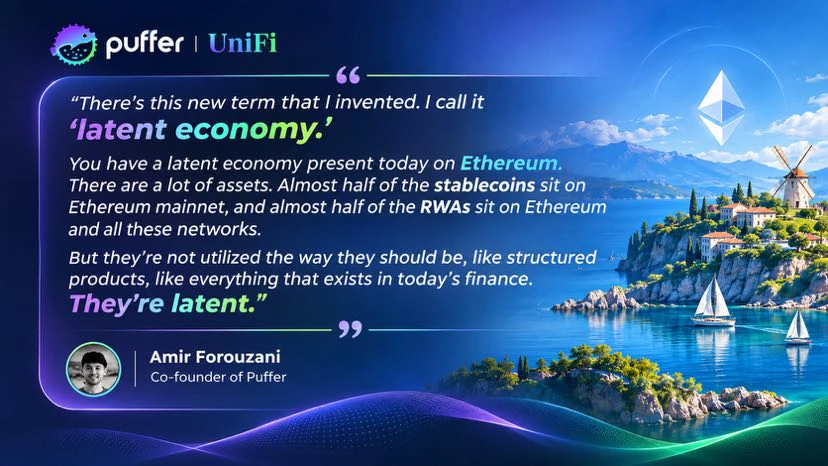
$PUFFER Ethereum holds enormous amounts of capital. But how much of it is actually being put to work?

At Agentic Settlement Night, co-hosted with @googlecloud and @Anchorage, Puffer Co-Founder @AmirOnchain introduced the concept of the “latent economy”, and what it could mean to unlock more of Ethereum's untapped potential.👇
post-image
PUFFER-2.18%
Trenches
PIEVERSE
P
bade
b
PIEVERSE
0x0e...25a9
Market Cap
$.
Change
.
24h Vol
$.
Holders
.
牛逼
牛
bade
b
牛逼
0x96...7777
Market Cap
$.
Change
.
24h Vol
$.
Holders
.
STONK
S
bade
b
STONK
6GmA...UNgx
Market Cap
$.
Change
.
24h Vol
$.
Holders
.
ON
O
bade
b
ON
0x0e...1d48
Market Cap
$.
Change
.
24h Vol
$.
Holders
.
FLOAT
F
bade
b
FLOAT
Bv1a...BMmr
Market Cap
$.
Change
.
24h Vol
$.
Holders
.
Alipay, are you trying to ruin me!!!
post-image
With the same sorrow and longing every year...
#10Kasım #November10
post-image
Bottom divergence has appeared—what levels should we watch first for a rebound?
The takeaway first: the break below the previous low was a false breakdown, not a sign of weakness—it’s an opportunity to go long.
Keep these points in mind: false breakdown below the previous low of 74800-75000; clear 1-hour MACD and RSI bottom divergence, making a rebound likely; daily EMA200 retest, with a MACD golden cross possible at any time; short-term resistance is in the range above where the price has been moving sideways. Ethereum at 2132 hasn’t bottomed yet; 2150 is the 0.5 retracement, 2000 is a key bu
post-image
BTC-0.65%
ETH-1.23%
SOL-0.74%
[ NEW STREAMER ] BTC TALK
live-cover
LIVE1,824
Since early this morning, BTC has come under pressure for the second time. We positioned short near 75500, and both moves played out as expected, capturing 1,000 points each!
Ethereum rebounded in tandem to 2160, met resistance, and pulled back, delivering a steady 40+ points.
The direction was locked in ahead of time, with clear entry levels provided. Catch the main trend, and profits naturally follow!#美国10月CPI即将公布 $BTC ‌$ETH ‌
BTC-0.65%
ETH-1.23%
📣 Daily Standouts: Nominate a Post Worth Reading
Which recent post deserves more attention? 🔎
A well-supported market take, an honest trade recap or a useful tip—share it with us.

💬 Drop the Gate Square post link + one reason to read it.
Nominate your own post or another creator’s. Found something interesting? Open the original and join the discussion.

📌 We’ll check the comments when selecting posts to feature.
🎁 Selected creators get a 3-day traffic boost + featured placement.
Your nomination could be our next standout 👇
‍#DailyStandouts #GateSquare
post-image
Gate_Square
📣 Daily Standouts: Nominate a Post Worth Reading
Which recent post deserves more attention? 🔎
A well-supported market take, an honest trade recap or a useful tip—share it with us.

💬 Drop the Gate Square post link + one reason to read it.
Nominate your own post or another creator’s. Found something interesting? Open the original and join the discussion.

📌 We’ll check the comments when selecting posts to feature.
🎁 Selected creators get a 3-day traffic boost + featured placement.
Your nomination could be our next standout 👇
‍#DailyStandouts #GateSquare
repost-content-media
Great, ACT$ACT continues climbing to 011. The rise is quite fast, so it could easily pull back. I'll open a small short ahead of the pullback😍😍😍$ARIA $EDGE 😍😍😍$
post-image
ACT-1.19%
ARIA+22.03%
EDGE-7.65%
📣 Daily Standouts: Nominate a Post Worth Reading
Which recent post deserves more attention? 🔎
A well-supported market take, an honest trade recap or a useful tip—share it with us.

💬 Drop the Gate Square post link + one reason to read it.
Nominate your own post or another creator’s. Found something interesting? Open the original and join the discussion.

📌 We’ll check the comments when selecting posts to feature.
🎁 Selected creators get a 3-day traffic boost + featured placement.
Your nomination could be our next standout 👇
‍#DailyStandouts #GateSquare
Gate_Square
📣 Daily Standouts: Nominate a Post Worth Reading
Which recent post deserves more attention? 🔎
A well-supported market take, an honest trade recap or a useful tip—share it with us.

💬 Drop the Gate Square post link + one reason to read it.
Nominate your own post or another creator’s. Found something interesting? Open the original and join the discussion.

📌 We’ll check the comments when selecting posts to feature.
🎁 Selected creators get a 3-day traffic boost + featured placement.
Your nomination could be our next standout 👇
‍#DailyStandouts #GateSquare
repost-content-media
$ETH Continue to stay bearish; the downtrend has not changed for now!

ETH is currently at 2120. DuiDui's short strategy: enter at 2120-2130, stop loss at 2160, first target at 2070!

ETH has now broken below the key support at 2200, and the moving averages are bearishly aligned. The price has consistently failed to break through resistance at 2157. The current consolidation between 2100 and 2160 looks more like weak consolidation after a decline, not a trend reversal.

Pay close attention to support at 2100. A high-volume break below it could trigger long stop-losses and cascading liquidation
post-image
ETH-1.23%
crypto news
live-cover
LIVE1,587
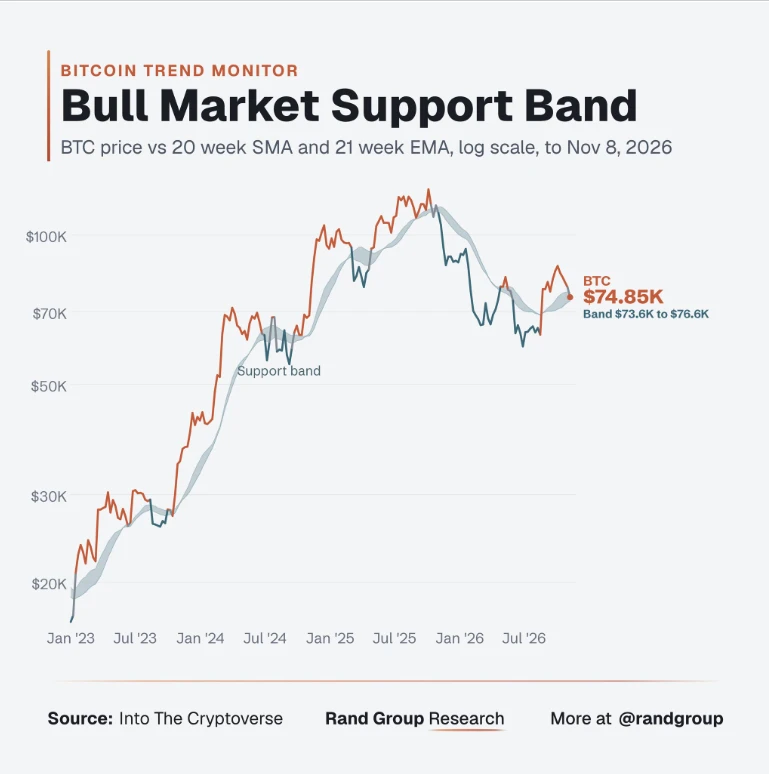
🐋 WHALE WATCH : Bitcoin spent almost all of 2026 under this level bleeding out in the $60k range while everyone called for the end of the cycle.
Now $BTC is testing $73.6K – $76.6K from above.
=> Hold it ➔ Expansion to new ATHs
=> Lose it ➔ One last bear run at the lows
This week is the ultimate decision maker. Are you positioned or sidelined ?
post-image
BTC-0.67%
What Is Out-of-Sample Testing? How Can You Tell Whether a Trading Strategy Truly Generalizes?

In cryptocurrency trading, a strategy's strong performance in historical backtests does not mean it can adapt to future markets. To prevent a strategy from merely memorizing past data, traders need to use out-of-sample testing to check whether it still performs reasonably on data that was not used in its development or tuning.

First, what is out-of-sample testing?

Out-of-sample testing means evaluating a strategy's actual performance using data that was not used to select or optimize its parameters
post-image
Starting today, I’m tightening my belt
I’ll only eat Pinhao Fan
Goddammit, seriously
How did I spend so much just on food
post-image
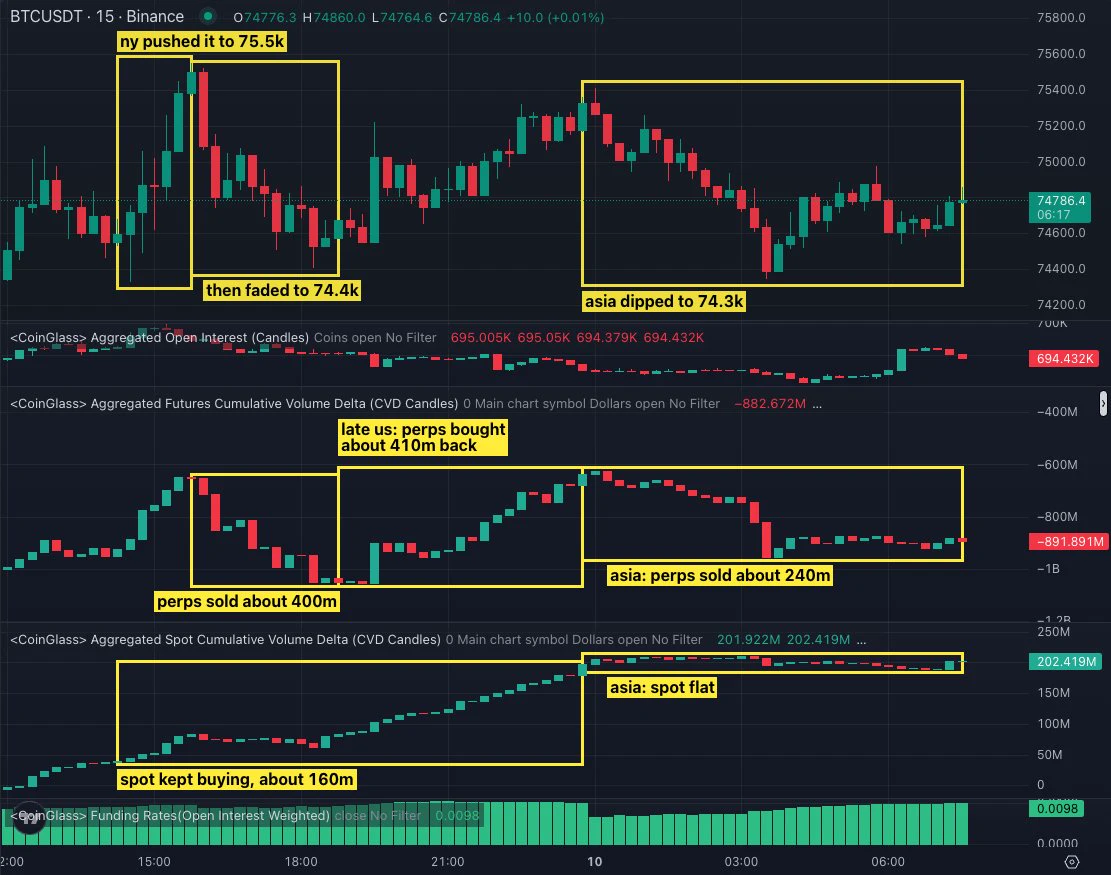
GM - perps sold the dip, bought the bounce, sold the dip again. trade this range long enough and youll need therapy bitcoin:native
post-image
BTC-0.65%
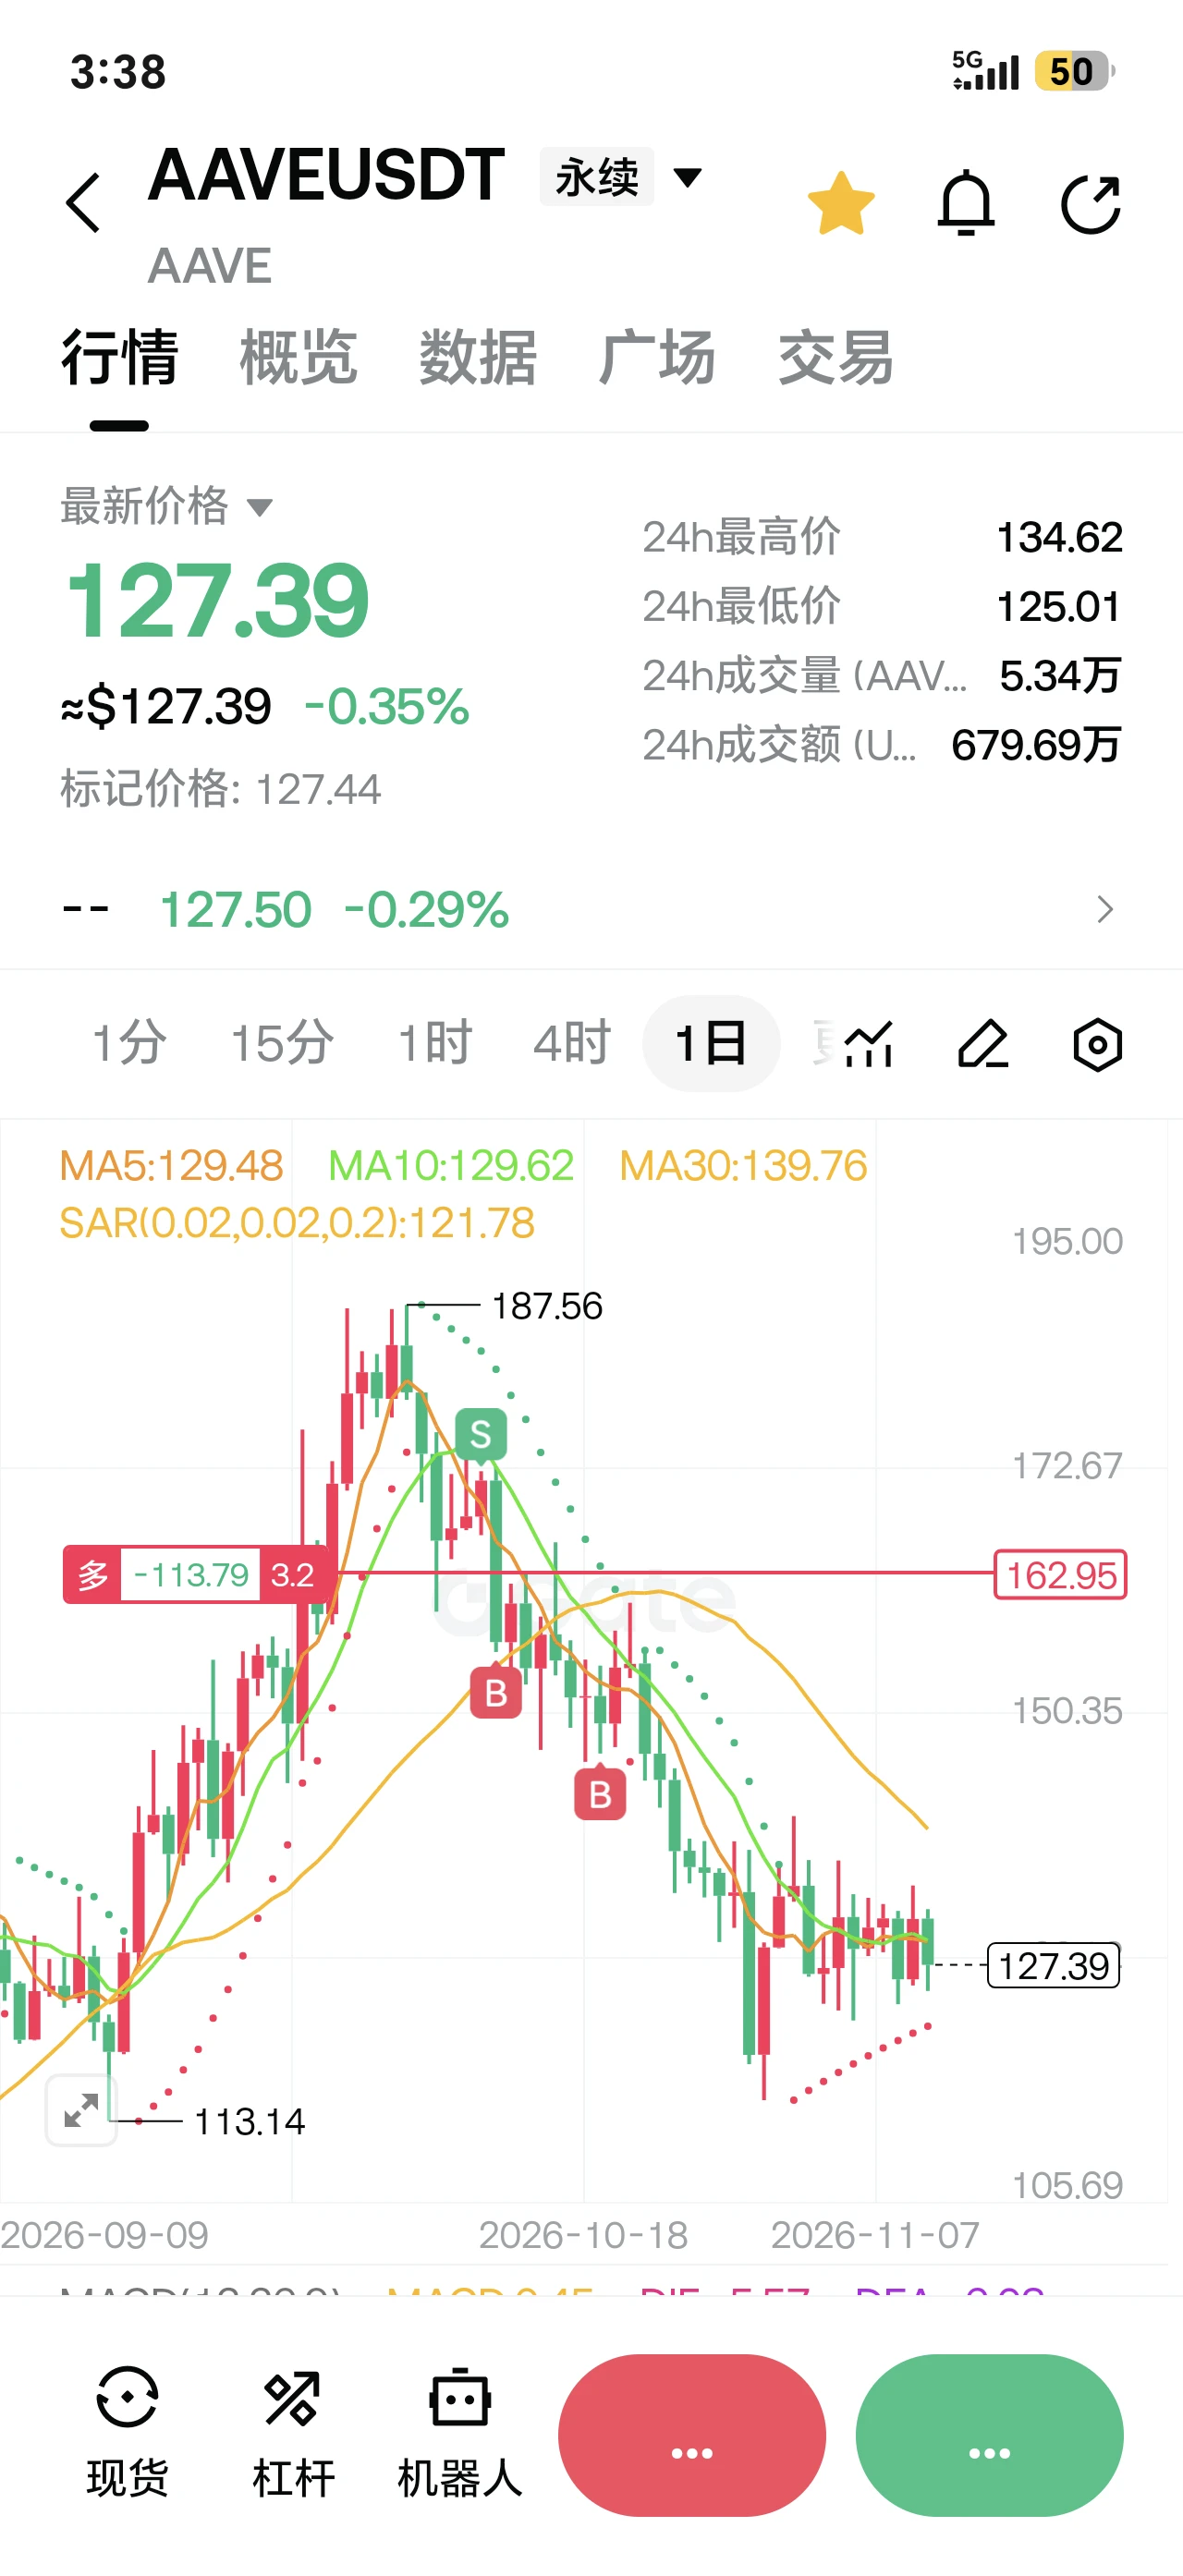
$AAVE It has been moving sideways for 12 days without making a new low. The longer it consolidates, the higher it can rise. AAVE is gearing up for a massive surge: it could happen as soon as this week or as late as next week, and AAVE is sure to print a big bullish candle of 10%+.
post-image
[The user has shared his/her trading data. Go to the App to view more.]
AAVE-1.17%
Why Do You Need to Gain 100% to Break Even After Losing 50%? Uncovering the Asymmetry of Compounding

In cryptocurrency trading, many people focus only on how much they lose in a single trade, while overlooking how much it takes to recover their original capital after a loss. The relationship between account losses and gains is not simply symmetrical, and this is a mathematical principle that must be understood in long-term trading.

First, the loss percentage and the gain needed to break even are not equal.

Suppose an account starts with 10,000 USDT. After a 20% loss, 8,000 USDT remains. At
post-image
BTC fell to the 73k level, with net outflows from ETFs on 4 of 5 trading days, totaling approximately 1.28 billion. During the price pullback, this should have been a window for institutional funds to accumulate on dips, but there has been no sustained inflow through ETF channels. This is the first weak signal.

  A clearer picture of actual spot supply and demand comes from on-chain data. Glassnode data as of November 8 show spot CVD falling to -91.8 million, meaning that aggressive sellers still dominate the spot market.

  What truly worries me has never been how much the price has fallen,
post-image
BTC-0.65%
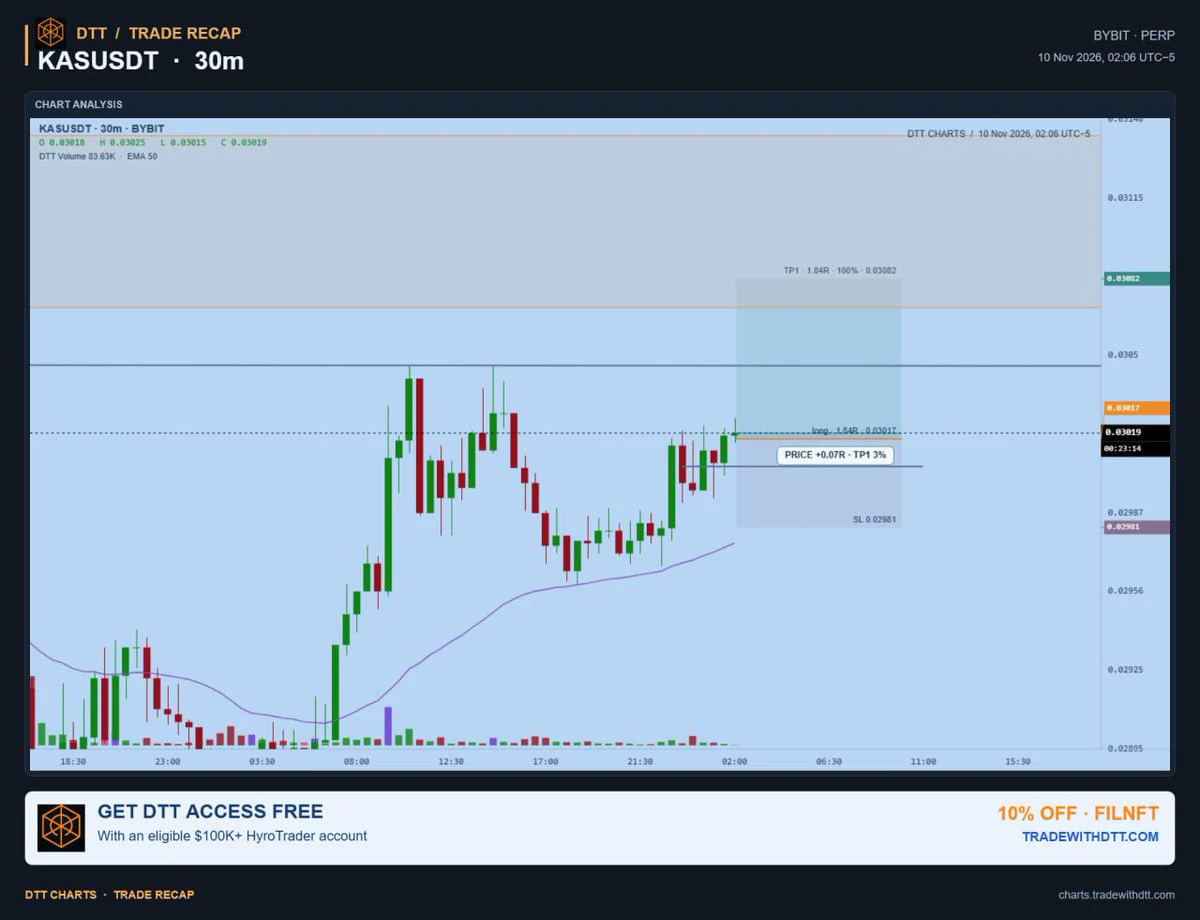
Went long on $kas here
sl: $0.02981
Tp: $0.03082
— DTT
post-image
KAS+0.33%
Load More

Join 40 M users in our growing community

⚡️ Join 40 M users in the crypto craze discussion

💬 Engage with your favorite top creators

👍 See what interests you

Trending Topics

USCPIDataIncoming

51.68k Views2.25k Discussing

The U.S. October CPI report will be released on November 10 at 8:30 a.m. ET. September CPI came in at 3.7% year over year, and markets will be watching closely for signs that inflation is cooling, especially in core CPI. A softer-than-expected reading could strengthen rate-cut expectations, while hotter inflation may pressure risk assets through higher Treasury yields and a stronger dollar. How do you think this CPI print will move $BTC, U.S. stocks and gold?

USIranTalksShowNewProgress

8.68k Views1.28k Discussing

KoreanStocksJumpOver5%

5.56k Views4.89k Discussing

View More