




Share your thoughts
placeholder
Article
Most traders are about to get blindsided by SYMAs next move.

$ZAMA /USDT - SHORT

Trade Plan:
Entry: 0.08614 – 0.08904
SL: 0.10151
TP1: 0.07715
TP2: 0.07020
TP3: 0.05976

Why this setup?
Why now? The 1h price is sitting at 0.08759, right inside a tight entry zone between 0.08614 and 0.08904, which sets up a clean short setup. The daily trend is range-bound, meaning momentum is exhausted and a mean-reversion push lower has room to run. The 15m RSI at 59.75 shows the asset is still slightly bullish, so a reversal into the short bias would catch crowded longs off guard. The 1h ATR of 0.005798
ZAMA+15.14%
The market has been 💚 for several months
Just because it turned ❤️ for one day, voices started talking about bottoms
Sunday has always been red 90% of the time for years
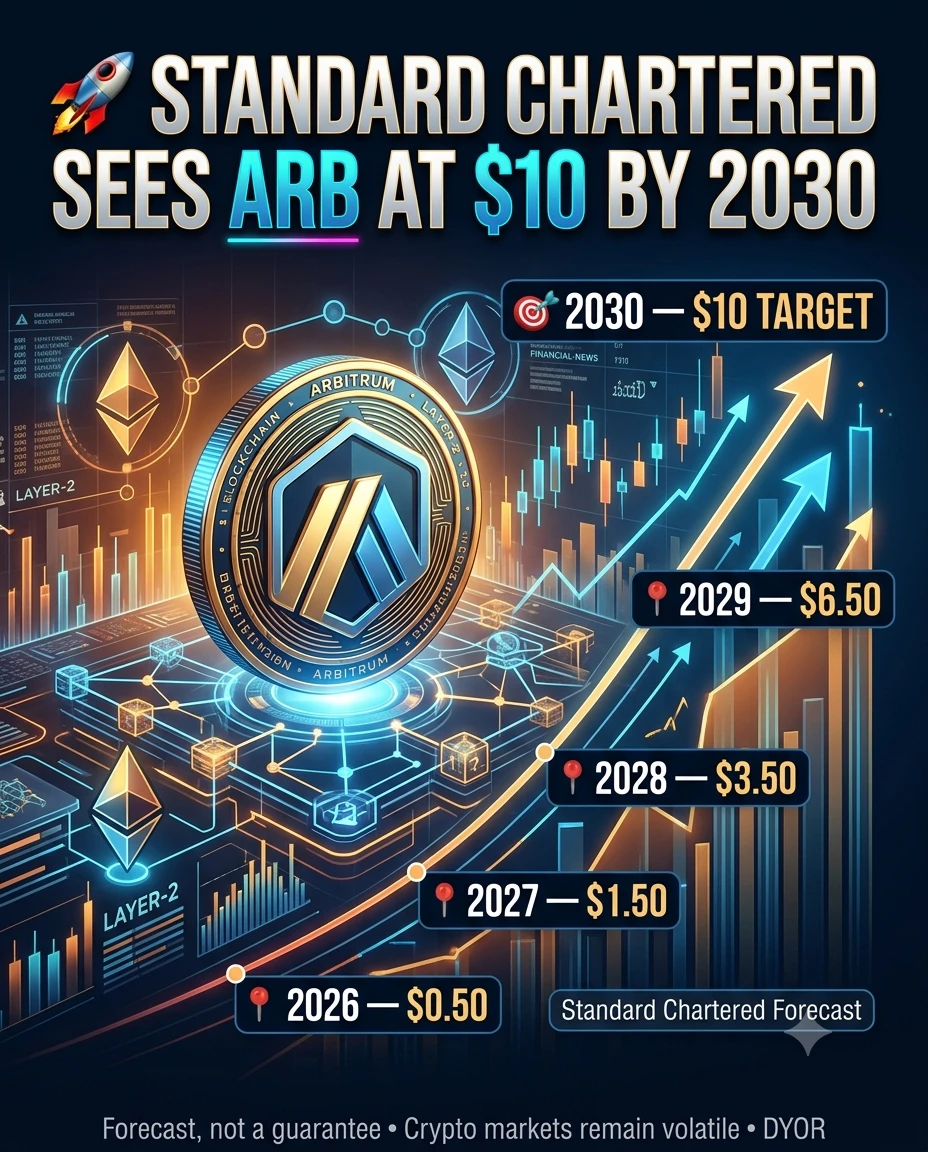
🚀🔵 #StandardCharteredSeesARBAt10By2030
Standard Chartered has initiated coverage on Arbitrum ($ARB ) with a $10 end-2030 price target. 📊🔥
📍 2026: $0.50
📍 2027: $1.50
📍 2028: $3.50
📍 2029: $6.50
🎯 2030: $10
The bank points to Arbitrum’s role in bringing traditional financial activity on-chain, including tokenized assets and infrastructure for financial institutions. Robinhood Chain is highlighted as an important example of this strategy. 🌐🏦
⚠️ This is Standard Chartered’s forecast, not a guaranteed outcome. Crypto markets remain highly volatile. DYOR.
#ARB #Arbitrum #Crypto #Ethereum
post-image
ARB+1.51%
ETH-2.28%
After a busy day,
I can finally go home and get some good rest✨
post-image
$ETH is waking up!
Ethereum jumped 6.5% to around $2,619, reclaiming levels not seen since January.
• 207M+ non-empty wallets
• 40M+ ETH staked
• ~$50B DeFi TVL
• $143.7M ETH ETF inflows
• Whale activity picking up 🐋
But macro pressure is still there with higher rates and DXY above 100.
The big question now:
Can $ETH turn this rally into a sustained breakout? 👀
ETH-2.28%
$CL /USDT could be hiding a bearish trap that most traders are ignoring right now.

$CL /USDT - SHORT

Trade Plan:
Entry: 97.07 – 97.29
SL: 98.25
TP1: 96.38
TP2: 95.84
TP3: 95.03

Why this setup?
Why now? The 4h trend is range-bound while the 1h price sits at 97.18, creating a tight entry zone between 97.07 and 97.29 where momentum is coiling. The 15m RSI at 56.25 shows neither overbought nor oversold, leaving room for a directional break, and the 1h ATR of 0.446973 tells us the average hourly move is small enough that a sharp drop could hit the first target at 96.38 quickly. If that level
CL+1.37%
Is the 1h RSI quietly printing a bearish setup while everyone chases the range?

$TRUMP /USDT - SHORT

Trade Plan:
Entry: 2.00 – 2.02
SL: 2.10
TP1: 1.94
TP2: 1.90
TP3: 1.83

Why this setup?
Why now? The daily trend is range, but the 1h RSI sits at 44.07, showing bearish momentum without oversold exhaustion. The 1h ATR of 0.037993 means each candle can swing nearly four cents, which turns the entry zone between 2.00 and 2.02 into a high-probability short setup. The invalidation level at 2.06 is the line in the sand that stops this trade. From the entry reference of 2.01, TP1 targets 1.94 and
TRUMP-1.41%
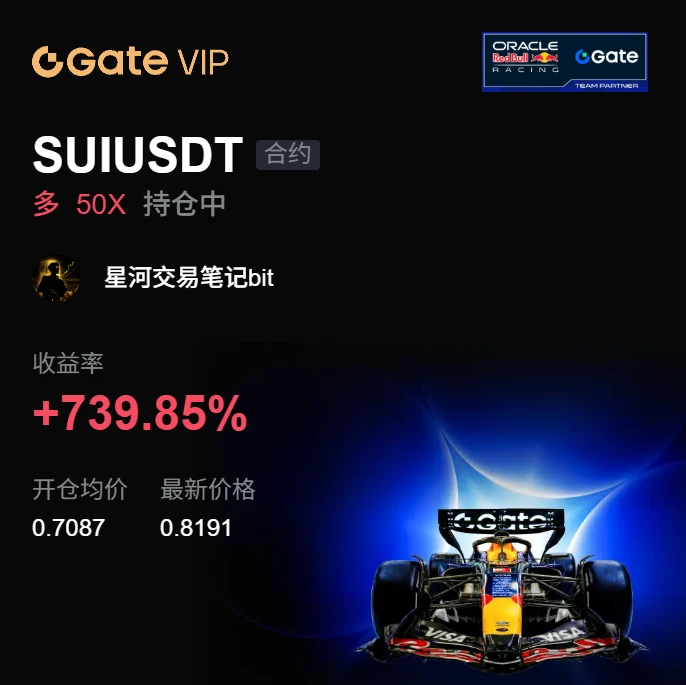
This $SUI long position has been held until now not by guessing the direction, but by confirming the pullback above 0.7087. When the price first surged to 0.8162, I did not chase it. I waited for it to pull back without breaking the short-term moving average, then added to the position as planned. Current unrealized profit is +731.01%.
Structurally, the moving averages are beginning to fan upward, but what really matters is that the key level at the previous high has not been fully cleared. As long as the price remains above the key pullback level, the bullish structure remains intact; if it
post-image
SUI-4.10%
BNB-1.91%
LAB-1.48%
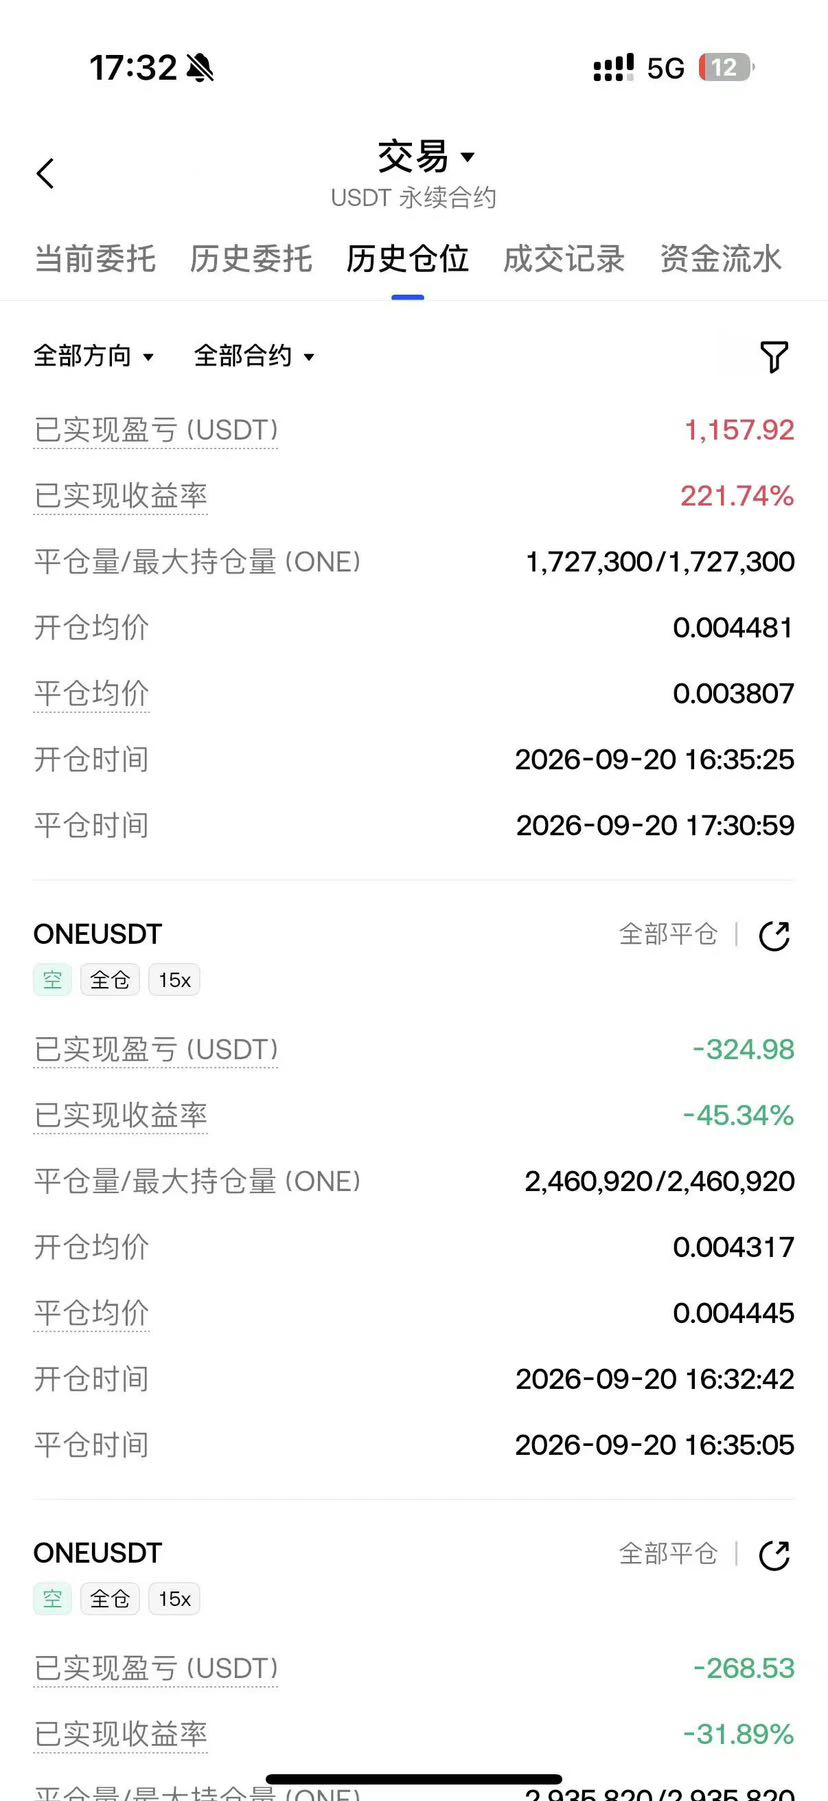
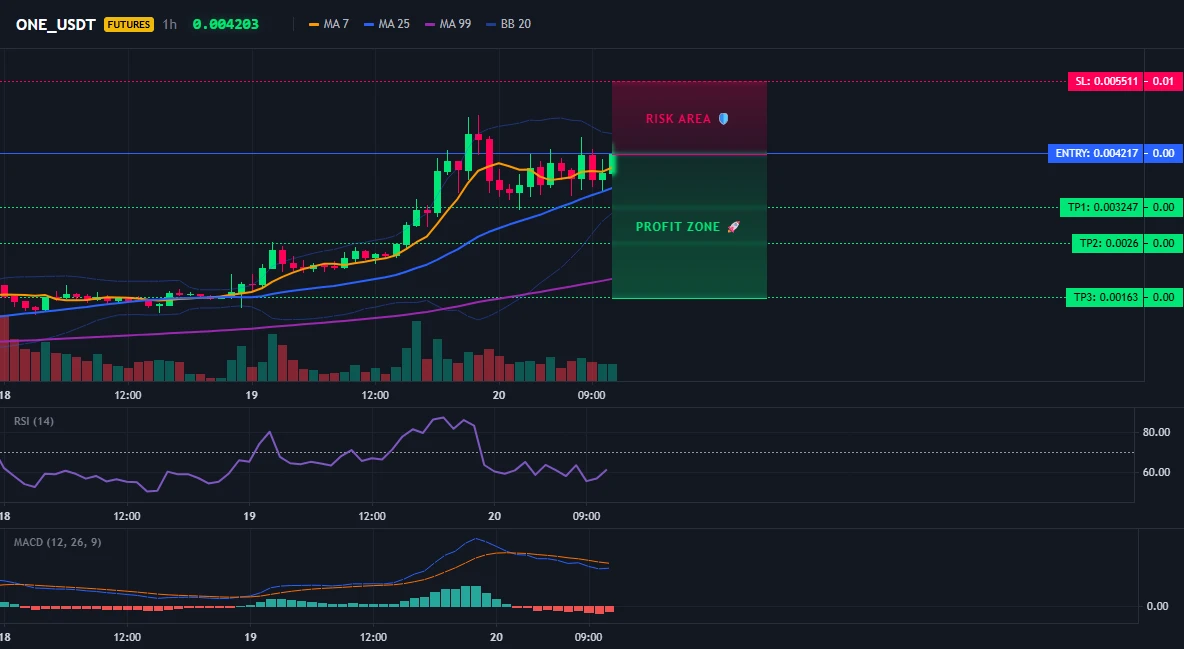
Insiders are quietly stacking shorts on $ONE /USDT while the market sleeps.

$ONE /USDT - SHORT

Trade Plan:
Entry: 0.004082 – 0.004352
SL: 0.005511
TP1: 0.003247
TP2: 0.002600
TP3: 0.001630

Why this setup?
Why now? The daily trend is range, which often precedes a directional breakout, and the 1h price sits at 0.004216, right inside the defined entry zone of 0.004082 to 0.004352. The 15m RSI at 61.97 shows the short-term bounce is running out of steam, while the 1h ATR of 0.000539 tells us volatility is compressed enough for a sharp move. The first target sits at 0.003247, with a deeper ob
post-image
ONE+74.44%
Nobody is talking about the quiet move in SYMBOL right now.

$TRUMP /USDT - SHORT

Trade Plan:
Entry: 2.01 – 2.03
SL: 2.11
TP1: 1.95
TP2: 1.91
TP3: 1.84

Why this setup?
Why now? The daily trend is range, which means the 1h ATR of 0.037993 is compressing into a tight band and the 15m RSI at 42.14 is drifting below neutral, giving the short setup room to breathe before the 1h price at 2.02 tests the entry zone between 2.01 and 2.03. The invalidation level of 2.06 is the line in the sand that separates a calculated fade from a blown trade, and the target ladder of TP1 at 1.95, TP2 at 1.91, an
TRUMP-1.41%
$BTC September, the “worst month,” has actually turned green this year!
Historically, September has always been one of Bitcoin’s toughest months. But so far this year, the monthly candle is still up! Even more remarkably, there has never been a three-month winning streak during a bear market. Now BTC is just a few days away from breaking this historical pattern! In many past cycles, September was typically a weak month for Bitcoin, but this year the market has completely defied the seasonal script. More importantly, if the month ultimately closes higher, BTC will complete three consecutive bul
post-image
BTC-1.04%
ZEC-5.78%
Fishing at the estuary tonight—let’s see how many fish we can catch. 😃
#SeaFishing
post-image
#BTCRetakes80K In September 2026, the crypto market experienced a textbook case of inverse pricing.
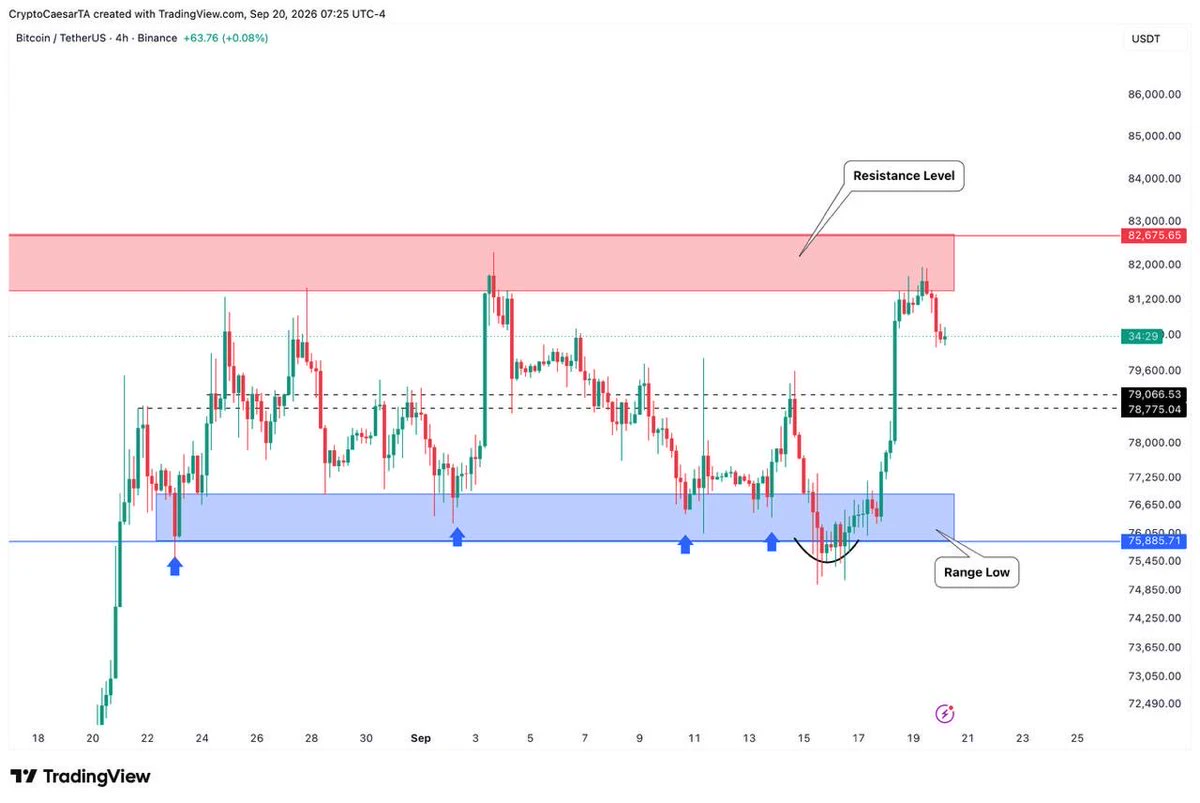
Amid the double shock of the Federal Reserve announcing its first 25-basis-point rate hike since July 2023 and the U.S. Senate rejecting the procedural motion for the CLARITY Act by 49 votes to 50, Bitcoin not only held above the key support level of 76,000 USD but instead launched a short squeeze rally on September 18, gaining approximately 6% and climbing back above 81,000 USD. As of September 20, 2026, based on Gate market data, BTC was fluctuating within a narrow range around 81,000 USD, wit
post-image
GateBlog
Rate Hike and CLARITY Roadblock: Why Did Bitcoin Rise Instead of Fall Amid the Double Negative Factors?
In September 2026, the crypto market experienced a textbook case of inverse pricing.
Amid the double shock of the Federal Reserve announcing its first 25-basis-point rate hike since July 2023 and the U.S. Senate rejecting the procedural motion for the CLARITY Act by 49 votes to 50, Bitcoin not only held above the key support level of 76,000 USD but instead launched a short squeeze rally on September 18, gaining approximately 6% and climbing back above 81,000 USD. As of September 20, 2026, based on Gate market data, BTC was fluctuating within a narrow range around 81,000 USD, with an intraday price range of approximately 81,088 USD to 81,156 USD.
This was not a simple oversold rebound. Rising interest rates pushed up risk-free yields, and by traditional estimates,
BTC-1.04%
  • 9
  • 1
$BTC is running into the same resistance again.
We need to make that higher high for a next possible leg.
However, there $100M in $BTC sell orders standing between price and its first higher high.
post-image
BTC-1.04%
$AKE Signal】1H negative funding short squeeze + Bollinger Band expansion, longs continue attacking
$AKE 1H RSI 92.86, 4H RSI 90.53, with the 4H Bollinger upper band at 0.0974 directly pierced by the current price of 0.1150. Funding rate at -0.8456%, with short holding costs continuing to bleed. Order book depth imbalance at -61.19%, buy/sell order volume ratio at 0.24, and thin overhead selling pressure. The 1H and 4H MACD histograms are expanding in sync, with buying pressure continuously lifting prices and momentum yet to fade. Negative funding combined with resilient price action and flat
AKE-21.43%
$ADA
entry 0.222TP1: 0.218TP2: 0.214TP3: 0.209 Stop loss: 0.227 Price pressure near the current area, with sellers attempting to regain control. If a rejection signal appears here, it could open the way toward lower support areas.
post-image
ADA-1.95%
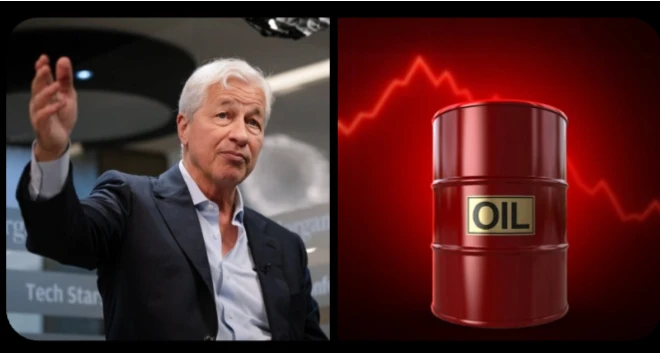
JPMORGAN WARNS OF AN OIL
SUPPLY CRUNCH
JPMorgan says global oil inventories entered 2026 at around 8.4 BILLION barrels, but the truly usable buffer is estimated at only about 800 MILLION barrels because of operational constraints.
If the Strait of Hormuz remains closed, inventories could approach an operational floor of around 6.8 BILLION barrels, potentially putting serious pressure on the global energy system.
At that point, it's no longer just a price problem it becomes a physical supply problem.
A prolonged energy shock could also send volatility across global markets, including $BTC USDT
post-image
BTC-1.04%
ETH-2.28%
Layout for Bitcoin, Ethereum, and Dogecoin
live-cover
LIVE1,460
Bro, you’re showing me some love—I made a little profit!
Altcoins have indeed been doing great lately. Follow Lao Jiu and feast with us🥩
$ONE $AKE
post-image
ONE+94.40%
AKE-20.25%
Load More

Join 40 M users in our growing community

⚡️ Join 40 M users in the crypto craze discussion

💬 Engage with your favorite top creators

👍 See what interests you

Trending Topics

MSTRTopsNasdaq100

73.81k Views2.83k Discussing

Strategy (MSTR) has gained about 48% over the past month, making it the best-performing stock in the Nasdaq 100, while Bitcoin rose roughly 12% over the same period. The company holds 845,050 BTC with a cumulative cost basis of about $63.73B. MSTR is not a pure Bitcoin proxy — its price swings can be more extreme. Can this rally last?

Gate Tops 24H Net Inflows Among Exchanges

26.33k Views3.67k Discussing

BTCRetakes80K

56.85k Views60.28k Discussing

View More