Square
Following
Hot
News
Profile
Share your thoughts
placeholder
Article
$BTC On-chain data shows a daily net inflow of around 258 coins, with extra-large orders making up the main source of buying. But the price has continued to swing around the 80k level without moving decisively in either direction. Large holders seem to be quietly accumulating at lower levels, with no signs of an active short-term push higher.
$ET The net inflow is around 4,275 coins, with a relatively healthy fund structure and large buy orders appearing at the same time. Unfortunately, its ability to move independently is weak, and it is still being driven by Bitcoin’s pace.
$SOL The net inf
post-image
SOL+0.05%
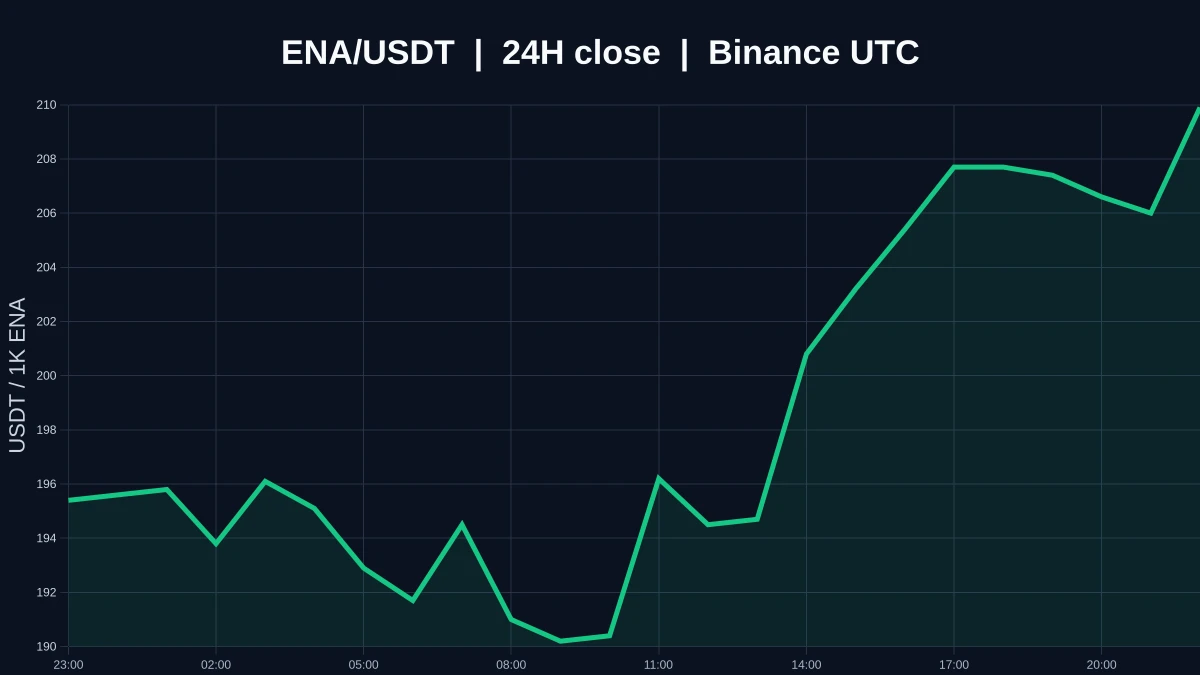
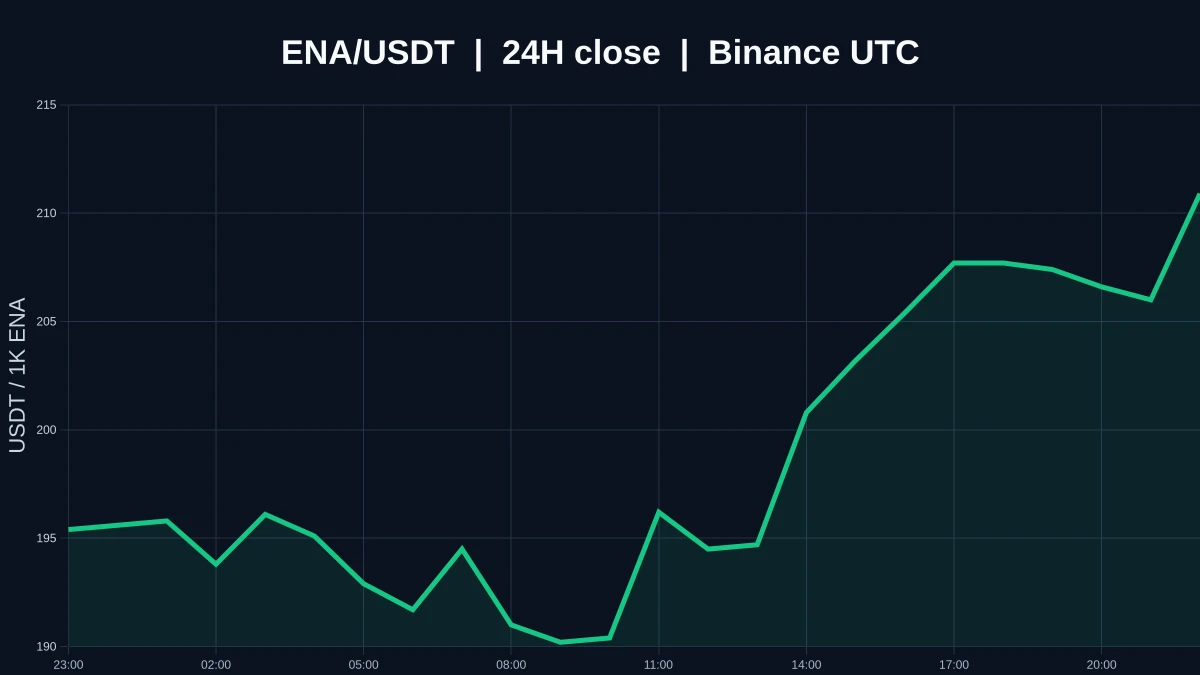
$ENA is currently at 0.2099, up 9.1% over 24H (range: 0.1887–0.2116). The 1H is strong with an RSI of 84, while the 4H is also relatively strong with an RSI of 53. If it holds above 0.2116, it could reach a new high; a break below the 0.1887 support level warrants caution. The market is volatile; for observation only.
post-image
ENA+7.95%
Trenches
STONK
S
bade
b
STONK
6GmA...UNgx
Market Cap
$.
Change
.
24h Vol
$.
Holders
.
BTC
B
bade
b
BTC
C5xp...pump
Market Cap
$.
Change
.
24h Vol
$.
Holders
CNPY
C
bade
b
CNPY
0xc6...ddd2
Market Cap
$.
Change
.
24h Vol
$.
Holders
.
LAUNCH
L
bade
b
LAUNCH
AhBi...Qj6C
Market Cap
$.
Change
.
24h Vol
$.
Holders
.
ZIG
Z
bade
b
ZIG
0x8c...1145
Market Cap
$.
Change
.
24h Vol
$.
Holders
.
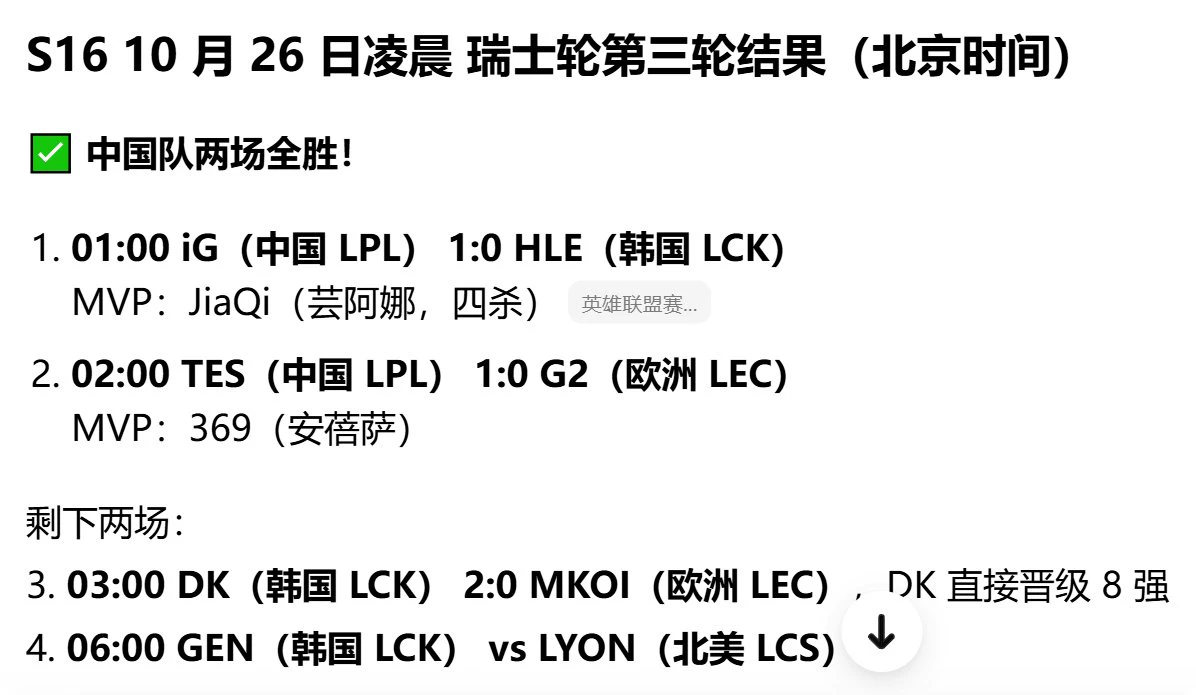
I don't have time to watch the games; I just check this result every day
post-image
a16z-backed DATA just retired its own blockchain and moved onto Sui, with a $30M check from the Sui Foundation attached.
That's a team choosing to rent instead of build, guys.
Stack that on Samsung Wallet bringing USDC on Sui to 82M US Galaxy phones, and Mysten Labs handing its CTO Evan Cheng a dedicated AI unit to run.
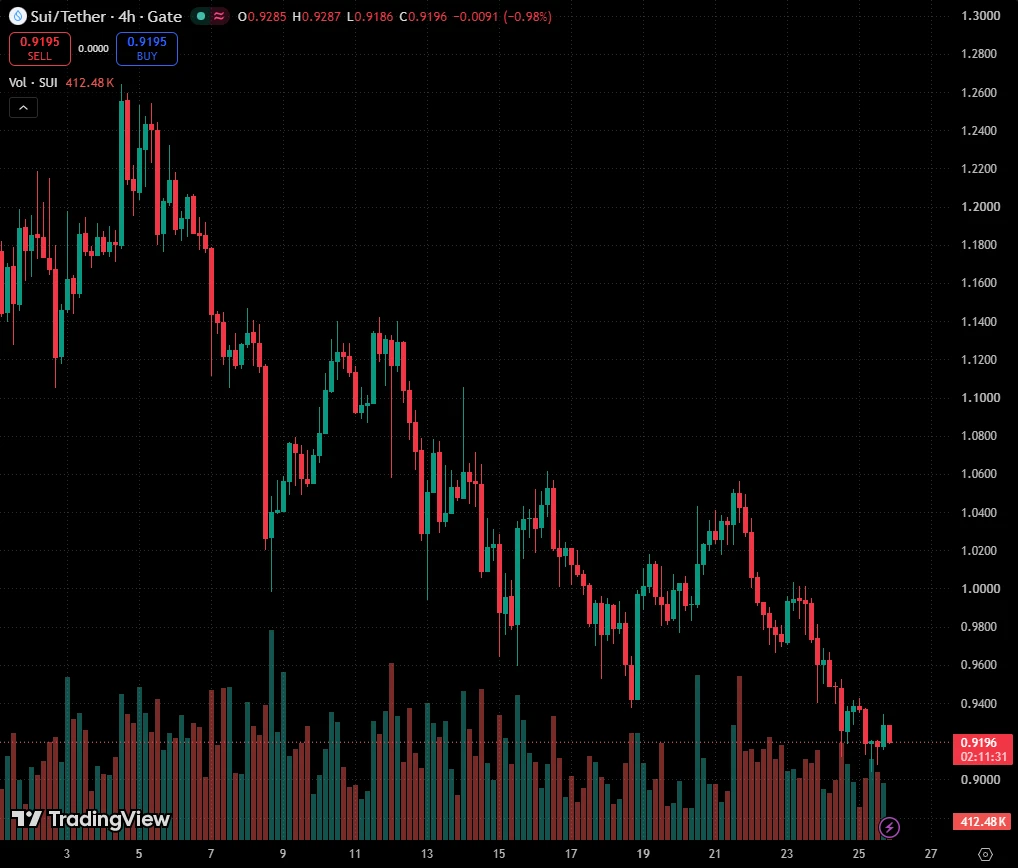
And sui:native? Around $0.92, back under a dollar.
Builders keep moving in while the chart keeps sliding, right?
How long can that gap stay open?
post-image
SUI-0.91%
USDC+0.00%
SAMSUNG+0.00%
📘 How is the spread in Venezuelan P2P really calculated? The essential guide breaks it down using data from the October 25 P2P Radar, and the difference between the overall average and the top of the book is key to avoiding overpaying.
The benchmark data:
• Buy USDT: Bs. 1.015,51
• Sell USDT: Bs. 985,15
• Official BCV rate: Bs. 887,30
• Premium over BCV: 14,45%
• Overall spread: 3,08% (Bs. 30,36 per USDT)
• Offers observed: 173
• P2P traffic light: yellow, 71 points
The spread is the difference between the buy and sell prices: 1.015,51 − 985,15 = 30,36 Bs., or 3,08% of the sell price. But kee
$SUI SUI analysis
SUI analysis:
The price is currently testing a major support area, which may lead to a bounce. Additionally, there is a falling wedge pattern; a breakout from this pattern could result in a significant upward rally. Consider opening long positions, but be sure to use a tight stop-loss.
post-image
SUI-0.90%
What's the next mega viral project?
#100x #memecoins
post-image
MEGA+0.28%
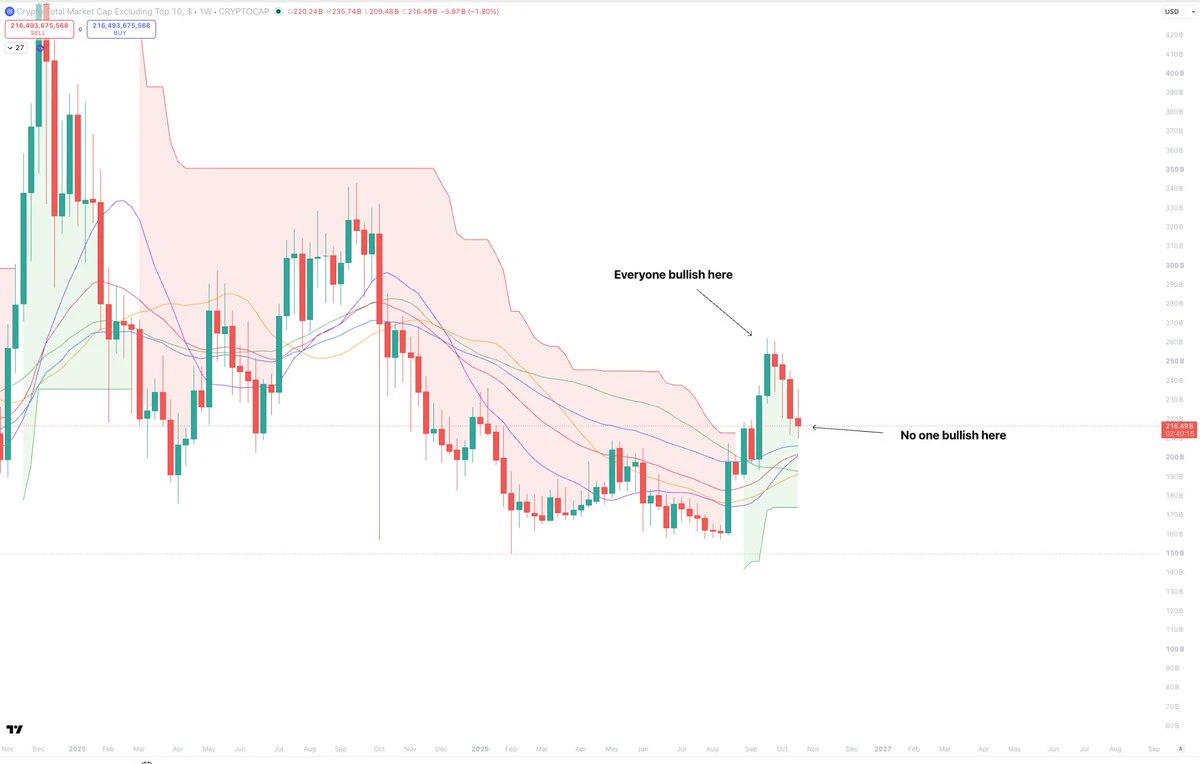
Altcoins also look great here.
It's looking like we're about to put in our 4th red weekly candle, and the crowd has turned very bearish again.
OTHERS is an a strong weekly uptrend, also has not retested any of the key EMA + SMA's yet, and is holding structure.
There is nothing bearish about this chart guys.
If you were not positioned, and then decided to buy the local top... but are not buying now, what are you doing here?
It is always the same old story.
Everyone bearish at the low
Then many bullish at the local high
Then everyone bearish again on the pullback
How can you ever sell higher if
post-image
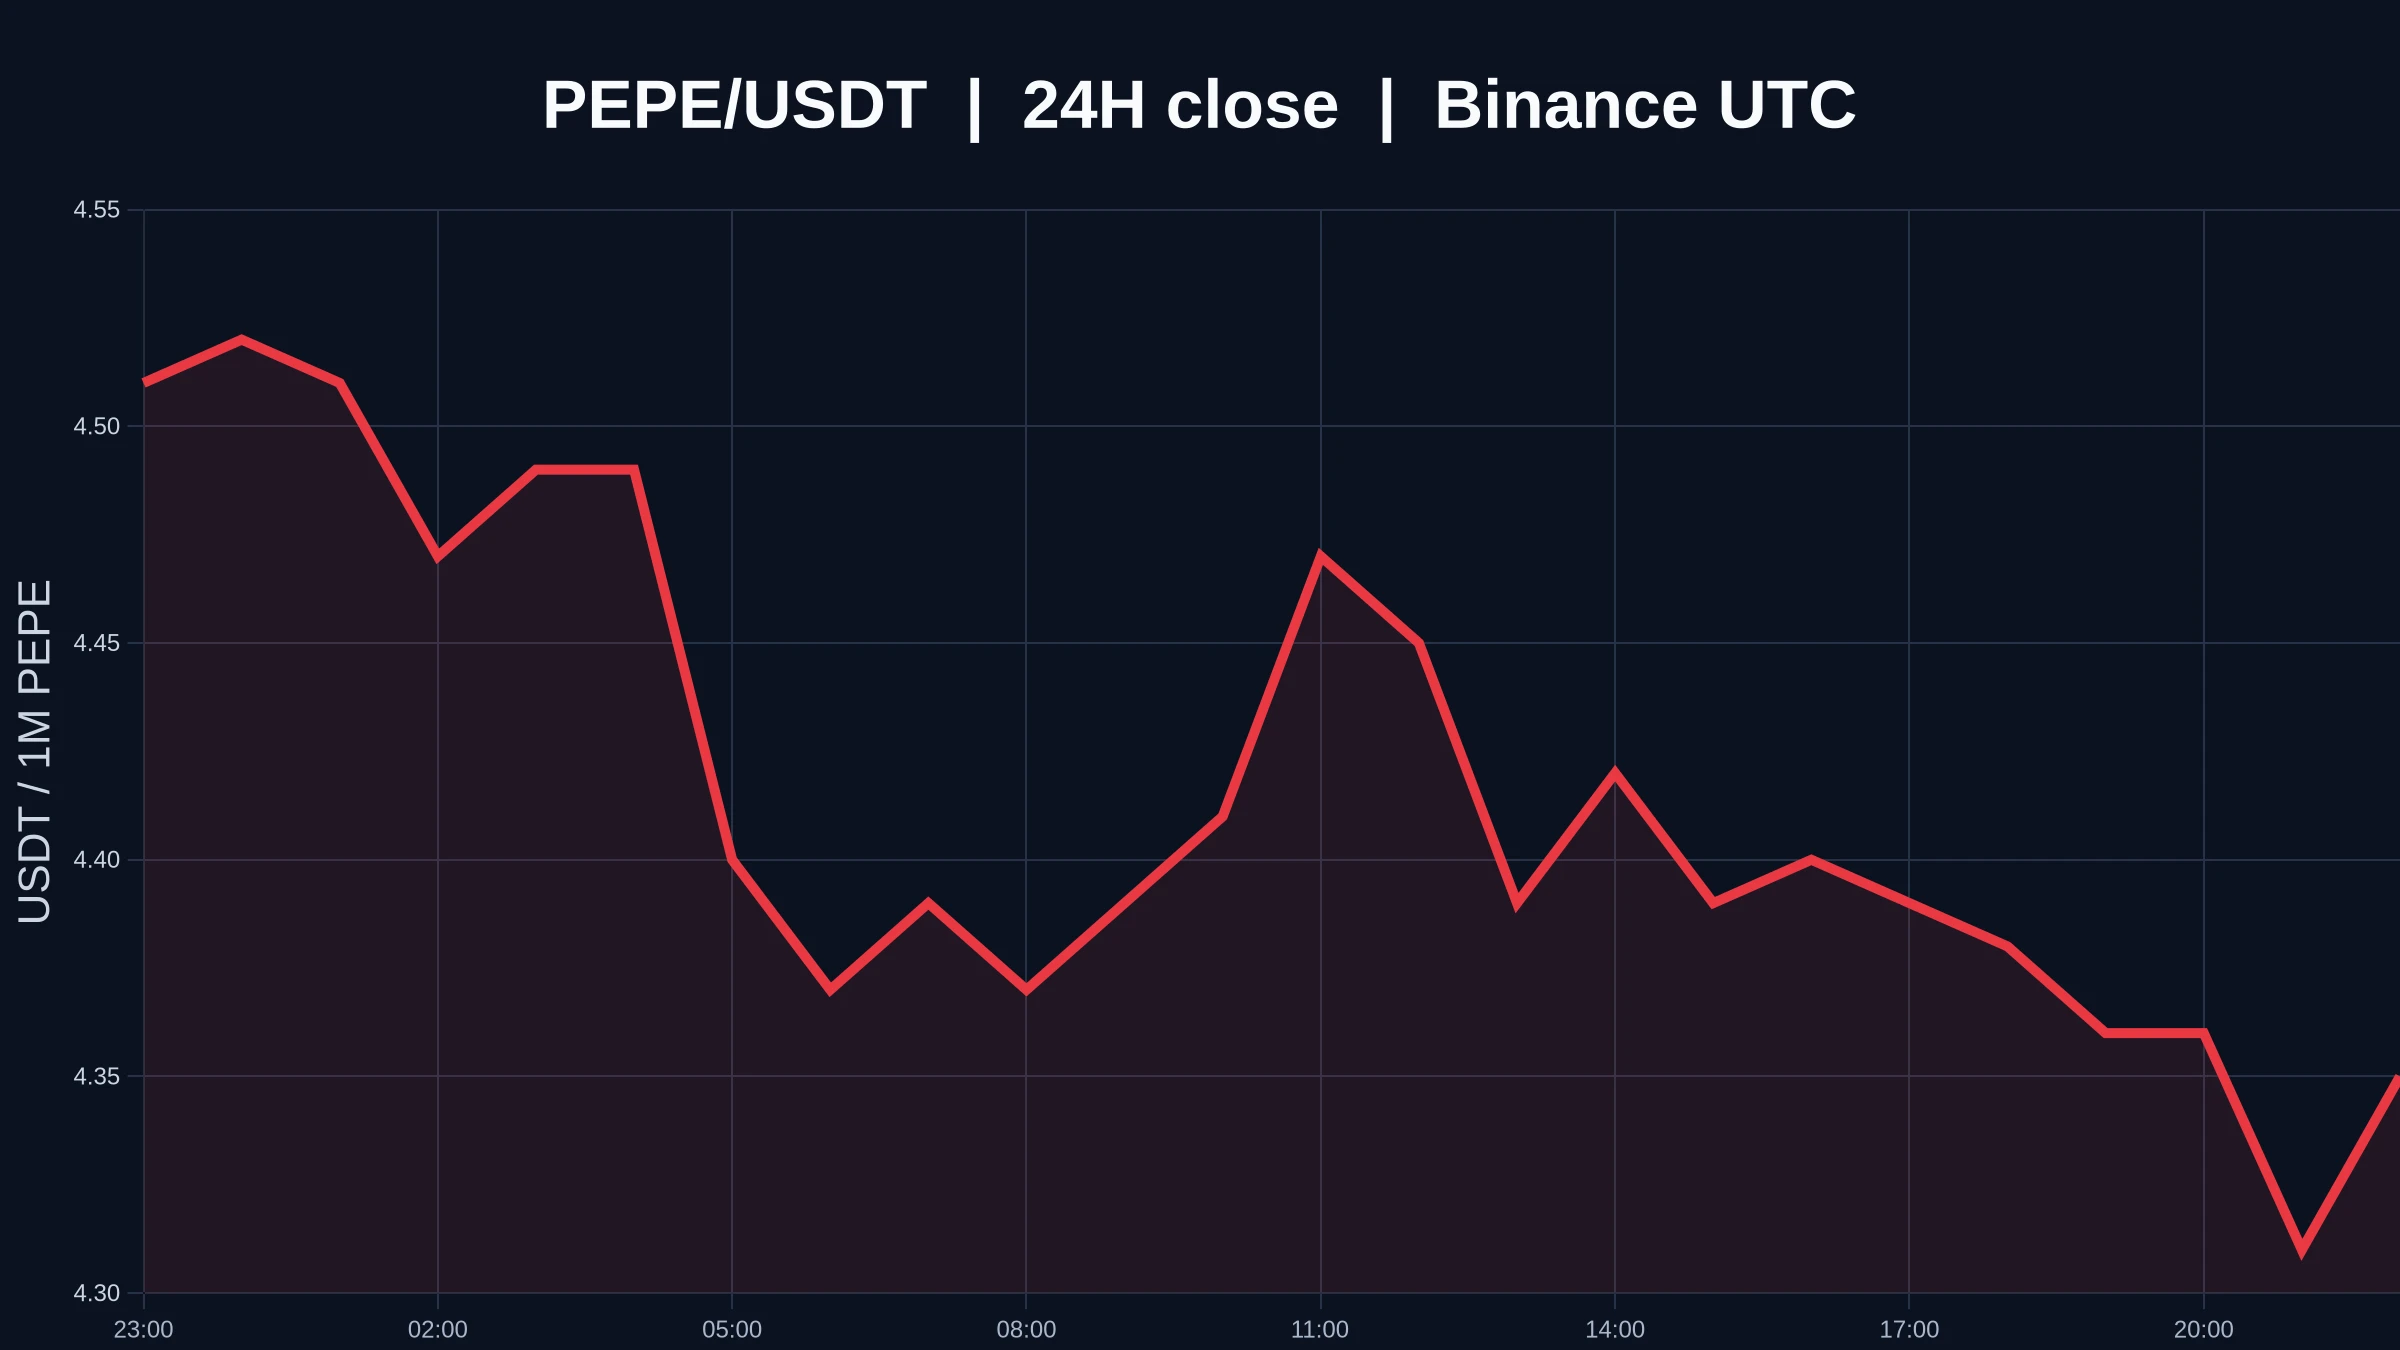
$PEPE being oversold doesn’t mean it has bottomed; what’s needed now is stabilization, not sentiment
$PEPE is now trading at 0.00000434 USDT, down -3.98% over 24 hours, fluctuating between 0.00000429 and 0.00000456. The 1-hour support is at 0.00000429, with resistance at 0.00000456. The 4-hour trend is weak, and trading activity is only 0.26x. In this snapshot, the price is already near the bottom of the range, but neither timeframe is signaling a reversal.
My view is that demand for a rebound has emerged, but until the structure stops weakening, I won’t call oversold conditions a bottom.
Ove
post-image
PEPE-4.05%
📣 🇺🇸 Thank you for your Attention to this matter!
post-image
$APR I bet it’ll fall back below 0.035 within 24 hours. I’ll wager a pack of Huazi cigarettes on it. It’s at 0.0403 now, up 35.84% in 24h. It surged to 0.0549 before getting slammed back down, with 495 million in trading volume. For a small-cap coin, that kind of volume is typical of an emotion-driven market, not a trend-driven one. Old Zhou in the group was just shouting, “It’s going to 0.08.” Let me pour some cold water on that: take a look at the candlesticks. That wick at 0.0549 plunged deep, showing that selling pressure overhead is piled up like a mountain. Anyone chasing in now will be
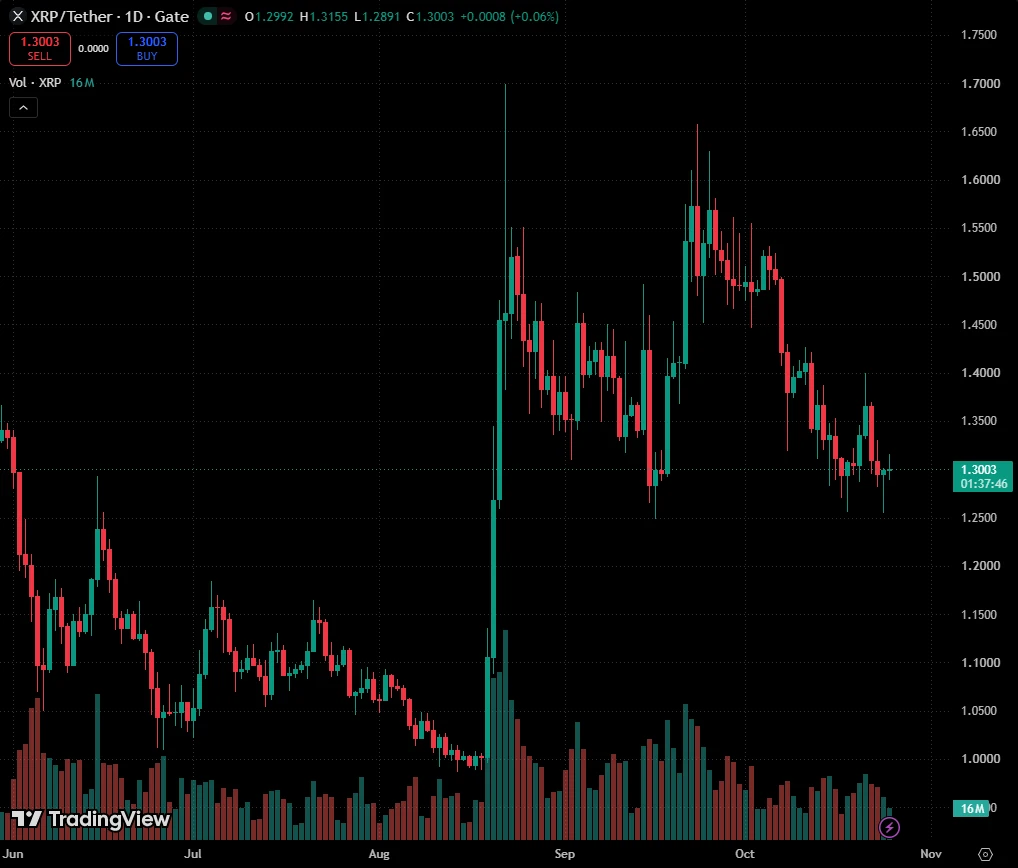
$XRP XRP Got One Bounce in October. It Was Rejected. 1.21 Next?
XRP has had exactly one real bounce in the second half of October, and the monthly grid shut it down.
This is the October monthly grid, built from September's high, low and close, on daily candles. The pivot is 1.4650. The S 0.184 zone, the bottom of the neutral range, runs from 1.3679 to 1.4049. S 0.382 is at 1.3079, and the S 0.702 zone runs from 1.1417 to 1.2108.
XRP lost the neutral range in mid-October and closed under S 0.382 for the first time on Oct 17, at 1.2941. Then on Oct 21 it bounced to 1.3992, right inside the S 0.1
post-image
XRP+0.60%
Time Series—The Asymmetry of Time
Also known as the arrow of time
Refers to the one-way nature of time
in physical, philosophical,
or experiential terms:
it flows from the past to the future and is irreversible.
This concept gives rise to several
related concepts and perspectives:
1. Entropy and the Second Law of Thermodynamics
The asymmetry of time is closely related to the Second Law of Thermodynamics.
The law states that the entropy (disorder)
of an isolated system
always increases over time. This one-way increase in entropy
is one of the physical foundations of the arrow of time.
For exam
post-image
$BTC Current price 80489. The leveraged long/short ratio remains elevated, with borrowing to go long clearly outweighing borrowing to short. The market has pulled back a little, but bullish sentiment remains strong—when sentiment is this aligned, it’s worth staying alert for a potential reversal. 80000 is the short-term dividing line between strength and weakness. Don’t rush to draw conclusions before key news breaks.
$ET 2346. The long/short ratio is also rising, with bulls continuing to increase their borrowing to go long. The price is weakening along with the broader market, with little ind
post-image
BTC-0.20%
ET+1.94%
10.26 Qiqi Discusses Gold Morning Review: A slight rebound from the lows—do not mistake it for a reversal signal!
Gold prices fluctuated slightly within a low range during the morning session, recovering modestly. The current price is near 3998. Overnight, prices retested the 3990 area at their lowest, then climbed to 4004 before facing resistance and pulling back—a brief consolidation after a sharp drop.
On the one-hour chart, the moving averages remain bearishly aligned, with prices trading below them. The broader downtrend remains unchanged. The MACD is below the zero line, and the red bars
post-image
XAU+0.25%
$ENA is currently trading at 0.2083, up 9.57% over 24H (range: 0.1887–0.209). The 1H trend is strong, with RSI at 84; the 4H trend is strong, with RSI at 51. If it breaks above 0.209 decisively, watch for further upside; if it falls below support at 0.1887, the short-term structure may weaken. Market volatility is high; for observation only.
post-image
ENA+7.95%
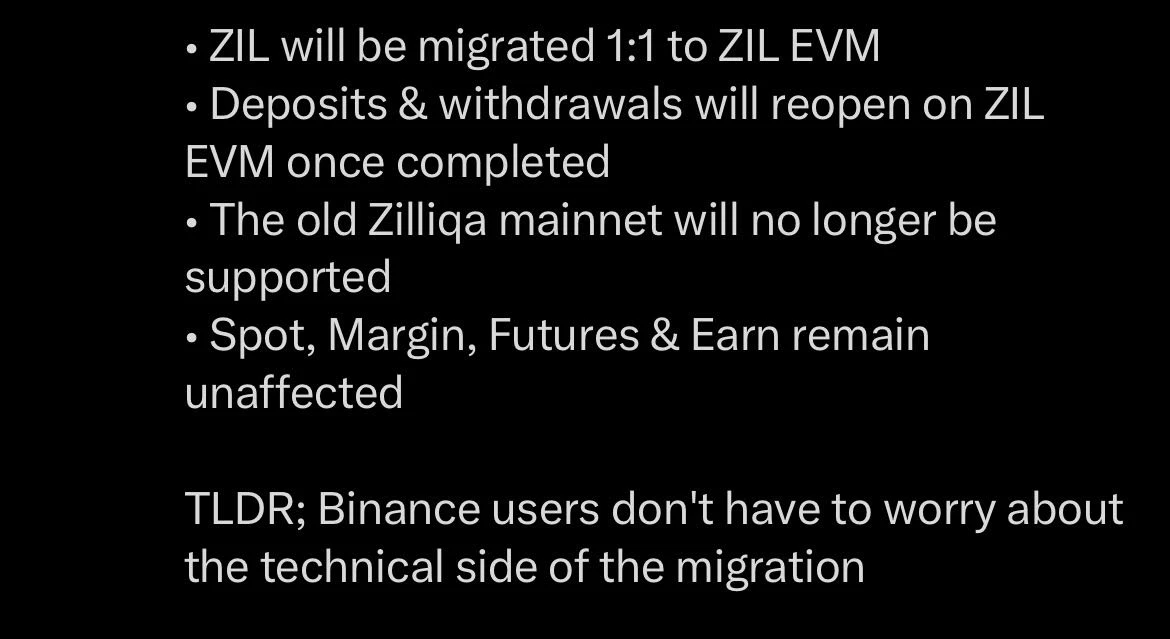
$ZIL migrates to zil EVM, a 1:1 upgrade; exchanges must update ZIL
post-image
ZIL-5.80%
$34.2 billion picks Ethereum, $XLM 0.1682 gets no love
Ethereum alone takes 47.1% of the $34.2 billion tokenized fund market. What about $XLM? It’s currently at 0.1682, down 1.407% over 24h. The bigger the market gets, the less love these old payment coins get. I’m bearish here.
Coinfomania reports that as of October 25, tokenized funds across 33 blockchains had reached $34.2 billion. After the news broke, $XLM drifted from 0.1694 to 0.1682, down 0.71%—money is choosing chains, just not this one.
First, the daily RSI is 34.9, and the MACD has been in a death cross below the zero line for 21 da
XLM-1.16%
Crypto Trade Today
live-cover
LIVE713
A whale/institutional entity holds ETH long positions worth over $270 million that are now on the ve
live-cover
LIVE1,755
Load More

Join 40 M users in our growing community

⚡️ Join 40 M users in the crypto craze discussion

💬 Engage with your favorite top creators

👍 See what interests you

Trending Topics

USEarningsSeason

106.47k Views3.54k Discussing

The U.S. Q3 earnings season is in full swing, with major tech companies including Tesla and Meta reporting results. Market focus is shifting beyond revenue and profit toward AI spending, capital expenditure, margins and forward guidance. Which company’s earnings are you watching most closely?

GateWCTCS9GlobalTradingCompetition

742.79k Views8.12k Discussing

USConsumerSentimentNearRecordLow

13.43k Views308 Discussing

View More