Share your thoughts
placeholder
Article
I had already finished complaining to my friends about this week's market, but now I have to take it all back. A little awkward.
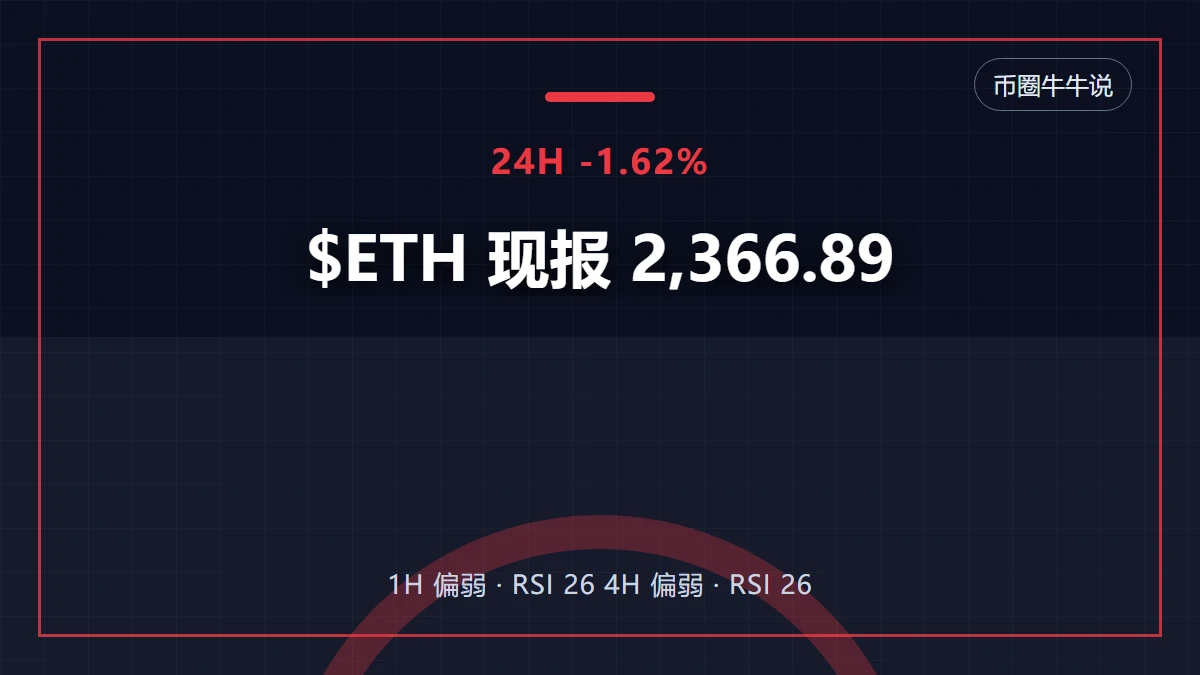
When it retested that afternoon a few days ago, I saw $ETH hold steady and buying strengthen, so I flagged that longs could enter around 1883.20. From 1883.20 to 2618.34, +6787.42%—those who got on board should have woken up laughing.
Don't let profits inflate, and don't despair over a pullback. Managing risk upfront is called rationality; cutting losses only after taking a hit is called a last-ditch sacrifice.
Take profit on 80% first, move the stop-loss on the rem
post-image
ETH+7.17%
BNB+3.47%
BTC+6.20%
The worst hit in this BNB Chain cycle were those who later believed in it and diamond-handed.
You missed Niulai’s bull run and Mars.
You welcomed Ben, the editor of Butterfly platform.
You welcomed the Four platform.
You thought they were going to go all out.
In the end, they all fell by more than 10x.
BNB Chain is like this: whenever you think it can make it, something goes wrong.
Whenever you think it cannot make it, it lets you cash out.
post-image
BNB+3.50%
牛来+17.09%
$BTC is looking strong, but I’d wait for a pullback before going long.
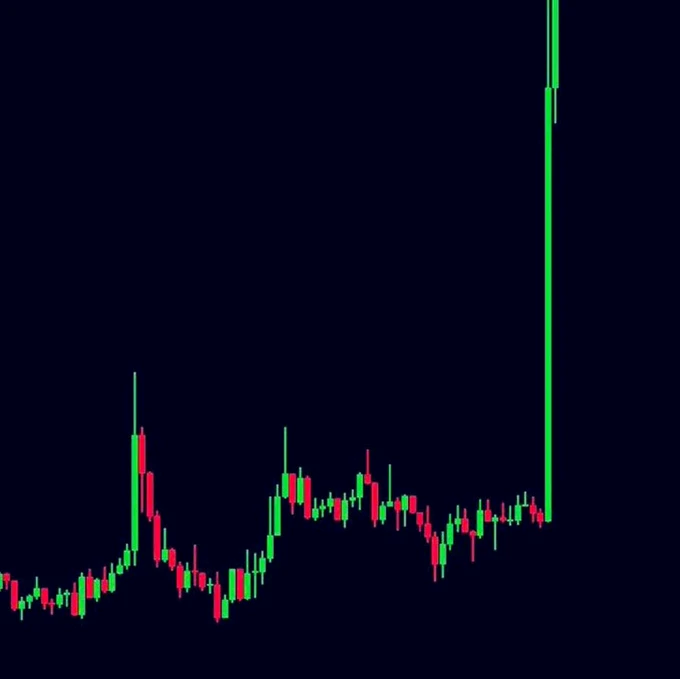
BTC just printed a huge 4H breakout candle and is now trading around $80.9K. Momentum is clearly with buyers, but entering after such a vertical move isn’t ideal. A retest would make the setup much cleaner.
Entry: $80,150–$80,500
Targets:
TP1: $81,200
TP2: $81,800
TP3: $82,250
Stop: $79,650
For me, $80K is the key area. If BTC holds that zone on a pullback, continuation toward the previous $82.2K high stays in play. A clean loss of $79.65K would weaken the setup.
#btc #USAIConceptStocksRally #BOJHikesTo1.25%31YearHigh
post-image
BTC+6.20%
  • 4
$BTC is back, back again. I said it definitely wouldn't fall any further—once it dips, let's go long.
BTC+6.20%
RAY, up 172.89% over 30 days, is up another 21.83% today: volume ratio 2.223, with no signs of fatigue
Wow, $RAY up 172.89% over 30 days, and up another 21.828% today, currently at 1.7754. The direction is clear: bullish intraday; buy dips, don’t chase highs.

The volume is real—full-day trading volume was 16.427 million USDT, 2.223 times the 30-day average, with a funding rate of 0.0 and no leverage in play.

Technicals are not overheated—daily RSI is 64.9 and not overbought, MACD has formed a bullish crossover above zero, and MA7 has been pressing MA30 for the 28th day.

The broader mark
RAY+18.57%
🎁 Gate FREE Spin Event
💰 Get> Random Reward
😎 For All User
••••••••••••••••••••••••••••••••••••••••••
😍 Join Here: https://www.gate.com/activities/pointprize/?now_period=23&refUid=2906717
😀Click Event Page & Earn Point
😀Spin and Try Luck
😀Done
300 Growth Points earns you a chance to draw
  • 6
  • 1
Many people chase long positions as soon as the funding rate turns positive, but this is precisely where they are most likely to get slapped—the funding rate is a thermometer of sentiment, not an entry signal.
$PROVE Current price 0.2126, 24h +7.54%; MA5 (0.21142) has crossed above MA20 (0.203645), forming a bullish alignment, and the MACD histogram at +0.0007454 remains bullish, so the trend structure is intact. However, RSI has reached 75.4 and entered the overbought zone, while the Bollinger upper band at 0.215216 is right overhead. The price is hugging the upper band, making the risk-rewa
post-image
PROVE+9.61%
ETH+7.20%
MARSCOIN-1.48%
$FOGO Long 10x | Pullback entered the demand zone, risk has been established.
FOGO has reached my designated long area. This position is active; if demand weakens, it will be invalidated. Trading plan: - Entry: 0.00669 – 0.00671- TP1: 0.00679 (R:R 1:0.8) - TP2: 0.00685 (R:R 1:1.3) - TP3: 0.00693 (R:R 1:2.0) - Stop-loss (SL): 0.00659 Why this setup? - This setup remains valid because the 4-hour structure and the bearish daily backdrop are interacting around 0.00669–0.00671. - The 15-minute RSI is 81, still allowing upward momentum to continue as long as buyers remain in control, but this area
post-image
FOGO+10.22%
#BOJHikesTo1.25%31YearHighBank of Japan Raises Rates as Inflation Pressure Builds
The Bank of Japan has raised its benchmark interest rate from 1.00% to 1.25%, taking borrowing costs to their highest level in 31 years. The decision, announced on September 18, 2026, represents another step in the BOJ’s gradual move away from the ultra-low interest-rate policies that shaped Japan’s economy for decades.
The increase was 25 basis points and was approved by a 7–2 vote at the BOJ’s two-day monetary policy meeting. Board members Toichiro Asada and Ayano Sato opposed the increase. The decision had be
post-image
Up 20% in just one day, ZAMA’s volume ratio hits 3.28x: how strong is this bullish candle?
Who could have seen this coming? $ZAMA surged 20% in one day (+19.8%), with the current price at 0.05947, 24h trading volume of 17438726 USDT, and a volume ratio of 3.28x. The direction is clear: I’m bullish, buying dips without chasing spikes.

The volume is genuinely surging—1h ADX at 64.7 signals a strong trend, not a low-volume fakeout.

The broader market is also providing a stage—79 assets up and 10 down across the market, BTC at 81125 above ma7/ma30, and U.S. crypto stocks averaging +13.9%.

L
ZAMA+22.77%
$NVDA is breaking above the 4H cup-and-handle neckline around $221–$222.
The key now is confirmation: holding above the neckline could turn this resistance into support and open a move toward $224–$225. A drop back below $220 would weaken the breakout and put the handle support near $218.5 back in focus.
Bullish 🟢 while the neckline holds.
#NVDA #Trading #TechnicalAnalysis #GateSquareMidAutumnReunion #GateTopsStockPerpetualCoverage
post-image
NVDA+1.49%
  • 9
  • 2
$AMD Is Attacking The Chinese Market With Edge AI
With US restrictions limiting AMD’s access to China’s high-end AI accelerator market, the company is shifting toward AI PCs
AMD is positioning the Ryzen AI Max+ 395 for local LLMs and autonomous AI agents
AMD is also expanding its local developer ecosystem. Its first AI Developer Day outside the US was held in Shanghai in May 2026, attracting more than 2,000 developers, while AMD is also building AI labs and university programs across China
post-image
AMD+2.76%
Nobody is talking about the quiet move in SYMBOL right now.

$ZEC /USDT - LONG

Trade Plan:
Entry: 1501.95 – 1518.09
SL: 1432.55
TP1: 1568.12
TP2: 1606.85
TP3: 1664.95

Why this setup?


Debate:
Are we testing TP2 at 1606.85 or is 1222.76 about to be tested first?

⚠️ Personal market analysis only. NFA — manage risk and DYOR.
Educational content, not investment advice or a recommendation to buy, sell, deposit, or withdraw any asset. No paid promotion or referral/affiliate links.
ZEC+8.32%
$SNXX I didn't exit at 18.1 this week, and I'm kicking myself now.
Let's review this trade: When it was at 14.57, I noticed consecutive large orders sweeping the order book and immediately entered with 30% of my position, at an average cost around 15.2. When it rose to 18, my unrealized profit was nearly 20%, but I got greedy, thinking the 24-hour trading volume of 500 million could push it past the previous high, so I didn't set a take-profit. As it turned out, 18.14 was the top. It has now pulled back to 18.04, giving back half the profit.
The lesson is: for coins experiencing explosive rall
SNXX+22.74%
#美股AI概念股全线反弹
A powerful session for US markets, especially for technology and AI-related stocks. After recent weakness, buyers returned aggressively, pushing the Nasdaq Composite higher by 1.69% to around 26,418. The S&P 500 gained 1.14% to approximately 7,638, while the Dow Jones Industrial Average added 0.61% to around 51,778.
The message from the market was clear: risk appetite improved, and technology once again attracted significant attention.
But the most interesting part was not simply the index performance. It was the breadth of the AI rebound.
Tempus AI jumped 14.85% to around $80.36
TEM-3.12%
SMCI-3.03%
ALAB+3.45%
ARM+4.07%
AMBA-1.00%
In the next few months, some #Tickers could hit 100x 💥🚀
ALTSEASON
post-image
IN+6.07%
Nobody is talking about the quiet move forming in PEPE right now.

$PEPE /USDT - SHORT

Trade Plan:
Entry: 0 – 0
SL: 0
TP1: 0
TP2: 0
TP3: 0

Why this setup?
Why now? The 1D trend is range, which often compresses before a sharp break, and the 1h ATR at 0 signals the volatility is thin enough for a fast move. The 15m RSI at 44.12 shows sellers are still in control without being overextended, meaning momentum can keep pushing down. The entry zone around 0 gives a precise level to initiate a SHORT with a defined reference. TP1 and TP2 both sit at 0, confirming the target structure is already vi
PEPE+6.28%
South Korean stocks rebound strongly! KOSPI opens up 2.54, with SK Hynix and Samsung leading the gai
live-cover
LIVE39
#交易機器人 I’m using Gate’s ETHUSDT futures grid bot—come copy-trade with me.
post-image
Load More

Join 40 M users in our growing community

⚡️ Join 40 M users in the crypto craze discussion

💬 Engage with your favorite top creators

👍 See what interests you

Trending Topics

JapanRealEstatePowerChipStocksRise

58.78k Views3.67k Discussing

Japan's Nikkei extended gains on Sept 18, with real estate, power, and semiconductor sectors leading. Gate covers over 12,800 global stocks and ETFs, offering one-stop USDT trading across US, HK, Korean, and Japanese markets. [👉 Read more](https://www.odaily.news/en/newsflash/518749)

USAIConceptStocksRally

33.59k Views572 Discussing

GateTopsStockPerpetualCoverage

37.71k Views2.34k Discussing

View More