Share your thoughts
placeholder
Article
The $25,690 whale buy order was made into big news: MET surged to 0.2563 before pulling back
Good grief, a $25,690 whale buy order somehow became $MET big news—the price action front-ran the move to 0.2563 before pulling back to 0.2412. The direction is clear first: I’m bullish and treating this as a shakeout.
The whale only bought $25,690 worth of MET, which is nothing compared with 4,773,735 USDT in 24-hour trading volume—not even a fraction.
The money in the market is real, though—up 8.259% over 24 hours, with volume 2.525 times the 30-day average, RSI at 59.9 and not overbought, and the M
MET+11.52%
#Web3SecurityGuide 🔐 Web3 Security Guide
Web3 gives users direct control over their assets, but that also means security mistakes can be irreversible. Here are the most important rules:
1. Never share your seed phrase or private key — not with support, friends, websites, or anyone claiming to help. Whoever has it can control your wallet.
2. Verify every website URL before connecting your wallet. Fake domains and phishing pages are common Web3 attack methods. Bookmark official websites instead of relying on random links or search ads.
3. Read every transaction before signing. Don't blindly a
post-image
Insiders know the 1h ATR is compressing before a move that breaks SYMBOL range

$DOGE /USDT - SHORT

Trade Plan:
Entry: 0.08462 – 0.08482
SL: 0.08565
TP1: 0.08402
TP2: 0.08356
TP3: 0.08286

Why this setup?
Why now? The 1h price sits at 0.08472 inside a tight entry zone between 0.08462 and 0.08482, while the 15m RSI reads 50.35 signaling balanced exhaustion. The 1h ATR of 0.000388 confirms volatility is folding, which often precedes explosive directional breaks in range-bound daily trends. Targets sit at 0.08402 and 0.08356, offering clean risk-to-reward if momentum continues. The daily tren
DOGE+0.42%
#每周来晒 #8月CPI数据出炉
The latest consumer price release marks a critical threshold for monetary policy direction. While headline figure shows stability on a yearly horizon, upward momentum on a monthly horizon signals persistence of price rigidity. This picture requires review within an academic lens.
Assessment of Monetary Policy Outlook
For a central bank, core priority remains to strike a balance between price stability and growth. Current release reveals that disinflation process does not follow a linear path. Stickiness in service items and lasting effect led by shelter cost supports a cautio
BTC-0.02%
ETH+0.30%
SOL-0.01%
龙虾+37.11%
MARSCOIN+2.58%
  • 2
#ZECPlungesOver13%
Zcash (ZEC) is facing a sharp sell-off, with the cryptocurrency plunging more than 13% in a significant move that has drawn attention across the crypto market. A decline of this size in a major privacy-focused cryptocurrency can quickly change market sentiment, especially when traders are already dealing with high volatility and uncertainty.
The latest drop highlights just how quickly momentum can shift in the digital-asset market. ZEC has historically experienced large price swings, and a move of more than 13% in a relatively short period can trigger increased trading acti
post-image
ZEC+0.57%
BTC-0.02%
#ZECPlungesOver13% 📉 ZEC Plunges Over 13% — Volatility Returns to Focus
Zcash (ZEC) has come under significant selling pressure, with the asset dropping more than 13% and drawing renewed attention from traders across the crypto market.
A move of this size highlights how quickly sentiment can shift in digital assets. When selling accelerates, traders often reassess momentum, liquidity, support levels, and the broader market environment before making their next move.
The decline also comes as a reminder that price action alone does not explain the full market picture. ZEC, like other cryptocurr
ZEC+0.57%
WHAT IF THE NEXT GENERATION OF BLOCKCHAIN COMBINES THE BEST IDEAS OF BITCOIN, ETHEREUM & SOLANA? 👀⚡
Create a cinematic futuristic crypto poster featuring Kaspa $KAS ‌ as the central character and technology.
On the left, represent Bitcoin with Proof-of-Work, security, decentralization and digital scarcity.
In the center, represent Ethereum with smart contracts, decentralized applications and programmable blockchain technology.
On the right, represent Solana with high-speed transactions, scalability and a high-performance ecosystem.
Connect all three streams of technology toward a massive glo
KAS-2.88%
#8月CPI数据出炉
CPI Changed the Fed Debate — But PPI Made the Picture More Complicated
August U.S. CPI has given the market an important signal, but in my opinion the real opportunity is understanding the complete macro chain rather than looking at one inflation number alone. August CPI increased 0.4% month over month and 3.4% year over year, while core CPI rose 0.3% monthly and 2.4% annually. At the same time, August PPI increased 0.4% monthly and accelerated to 5.4% year over year from 4.8%. This combination explains why traders are seeing higher volatility across Bitcoin, Ethereum, gold, U.S.
CryptoMishu
#8月CPI数据出炉
CPI Changed the Fed Debate — But PPI Made the Picture More Complicated
August U.S. CPI has given the market an important signal, but in my opinion the real opportunity is understanding the complete macro chain rather than looking at one inflation number alone. August CPI increased 0.4% month over month and 3.4% year over year, while core CPI rose 0.3% monthly and 2.4% annually. At the same time, August PPI increased 0.4% monthly and accelerated to 5.4% year over year from 4.8%. This combination explains why traders are seeing higher volatility across Bitcoin, Ethereum, gold, U.S. stocks and the wider crypto market.
The important point is that inflation has not disappeared. Headline CPI remains at 3.4%, above the Federal Reserve's 2% objective, while producer inflation is much hotter at 5.4%. Energy prices have also become an important variable because higher oil prices can eventually increase transportation, production and consumer costs.
1. Will August CPI Change Expectations for the Federal Reserve?
My answer is yes, but not in a simple one-directional way.
The 0.4% monthly CPI increase was broadly in line with expectations, so the report was not an inflation shock. However, it confirmed that price pressures remain sticky. Core CPI at 2.4% annually is closer to the Fed's objective, but still above 2%.
The bigger complication is PPI. Producer prices increased 0.4% in August and 5.4% year over year, accelerating from 4.8%. This means businesses are still facing significant price pressure, and some of those costs can eventually move through the economy.
After PPI, expectations for a September 25-basis-point Fed rate increase moved sharply higher, with some market measures later putting the probability in the roughly 80%–90% area. These probabilities can change quickly with new economic data, but the message is clear: traders are no longer treating inflation as a completely solved problem.
My view is that the Fed is facing a difficult balance. Cutting rates aggressively while inflation remains elevated could create renewed price pressure, while keeping policy restrictive for too long could weaken economic growth and employment.
For traders, this means every upcoming CPI, PPI, jobs, wage and energy-price release can create another volatility wave.
2. What Does This Mean for Crypto and U.S. Stocks?
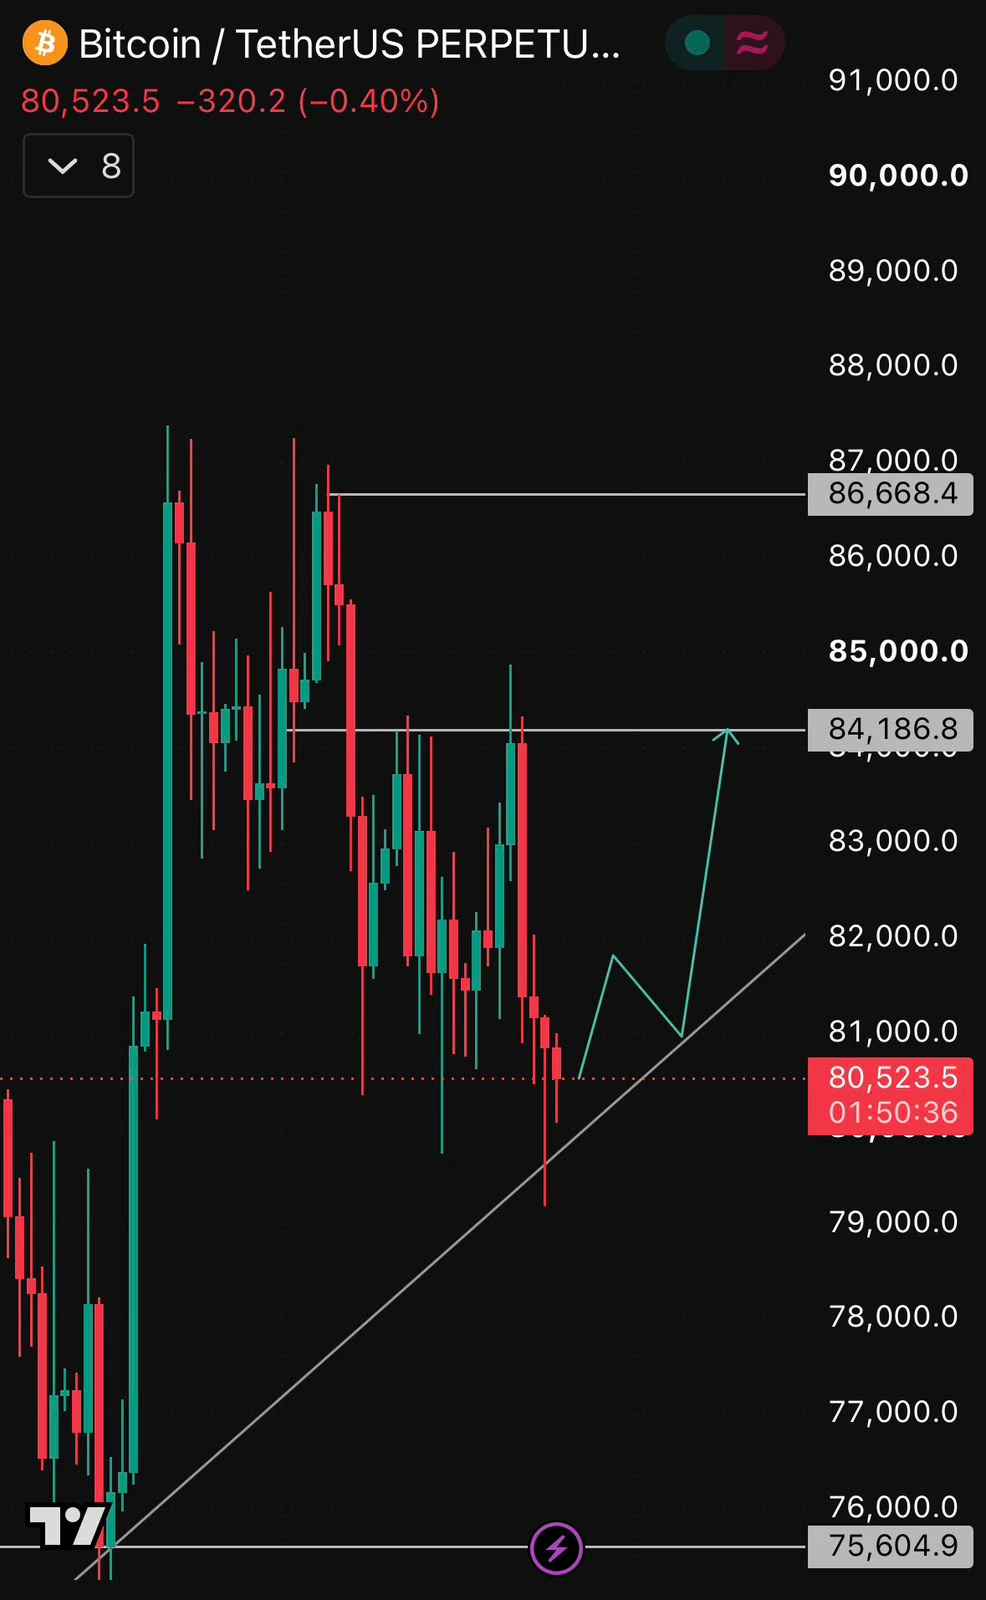
Bitcoin recently traded around $77,000–$77,300. During the September 11 session, BTC moved approximately between $76,559 and $79,818, creating a high-to-low range of about 4.3%. That is significant volatility for a major asset and shows how sensitive BTC has become to macroeconomic headlines.
For me, $80,000 remains the key psychological resistance.
From $77,000:
$80,000 = approximately +3.9%
$82,000 = approximately +6.5%
$85,000 = approximately +10.4%
On the downside:
$76,000 = approximately -1.3%
$74,000 = approximately -3.9%
$70,000 = approximately -9.1%
I therefore would not call BTC strongly bullish simply because it bounced. I want confirmation through price, spot volume and liquidity.
Recent reporting also showed strong Bitcoin ETF demand, including roughly $1 billion of net inflows across a short period. That is important because institutional liquidity can support price even while macro uncertainty remains high.
If BTC holds $76K–$77K while ETF inflows remain healthy, I would view the structure more positively. If BTC breaks $80K with strong spot volume, the next areas I would watch are $82K, $83K and $85K.
Ethereum
Ethereum remains more sensitive to risk appetite and broader crypto liquidity.
My key ETH range is approximately $2,400–$2,530.
Above $2,530:
$2,600 = approximately +2.8%
$2,700 = approximately +6.7%
$2,800 = approximately +10.7%
Below $2,400:
$2,300 = approximately -4.2%
$2,200 = approximately -8.3%
My strategy would be to wait for confirmation instead of trying to predict the exact bottom. If BTC breaks $80K with strong volume and ETH simultaneously reclaims $2,530, capital rotation into major altcoins could become stronger.
If BTC loses $76K, however, I would become more defensive with ETH and smaller-cap assets.
U.S. Stocks: CPI Did Not Destroy the Rally
The U.S. stock market showed resilience after the inflation data.
On September 11, the Dow gained around 1.0% to approximately 52,573, the S&P 500 gained about 0.9% to around 7,657, and the Nasdaq gained roughly 1.0% to approximately 26,333.
However, the weekly picture was more mixed. The S&P 500 remained down around 0.8% for the week, the Dow around 1.6%, while the Nasdaq was down roughly 0.7%.
This tells me investors are balancing inflation against earnings, oil prices, economic growth and liquidity rather than reacting to CPI alone.
Treasury yields are particularly important. The 10-year yield recently approached 5%, while the 2-year yield was around 4.6%. If the 10-year yield breaks decisively above 5% and stays there, expensive growth and technology stocks could face additional valuation pressure.
On the other hand, if yields retreat while inflation expectations stabilize, technology and growth stocks could recover quickly.
That is why I would watch Treasury yields almost as closely as CPI.
Gold: Inflation Hedge vs Higher-Rate Pressure
Gold is also caught between two powerful forces.
Spot gold recently traded around $4,350–$4,400 per ounce. Gold recovered around 0.8% during one recent session after suffering a sharp decline, but it remains highly sensitive to movements in the dollar and Treasury yields.
Inflation, geopolitical uncertainty and safe-haven demand can push gold higher.
Higher Treasury yields and expectations for tighter Fed policy can push gold lower because gold does not provide interest income.
For me, $4,300–$4,400 is therefore an important observation zone.
A sustained breakout above $4,400 would strengthen the bullish structure.
A rejection around $4,400 followed by a move below $4,300 would signal caution.
3. Where Are the Biggest Trading Opportunities?
I see opportunities in volatility rather than blindly choosing one direction.
Bullish Scenario
If BTC holds $76K–$77K, ETF liquidity remains positive, Treasury yields stabilize and BTC reclaims $80K with strong volume, the next areas I would monitor are $82K, $83K and $85K.
A move from $77K to $85K would represent approximately 10.4%.
For ETH, a confirmed break above $2,530 could put $2,600, $2,700 and potentially $2,800 on the radar.
For U.S. stocks, declining Treasury yields would be particularly supportive for technology and growth sectors.
For gold, sustained strength above $4,400 could improve the bullish setup.
Bearish Scenario
If PPI remains elevated, oil stays above $100, Treasury yields break above 5% and the Fed communicates a more restrictive policy path, risk assets could experience another correction.
BTC below $76K could expose $74K.
Below $74K, the $70K psychological area becomes important.
A decline from $77K to $70K would be approximately 9.1%.
ETH below $2,400 could expose $2,300 and $2,200.
Growth stocks could also experience valuation pressure if the 10-year yield remains around or above 5%.
Gold could remain volatile because inflation supports demand while higher yields create resistance.
My Trading Plan
My strategy in this environment is confirmation first, position size second and prediction last.
For BTC:
Above $80K with strong volume = bullish confirmation.
$76K–$80K = high-volatility range; reduce position size and wait.
Below $76K = defensive setup; monitor $74K and $70K.
For ETH:
Above $2,530 = stronger bullish confirmation.
$2,400–$2,530 = waiting/range zone.
Below $2,400 = risk increases.
For U.S. stocks, I would closely watch the 10-year Treasury yield. Falling yields with stable index support would improve the setup for growth stocks, while a sustained move above 5% would make me more selective.
For gold:
$4,400 breakout = stronger bullish signal.
$4,300 breakdown = caution.
Liquidity and Volume Are More Important Than a Single Candle
One of my biggest lessons from this market is that price alone is not enough.
A 3% BTC move with weak volume can be completely different from a 3% move supported by strong spot buying.
I want to see increasing spot volume during a breakout, healthy ETF flows, stable funding conditions and strong liquidity around resistance.
Traders should monitor:
Spot volume
Futures open interest
ETF inflows and outflows
Funding rates
Liquidations
Stablecoin liquidity
Treasury yields
DXY direction
Oil prices
These indicators together provide a much clearer picture than one green or red candle.
The crypto market can also become thin during uncertain periods, meaning relatively modest buying or selling can create surprisingly large percentage moves. This is why liquidity conditions should always be considered when evaluating volatility.
Risk Management Is the Real Strategy
My strongest advice is simple: CPI and PPI days are not ordinary trading days.
When volatility expands, leverage can turn a normal 2%–4% market move into a major account drawdown.
I would rather miss the first part of a breakout than chase a candle after a sudden 5% move.
My preferred process is:
Wait for the initial data reaction.
Mark the high and low created after the release.
Watch volume.
Wait for a confirmed breakout or breakdown.
Define invalidation before entering.
Reduce position size when volatility expands.
Avoid excessive leverage.
Take partial profits at planned levels instead of waiting for a perfect top.
Most importantly, TP1, TP2 and TP3 are planning zones, not guaranteed outcomes.
Final Market Outlook
My overall view is cautiously constructive but highly data-dependent.
August CPI at 3.4% year over year and 0.4% month over month did not produce an inflation surprise, but it confirmed that inflation remains above the Fed's 2% objective. Core CPI at 2.4% is improving, yet the 5.4% annual PPI reading makes the inflation picture more complicated.
Oil is another major variable. Brent recently moved above $100 and briefly approached $110 before pulling back, keeping inflation expectations sensitive to energy prices.
This explains the current volatility.
BTC is fighting around $77K–$80K.
ETH is fighting around $2.4K–$2.53K.
Gold is fighting around $4.3K–$4.4K.
The S&P 500 is around 7,657.
The Nasdaq is around 26,333.
The Dow is around 52,573.
The 10-year Treasury yield is close to 5%.
Brent crude remains above $100.
This is not a market where I would blindly chase price. It is a market where I would watch liquidity, volume, yields and confirmation.
My most important market chain remains:
CPI → PPI → Oil → Treasury Yields → Fed Policy → Dollar → Liquidity → U.S. Stocks → Bitcoin → Ethereum → Altcoins.
If inflation stabilizes and yields fall, risk assets could receive another liquidity boost.
If inflation remains sticky and yields stay near 5%, volatility can remain elevated.
For me, BTC above $80K with strong volume is the confirmation I want before becoming more aggressive. Below $76K, I would shift toward capital protection. For ETH, $2,530 is the key confirmation level. For gold, $4,400 is the important upside area while $4,300 is the key downside zone.
The biggest opportunity may not be predicting the next candle. It may be preparing for both directions and allowing price, volume and liquidity to tell us which scenario is actually developing.#weeklyshare #ShareWeekly
repost-content-media
  • 2
#SenateReleasesNewCLARITYAct Senate has released a new version of the CLARITY Act, marking another important step in the debate over a clearer regulatory framework for digital assets in the United States.
For the crypto industry, regulatory clarity can be a major catalyst. Clearer rules could help define how digital assets are classified, reduce uncertainty for market participants, and create a more predictable environment for exchanges, builders, investors, and institutions.
The key focus now is how the Senate version develops through the legislative process and what changes may come before
Happy weekend, everyone.
To those who follow me, have you ever paid attention to the updates I post?!
A topic I have been talking about throughout August: short ETH at 2530–2535. Add one position at 2560–2565. Stop-loss at 2580.
You can look back through my updates. Some friends also know that I trade long term. Coming back to the point, have I placed trades according to my own trading plan?!
Short-term trading is faster, but the risks are greater, and it requires better discipline and more accurate technical analysis for support.
To put it bluntly, most people are gambling, betting on their o
You have 24 hours
Drop your $SOL address
Like & RT
Must Join TG:
post-image
SOL-0.01%
The value correction tool now supports iPhone Duo conversion. Feel free to use it.
:
post-image
Register to Claim 50 XRP, Trade to Earn Another 100 XRP https://www.gate.com/campaigns/6246?ch=7360&ref=VLIVVF0OCA&ref_type=132
post-image
XRP+0.01%
This profit has me feeling uneasy, worried the market will catch on tomorrow and blacklist me. With the screen glowing green, $PIPPIN was holding on stubbornly there, with a classic strong bull-trap vibe—the resistance above was obvious, and that afternoon surge pulled back without even touching the previous high. I flagged a short entry around 0.01950, targeting exactly this move.

When I checked the chart just after lunch, nothing much had happened yet, but right after 2 p.m., it went limp. Current price: 0.01768, unrealized profit +183.77%—feels damn good. During the intraday plunge, seve
post-image
PIPPIN-1.83%
XRP+0.03%
SNDK-0.49%
Don’t just watch others win! Still haven’t claimed your guaranteed-win reward? 🎁
Only 1️⃣ day left in the countdown to the 22nd Growth Points Lottery! Take home 5,000 USDT, Gate football jerseys, and more!
Draw now 👉 https://www.gate.com/activities/pointprize?now_period=22
Three steps to secure great prizes:
✅ Complete daily social tasks in Square, Livestreams, and Hot Chats
✅ Tap 【+】-【Activity Center】-【Community Lottery】 on the post creation page
✅ Leave the rest to luck—new and existing users alike are guaranteed to win!
📢 Comment section roll call: Share a screenshot of your win! Let’s
post-image
BTC-0.02%
ETH+0.30%
AAPL+1.71%
  • 12
  • 10
I checked the @protocol_fx official website this morning.
Stats now shows that fxUSD supply has reached $83.36 million, reserve assets stand at $115.7 million, and protocol TVL is $211.8 million. Three days ago, the official figure was still 80M, and it has climbed significantly since then.
I also checked fxSAVE: $77.75 million currently, with an APY of 6.86%; trading offers up to 7x leverage, the fee is 0.3%, and the funding rate shown on the page is 0.0039%. The protocol also holds 6,652.72 stETH and 1,284.11 WBTC.
There is a lot of data, but what stands out most is that supply is stil
post-image
STETH+0.36%
WBTC-0.14%
Everyone is missing the SHORT setup forming on $ADA /USDT right now.

$ADA /USDT - SHORT

Trade Plan:
Entry: 0.2061 – 0.2069
SL: 0.2100
TP1: 0.2039
TP2: 0.2021
TP3: 0.1994

Why this setup?
Why now? The daily trend is range-bound, which often precedes explosive directional moves, and the 1h price is sitting at 0.2066 with a 15m RSI of 36.59, signaling weakening momentum before a drop. The 1h ATR of 0.001469 confirms enough volatility to reach the entry zone at 0.2065, where a short can be placed with the invalidation level at 0.2135 acting as the hard line in the sand. The first target sits
post-image
ADA-0.53%
$LTC this time I’m taking a bullish-on-the-pullback approach. After the earlier breakout, I didn’t chase directly and waited until it pulled back near the key level before entering long. The price action hasn’t been particularly fast since entry, but it has continued to hold the key level, with buying support still present in the long-short battle.

After reaching +431.83%, I first closed 70% of the position. Taking some profit off the table makes me feel more secure, while I’ll continue watching how the remaining position performs around the key level. No conclusion can be drawn about 53.56
post-image
LTC+0.30%
SOL+0.01%
LAB-10.84%
Load More

Join 40 M users in our growing community

⚡️ Join 40 M users in the crypto craze discussion

💬 Engage with your favorite top creators

👍 See what interests you