




Square
Following
Hot
News
Notifications
Profile
Share your thoughts
placeholder
Article
#eth If the 22:00 hourly chart rebounds to 1890 and holds, this will be the bottom.
ETH-1.26%
See? We've hit bottom!
There is no endless darkness!
Dawn is breaking!
Get on board $UNI
post-image
UNI+3.13%
Trenches
mihao
m
bade
b
mihao
4Cxj...pump
Market Cap
$.
Change
.
24h Vol
$.
Holders
.
IDOL
I
bade
b
IDOL
0x3b...ab07
Market Cap
$.
Change
.
24h Vol
$.
Holders
.
FOOD
F
bade
b
FOOD
FTu5...pump
Market Cap
$.
Change
.
24h Vol
$.
Holders
.
AGT
A
bade
b
AGT
0x5d...e274
Market Cap
$.
Change
.
24h Vol
$.
Holders
.
NIO
N
bade
b
NIO
7SL2...pump
Market Cap
$.
Change
.
24h Vol
$.
Holders
.
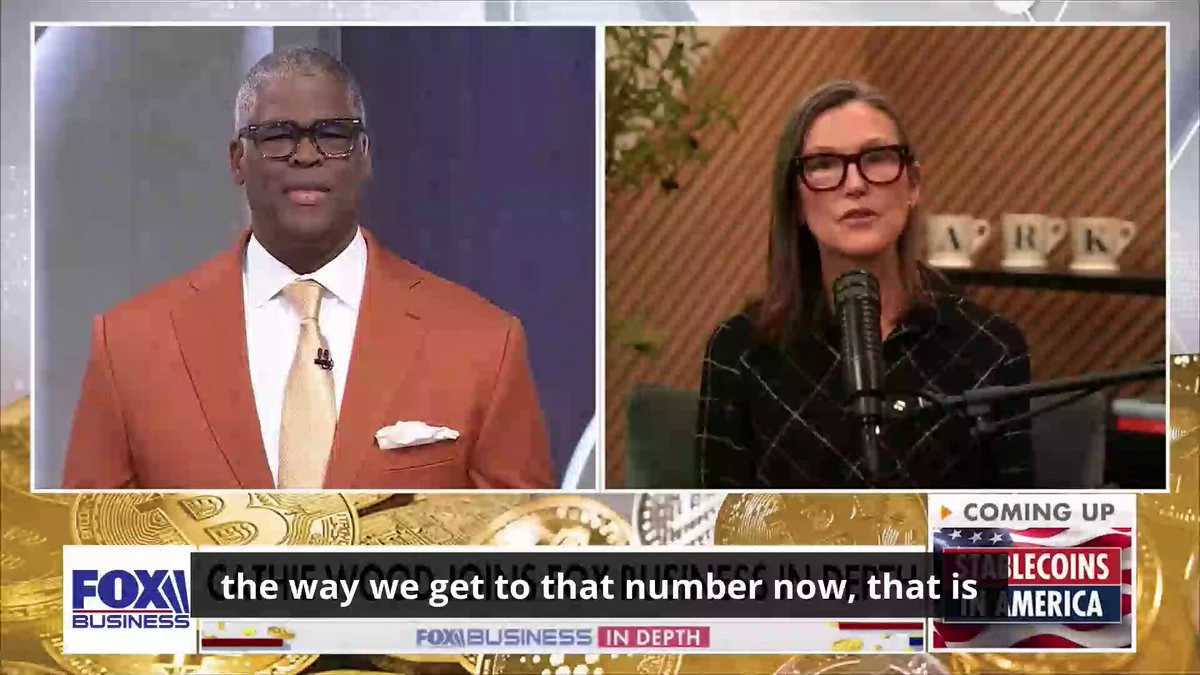
Bitcoin & Altcoins Crash! Bank Adoption of Crypto Surges & AI Agent Crypto Expansion!
WATCH ▶️
In this Crypto Water Cooler episode, Tony and Amanda discuss the latest volatility across the crypto and stock markets, Goldman Sachs and other major banks joining forces to launch a stablecoin, Deutsche Bank’s entry into crypto custody services, and the latest developments in AI agents and crypto from Coinbase and other leading companies.
#crypto #bitcoin #banks
post-image
BTC-0.67%
GS+0.31%
COIN-2.29%
@PeterSchiff predicts BTC could crash to $16.5K if $50K breaks.
Meanwhile, Bitcoin is still at $67K.
He's been calling for BTC's downfall since $1.
BTC-0.67%
$ARIA This 28-point surge gives me chills. This morning’s sharp dump to 0.1664 was the market maker sweeping stop-losses; retail capitulation sells were all absorbed, then the price was bulldozed up to 0.2293, with 24h trading volume hitting 75M—that kind of volume isn’t something retail traders can generate. The order book shows thin sell orders above 0.22, and the market maker has a high degree of control. If the pullback to 0.20–0.205 holds, that’s a second entry point. Set your stop loss at 0.185 and your first take-profit at 0.24; keep your position under 20%. Those of you who chased the
ARIA+22.03%
  • 2
A hundred ships lined up—that’s a large-scale exercise, no doubt. Public reports on these drills around Taiwan often cite more than a hundred ships and dozens of fighter sorties, covering the airspace and waters around Taiwan and near its outlying islands. The timing also tends to coincide with political flashpoints. But historians have a habit of looking at events like these in two ways: the actions and the rhythm. The actions are visible: ships leaving port, aircraft taking off, missile test launches, and Coast Guard patrols. The rhythm is less visible: when the pressure is ramped up, by how
post-image
  • 2
Today market update and trade with dragon fly official
live-cover
LIVE1,602
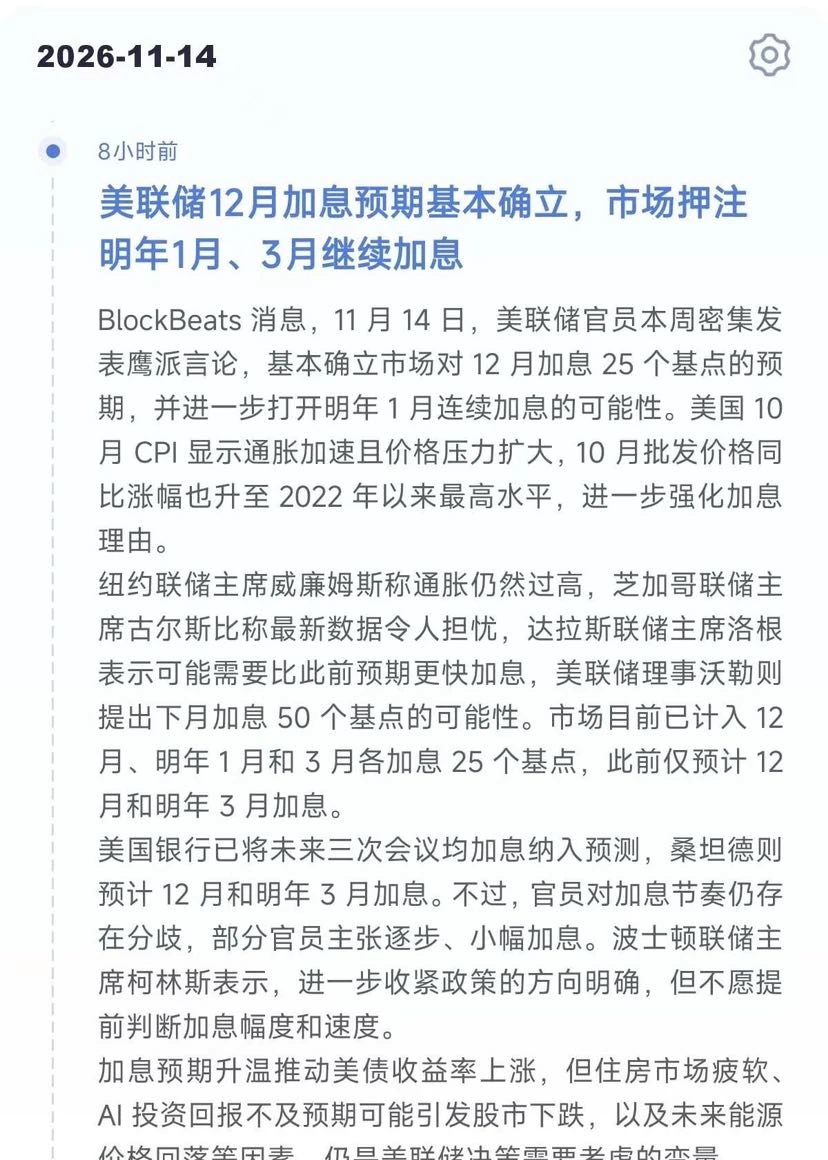
Rate hike in December 2026
Rate hike in January 2027
Rate hike in March 2027
Three rate hikes in six months?
This would be a total disaster.
Who can withstand this super-slow-boiling-frog approach?
In the end, they can all be cooked through one by one, killed, and eaten.#美联储
post-image
btc
live-cover
LIVE1,816
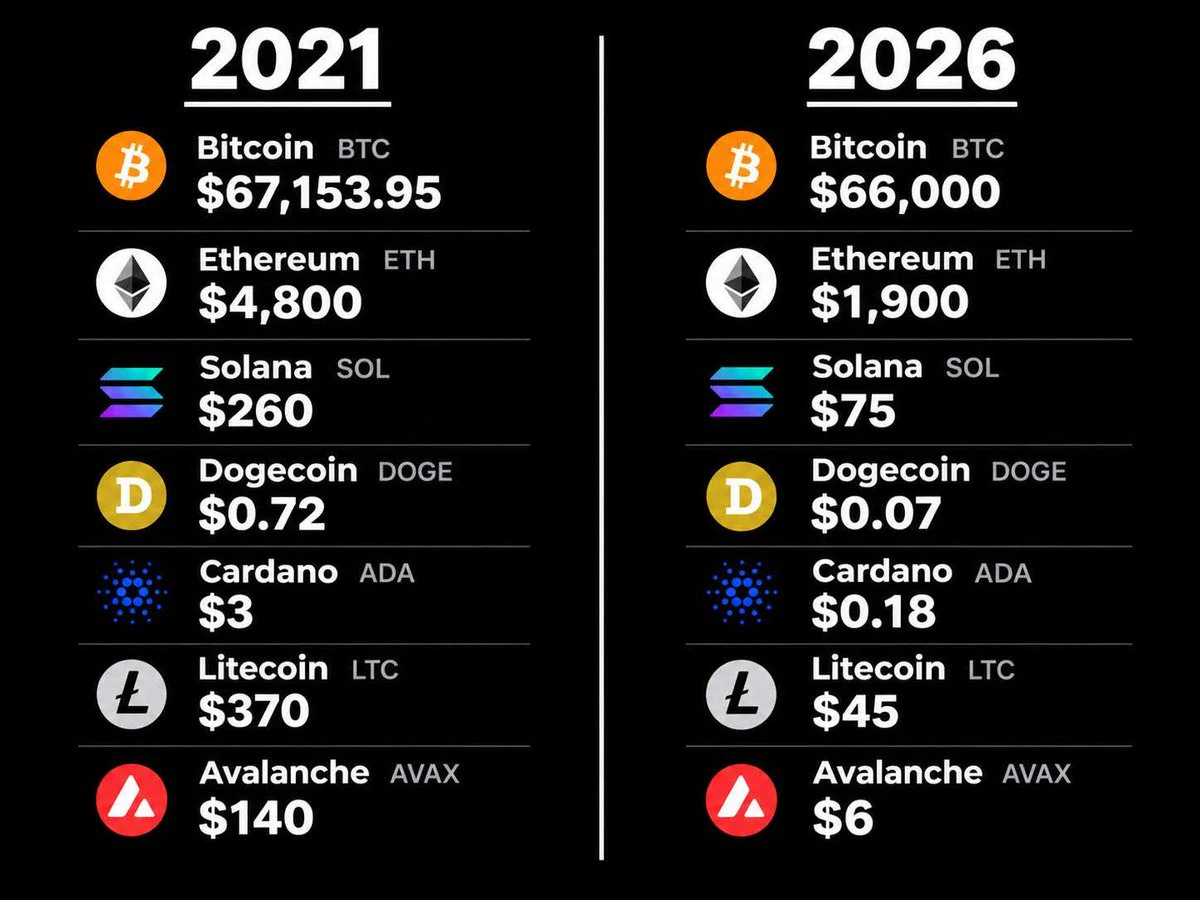
Bitcoin is still Bitcoin, but altcoins are already done for...
post-image
BTC-0.67%
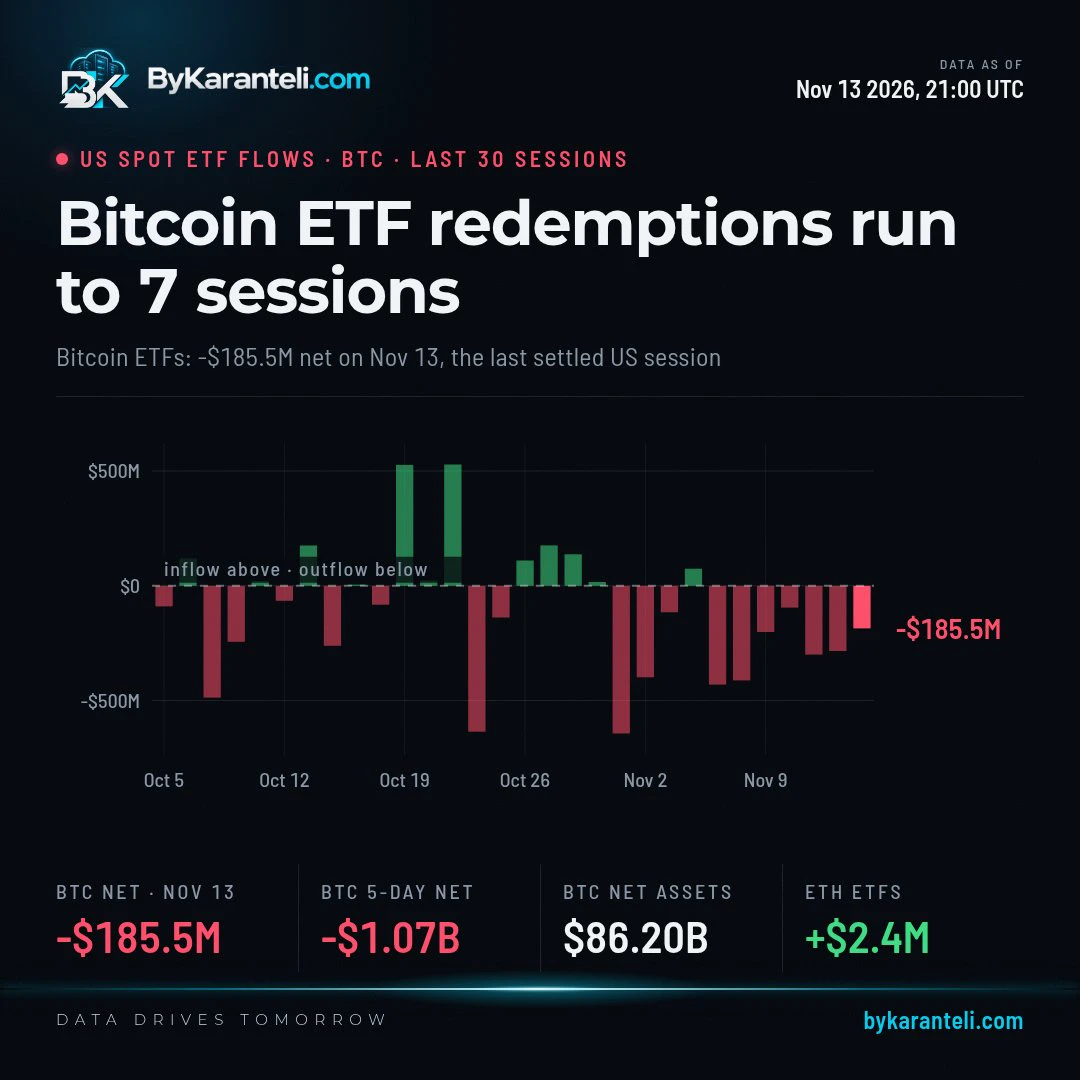
Seven sessions running, more money has left US spot $BTC ETFs than entered, and Nov 13 brought another -$185.5M net. $IBIT accounted for -$143.5M of it. $ETH funds went the other way, taking in $2.4M.
post-image
BTC-3.45%
ETH-3.30%
Recent market action be like: 👇👇
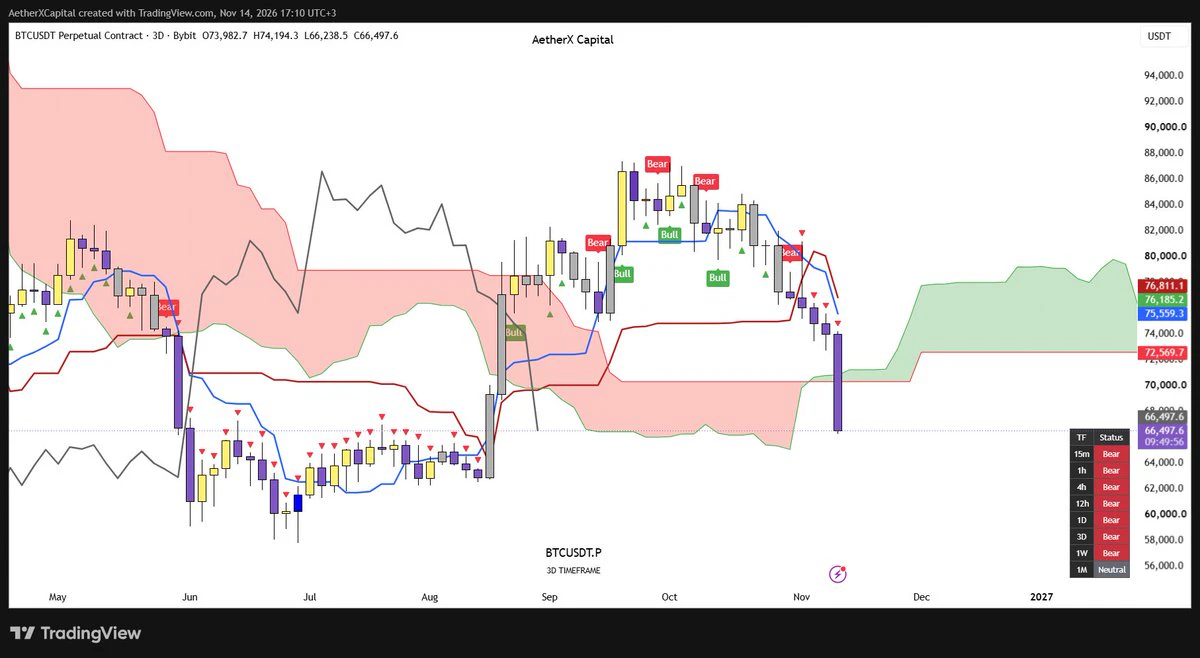
If the 3D candle closes below the Kumo cloud and Bitcoin finds acceptance below it, then the probability of lower prices increases significantly.
The OBV Trend readings are mostly bearish 🔴
Caution is advised ⚠️
$BTC 3D
post-image
BTC-0.67%
#ETH
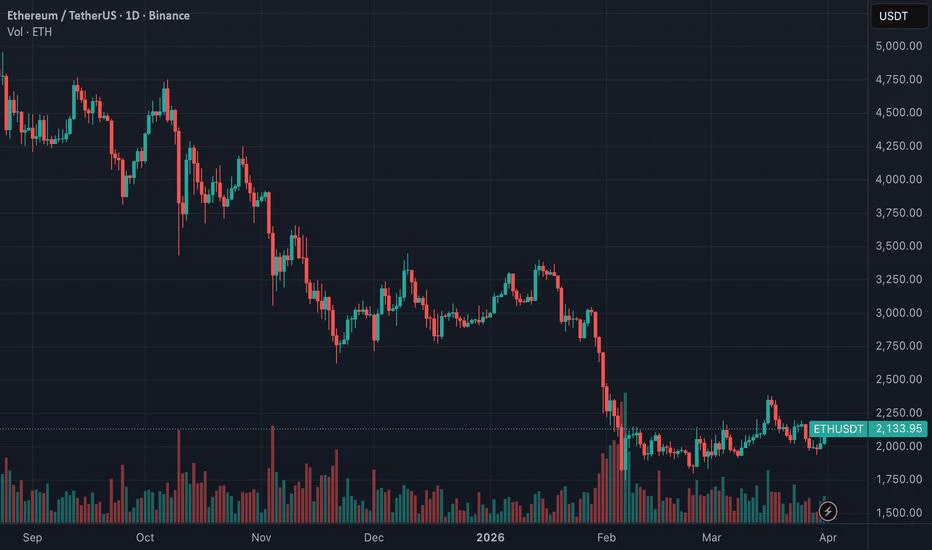
Ethereum Under Pressure: $1,900 Becomes the Line Between Stabilization and Another Breakdown

Ethereum is facing a critical market test as its price falls below $2,000, weakening the short-term structure and putting the $1,900 support region under pressure. The decline is no longer an isolated ETH correction. It is part of a broader risk-off move across digital assets, where declining liquidity, institutional outflows, macroeconomic uncertainty and leveraged liquidations are combining to increase selling pressure.

Market Snapshot: Sellers Still Have the Advantage

At the latest availabl
post-image
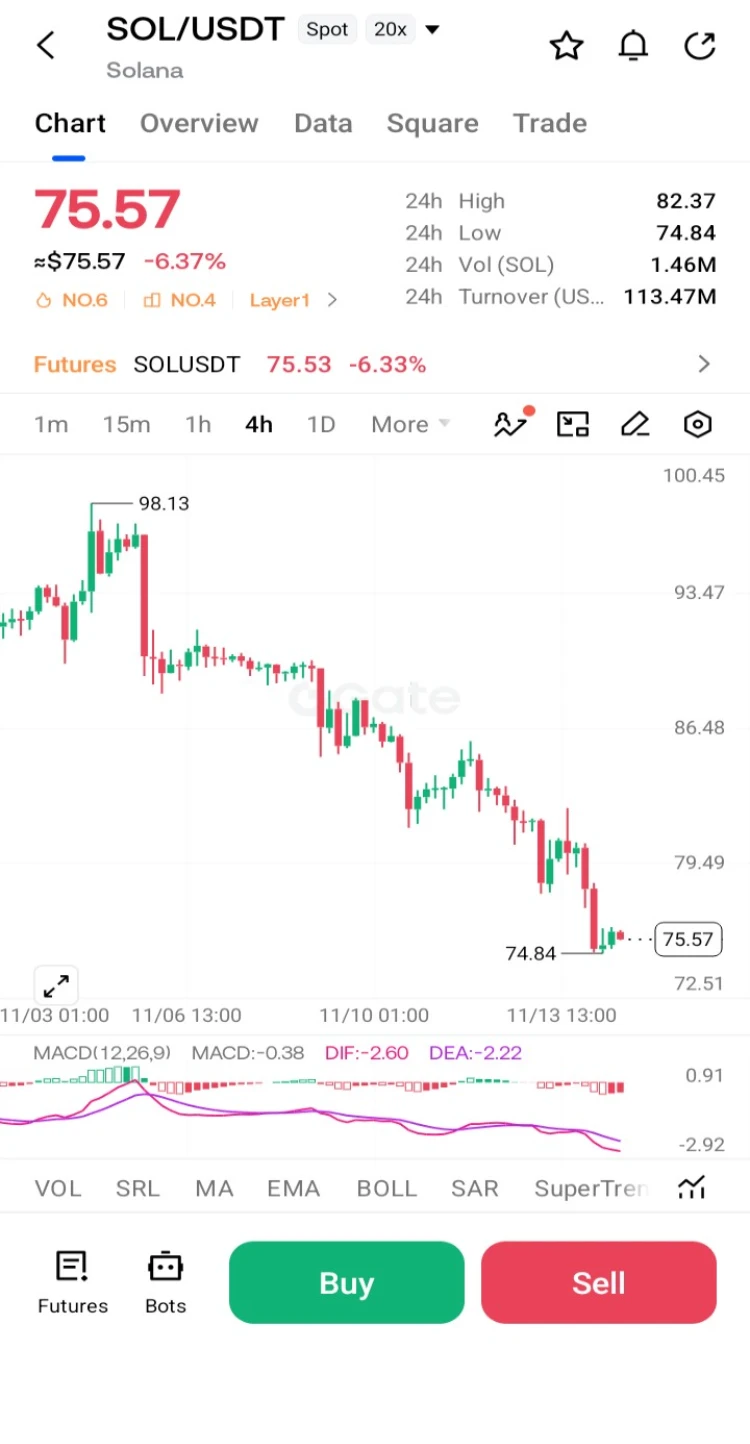
$SOL /USDT Daily Technical Analysis: Price Breaks Below $80 as Sellers Take Full Control

Solana has fallen below the $80 level and is trading near $80.25 to $80.31 on the daily chart, after losing several important support zones in a short period. Selling pressure has intensified, and the structure now favors the bears across every major moving average. The central question for traders is whether buyers can defend the $79 to $78 region, or whether SOL will extend its correction toward $74 to $73.

**Market Overview**

SOL is trading below all four major exponential moving averages on the dail
post-image
SOL-0.74%
  • 1
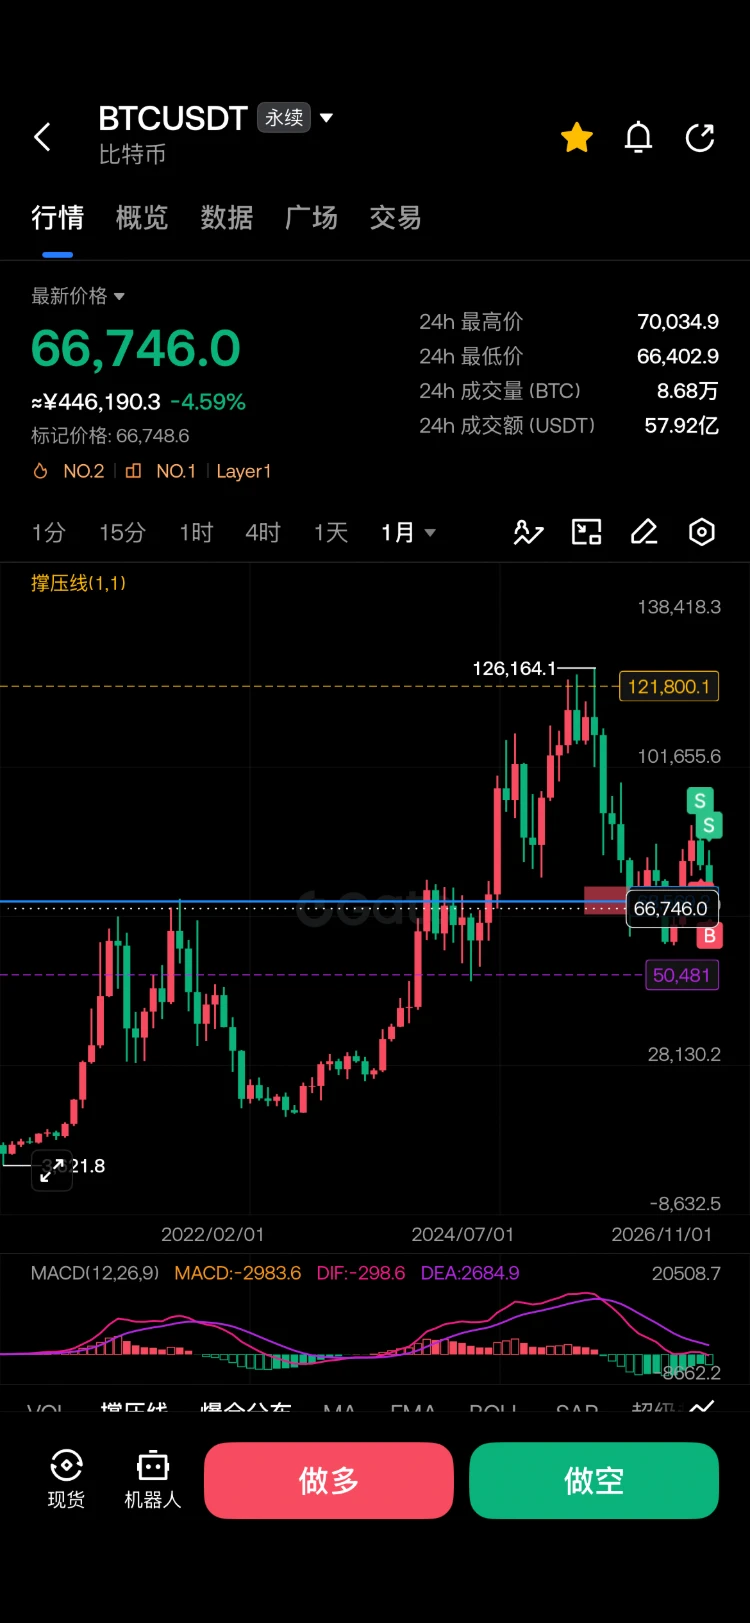
#比特币跌破7万美元 The near-term outlook currently leans toward further downside. $70,000 has already been breached, spot ETF funds are still flowing out, and the rebound looks more like a recovery after an outsized decline than a reversal.

Why prices could still move lower
· Rate hike expectations are weighing on the market: Fed officials have struck a hawkish tone, and the market is concerned about a rate hike in December. When the dollar strengthens, assets like Bitcoin usually fall first.
· ETF outflows continue: U.S. spot Bitcoin ETFs have seen net outflows for six consecutive trading days, tota
post-image
ThisIsTranslateContent:
#比特币跌破7万美元 For now, the short-term outlook points to further downside. $70,000 has been breached, spot ETF funds are still flowing out, and the rebound looks more like a recovery after an excessive drop than a reversal.
Why it could still move lower
· Rate hike expectations are weighing on the market: Fed officials have taken a hawkish tone, and the market is concerned about a rate hike in December. When the dollar strengthens, assets like Bitcoin typically fall first.
· ETFs are seeing outflows: U.S. spot Bitcoin ETFs have recorded net outflows for six consecutive trading days, totaling about $1.722 billion.
· Leverage is being flushed out: After the drop below $70,000, nearby long positions were liquidated en masse. Liquidations over 24 hours totaled about $1.64 billion, nearly 90% of which were longs.
Where is the next support?
· $68,000–$68,200: This is the most immediate reference point at present, and is near this year's June low.
· $66,500–$67,000: The 200-week moving average is around $67,148, a level long-term funds are watching.
· $62,000–$65,000: Further down, long-term holders bought about 476,000 coins in this range this year, making it a deeper support level.
What two things to watch for in a rebound
1. Hold near $68,000 and close with a long lower wick on increased volume.
2. Reclaim $70,000, ideally returning above $72,000. Only if both happen will it count as a consolidation recovery; rising back above $70,000 alone is still just a rebound.#WCTCS9 $BTC ‌

repost-content-media
BTC-0.67%
  • 2
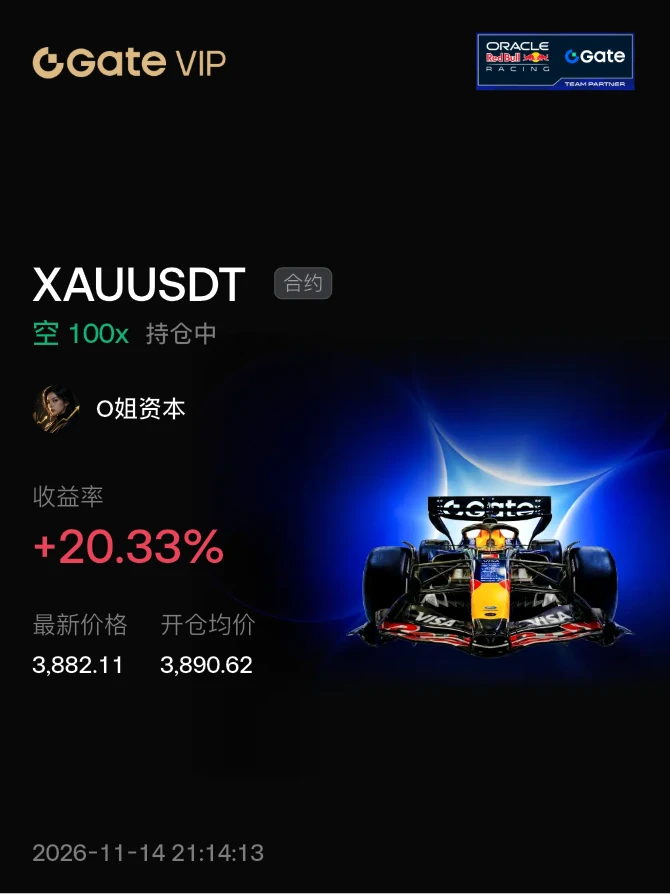
#晒出我的持仓收益 The gold position I opened last night, XAUUSDT, is such a poser—the most pretentious short instrument, a short on the monthly timeframe, acting bullish every day,
post-image
XAU+0.38%
  • 1
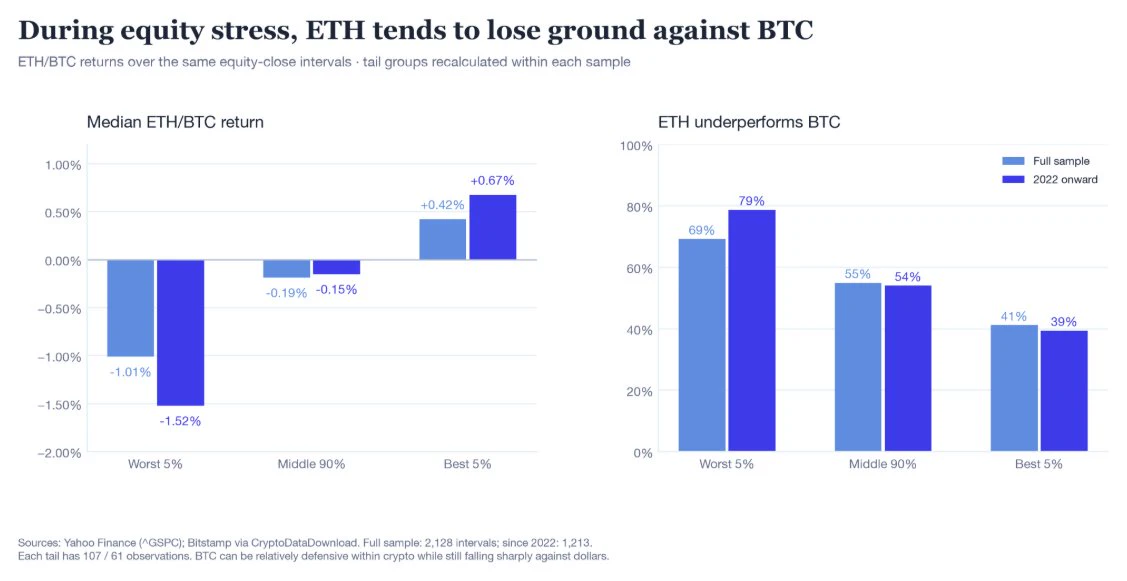
Since 2022, ETH underperformed BTC on 79% of the S&P 500’s worst days, with a median ETH/BTC return of −1.52%.
On the best equity days, ETH outperformed by a median 0.67%.
When stocks sell off, BTC sits at the defensive end of the crypto risk curve.
post-image
ETH-1.26%
BTC-0.67%
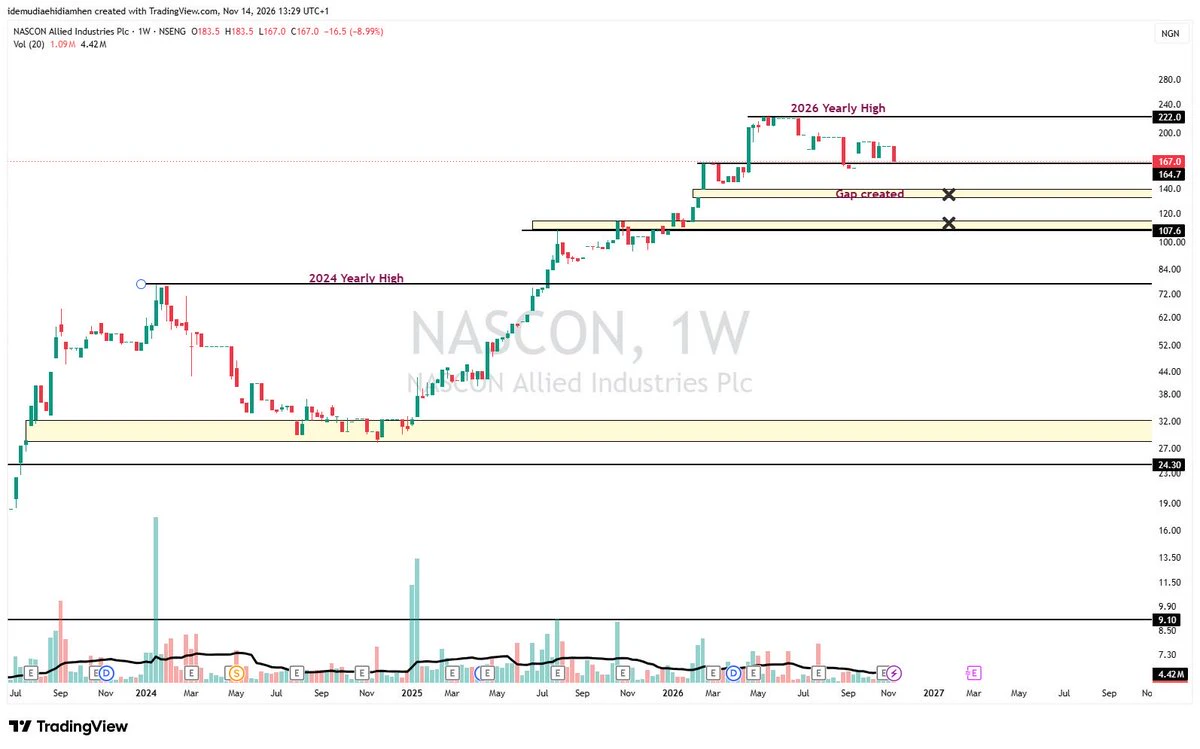
NASCON
The Bulls must not lose the N164.7/share support zone, or I am looking at two regions:
1. The gap closure of N132-N140 per share, which happened in February 2026.
and
2. The demand zone of N108.7-N114.5 per share, which I doubt we might play, but it is the market, and we are open to any form of possibilities
#NFA
post-image
Load More

Join 40 M users in our growing community

⚡️ Join 40 M users in the crypto craze discussion

💬 Engage with your favorite top creators

👍 See what interests you

Trending Topics

GateIPOAccessAnthropic

316.4K Views2.9K Discussing

Gate IPO Access Phase 3 features Anthropic (ANT), with USDT subscription interest starting from 100 USDT. Successful allocations will be delivered as real shares to Gate Stock Accounts. Indicative price: $70–$78/share Subscription: Nov 12–17 (UTC+8) Allocation is not guaranteed. Please manage risk accordingly.

Dr.HanOxfordUnionSpeech

148.2K Views615 Discussing

USOctoberPPIBelowExpectations

465.2K Views1.5K Discussing

View More