


Share your thoughts
placeholder
Article
#Web3SecurityGuide
Depositing and withdrawing funds is the point where most users meet real-world risk controls. The questions that keep coming up are practical: what can go wrong, how people accidentally trigger reviews, and what is the safer way to move capital when the system flags something.
The first layer of risk sits on the banking side. Cards and bank accounts can be frozen when the flow of funds looks unusual to the bank’s monitoring systems. Large or frequent transfers, sudden changes in pattern, or transactions linked to higher-risk categories can all prompt a temporary hold. When
  • 3
Everyone’s long XRP at 1.40—but the 4H just whispered a secret the crowd missed.

$XRP /USDT - SHORT

Trade Plan:
Entry: 1.4019 – 1.4071
SL: 1.4291
TP1: 1.3860
TP2: 1.3737
TP3: 1.3552

Why this setup?
- 1D trend is **range**, not breakout—so chasing 1.40 upside is gambling.
- RSI 15m at 64 shows local heat; ATR 1h (0.0102) signals compression—breakouts fake out.
- Entry ref 1.4045 sits exactly at invalidation 1.4046—this is a knife-edge trap.
- Short targets: TP1 1.3860 (-1.3%), TP2 1.3737 (-2.2%)—reward:risk is 1:2.4 if you respect SL 1.4291.
- **Why now?** Price is rejecting the r
XRP-3.40%
People literally apeping 🦍 into this at $42 million lol
$shroom
0xab093def657f15df31b33922a95e047add645b29
post-image
#XAU Nonfarm Payrolls Night Resonates with a Hawkish Storm: Where Is Spot Gold Headed?
Recently, the spot gold market has been on a “roller coaster.” After plunging from a monthly high of $5,600, it briefly fell to around the $4,000 mark before rebounding above $4,400.
Why has gold fluctuated so violently recently? Against the backdrop of Fed Chair Kevin Warsh’s hawkish speech at the Jackson Hole global central bank conference on August 28 and the latest September nonfarm payrolls data, is gold brewing an even bigger plunge, or is it building a “golden pit”?
I. Macroeconomic Fundamentals: The
XAUUSD-0.95%
#NVIDIAEarnings
NVIDIA’S AI ENGINE KEEPS ACCELERATING: A DEEP DIVE INTO THE LATEST EARNINGS AND WHAT COMES NEXT
NVIDIA’s latest earnings report has delivered another powerful message to the technology and investment world: the AI infrastructure cycle is still expanding at extraordinary speed. But the most important story is no longer simply that NVIDIA is selling more GPUs. The deeper story is that AI compute is becoming a fundamental layer of the global technology economy.
NVIDIA reported fiscal Q2 2027 revenue of $96.2 billion, representing a remarkable 106% year-over-year increase and 18%
NVDA+0.66%
  • 9
Firmly accumulate coins in the early bull market, and never forget our original intention!
Although it is autumn now, it is actually spring in the crypto market. Now is a good season for sowing; just wait for the harvest in winter. $MU
MU+5.89%
#BTCReclaims80K
Bitcoin has reclaimed the 80,000 level for the first time in three days and is up more than 5 percent over the past 24 hours. The move has been supported by cooling rate-hike expectations and a wave of short liquidations. The open question is whether the next leg targets 82,000 or whether the market settles into range-bound consolidation.
On the 4-hour chart price is currently trading near 79,638 after testing 79,727. The 9-period MA sits at 80,061 and the 50-period MA is lower at 78,604. Bollinger Bands stretch from 76,032 on the downside to 82,416 on the upside, with the mid
BTC-1.85%
  • 1
$NVDA #NVIDIA
THE AI LEADER IS HOLDING STRONG
NVIDIA is trading around $230.40, with the latest session showing a high near $234.75 and low around $229.47. Despite the broader market facing pressure after the stronger-than-expected U.S. August jobs report, NVDA remained relatively resilient. That relative strength is important because higher Treasury yields and increased expectations for a September Fed hike can normally weigh heavily on high-growth technology stocks.
FUNDAMENTALS ARE STILL POWERFUL
The latest earnings picture continues to support the long-term bullish thesis. NVIDIA report
NVDA-0.16%
  • 1
Everyone’s long XLM while the 4h quietly flips—are you on the wrong side of 0.18232?

$XLM /USDT - SHORT

Trade Plan:
Entry: 0.18194 – 0.18271
SL: 0.18602
TP1: 0.17955
TP2: 0.17770
TP3: 0.17493

Why this setup?
- 1D trend says *range*, not breakout—so buying tops here is a trap.
- RSI 15m at 63 shows local exhaustion; momentum is stalling right under resistance.
- Price is pinned at 0.18232 with a SHORT bias (conf 55). In a range, the edge is selling the top, not chasing green.
- TP1 at 0.17955 is only a 1.5% drop—low risk for a range fade. Why now? Because the 4h has rejected this zo
XLM-1.37%
Everyone’s staring at the 1D chart, but the real money is hiding in a 4h pocket—HYPE just armed a 95% confidence trap.

$HYPE /USDT - LONG

Trade Plan:
Entry: 84.163 – 84.531
SL: 82.580
TP1: 85.672
TP2: 86.556
TP3: 87.881

Why this setup?
- RSI on 15m is 54.44: not overheated, not dead—this is the “calm before expansion” zone.
- 1D trend is bullish, and we’re coiling above 84.347 with ATR (1h) at 0.736—tight volatility means a breakout is imminent.
- TP1 at 85.672 is a 1.5% scalp, but TP2 at 86.556 is the real magnet if bulls hold 84.163.
- The invalidation at 81.771 is a full 3% belo
HYPE-2.21%
I just casually tapped refresh, and it went up on its own, leaving me in a very passive position. $TAO really delivered this time—I placed my order at 225.0 and barely checked afterward. The last thing I saw before bed was it moving sideways, and now it’s suddenly showing 236.1, with a +237.75% profit. Feels like the market is chasing me down to hand me money.

I noticed it during the repeated intraday swings: every dip was met with buyers, and the key levels were gradually moving higher. If that isn’t a shakeout, what is? I even made a point of saying at the time: the more solid the bottom,
post-image
TAO+2.88%
ETH-2.80%
DOGE-2.02%
South Korea is moving its capital markets infrastructure onchain using Avalanche. The Financial Services Commission and Korea Securities Depository will bring stocks, bonds, and funds onchain, covering issuance, trading, clearing, settlement, and investor rights. This is one of the most ambitious government-led tokenization efforts to date. #avax
$AVAX
post-image
AVAX-0.41%
  • 2
  • 1
Market prediction
live-cover
LIVE1,886
#GateTops7DayNetInflowsGlobally
🚨 Gate Tops 7-Day Net Inflows Globally — A Powerful Vote of Confidence
This is not just another ranking. This is a powerful signal of where user confidence, capital movement and market activity are heading. Gate has climbed to the No.1 position globally in 7-day net inflows, with approximately $96.64 million in cumulative net inflows reported on September 2, 2026. When fresh capital continues to enter an exchange at this scale, it reflects much more than trading activity — it shows that users are actively choosing the platform to deploy, trade and manage their
  • 3
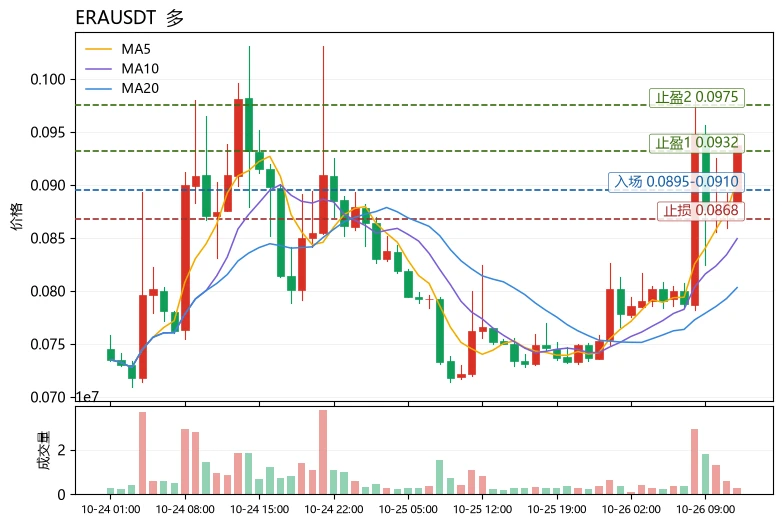
When I initially opened a long position in $UAI , I didn't actually plan to hold it for long. At the time, I judged that the short-term structure was relatively strong, so I tested the waters around 0.38587. Unexpectedly, after entering, the market kept moving more smoothly, directly offering profit potential far beyond expectations. Having a position steadies your mindset—you can hold through pullbacks, and only when the price surges do you remember that it's time to manage the position.
So today I made the decision to take profit directly on the +908.72% position, locking in most of the gains
post-image
UAI+30.82%
BTC-1.88%
XRP-3.40%
Yang Guang bit | September 5 $BTC Precise Strategy
Today's Plan
Entry timing: Enter short positions on a rebound in the 80000—80300 range
Stop-loss: Above 80700
Take-profit in stages
First target: 79000—79200
Second target: 78300—78600
Key Conclusion
Geopolitically, Trump said the US military is "intermittently striking" Iran and threatened to strike its nuclear facilities soon. Iran's military announced a shift to a "preemptive strike" mode and vowed to maintain control of the Strait of Hormuz, but BTC's safe-haven characteristic has remained inactive, with the geopolitical conflict having a
post-image
BTC-1.85%
Did you chase $ZEC at 1,010?
First, look at the surface: after ten years, it’s back above $1,000, and retail piled in like crazy.
On August 25, Grayscale’s spot ETF (ZCSH) listed on NYSE Arca. ZEC shot straight from 800 to above 1,000, briefly hitting 1,046. 24-hour trading volume topped $1 billion, and shorts were liquidated for $34 million. Daily RSI is already at 78–80, and weekly RSI has climbed above 73—so overbought that it can’t get more overbought.
First thing: the ETF is real and has launched, but the price has already run ahead of it.
Grayscale’s spot ETF (ZCSH) listed on August 25
post-image
ZEC+1.03%
I originally wanted to cut my losses and sacrifice them to the heavens, but the ritual never happened—the meat cooked itself. When I checked the chart right after lunch, $CRCLX was grinding around 91.82. One look at that lower wick and I got it: this was a textbook retest and hold, with insanely strong buying support at the bottom.
The thinking was very simple at the time: hold as long as the key level doesn’t break, and leave only if it does. Who could have imagined that it would surge straight to 101.71 in the afternoon, sending paper profits to +518.03%? The brothers on board must have wok
post-image
CRCLX-0.37%
BTC-1.88%
ADA-4.05%
#Bots I'm trading FLORKUSDT with the Futures Grid bot on Gate. Join me!
post-image
BOT-0.15%
Layout for Bitcoin, Ethereum, and Dogecoin
live-cover
LIVE2,179
  • 1
Load More

Join 40 M users in our growing community

⚡️ Join 40 M users in the crypto craze discussion

💬 Engage with your favorite top creators

👍 See what interests you

View More