Share your thoughts
placeholder
Article
Everyone’s chasing green candles, but HYPE’s 15m RSI just flashed 42.65—are you early or early exit?

$HYPE /USDT - LONG

Trade Plan:
Entry: 87.64 – 88.08
SL: 85.70
TP1: 89.48
TP2: 90.55
TP3: 92.17

Why this setup?
- 4h structure is screaming LONG with 95% confidence while the 1D trend remains bullish.
- The pullback to 87.86 (entry ref) is a textbook retest of a broken range—not a reversal.
- ATR (0.898) suggests volatility is compressing; the next expansion historically favors the trend side.
- Why now? RSI cooling off on lower timeframes gives the bull a clean springboard before TP
HYPE+2.60%
Dollar surges, gold plunges $70, Dow drops 380 points—a cross-asset massacre triggered by one data release
After the nonfarm payrolls release, the U.S. Dollar Index instantly climbed 35 points, rising from 99.035 to 99.932, up 0.5% intraday. The 10-year U.S. Treasury yield jumped 5 basis points. Spot gold plunged $70 in a short period, briefly falling below $4,400 per ounce, down 1.66% intraday.
But one detail is particularly intriguing: Gold’s decline was clearly larger than the moves in the dollar and yields would suggest. Analysts at HuiTong Finance pointed out that this indicates technical
MU+5.89%
I had just sent the app to the background when it suddenly popped back up—was it playing hide-and-seek with me? The funny thing was, I wasn’t watching it at all, yet it managed to pull itself up.
During the repeated intraday swings, $HYPE held firm every time it pulled back to around 83.212, while the key levels overhead became easier to break with each attempt. My judgment at the time was straightforward: the bulls were building momentum, and the shakeout was nearly over. So I decisively went long without bothering anyone.
By the time I switched the app to the background and checked again, it
post-image
HYPE+2.60%
ETH+0.67%
SOL+2.21%
Gold Prices Stay Near Record Territory as Global Rate Expectations Shift
live-cover
LIVE332
$BTC Please help fill this out so I can see where I really stand.
post-image
BTC-0.15%
Just recording this
The huge mistakes I made before
Can it return to the peak?
Now we’ll see how the trend develops
Currently mainly going long on SOL
The 9/15 bill provides protection against a pullback after the positive news is fully priced in
Going long with a light position
SOL+2.17%
$ETH secured the third order.
post-image
ETH+0.67%
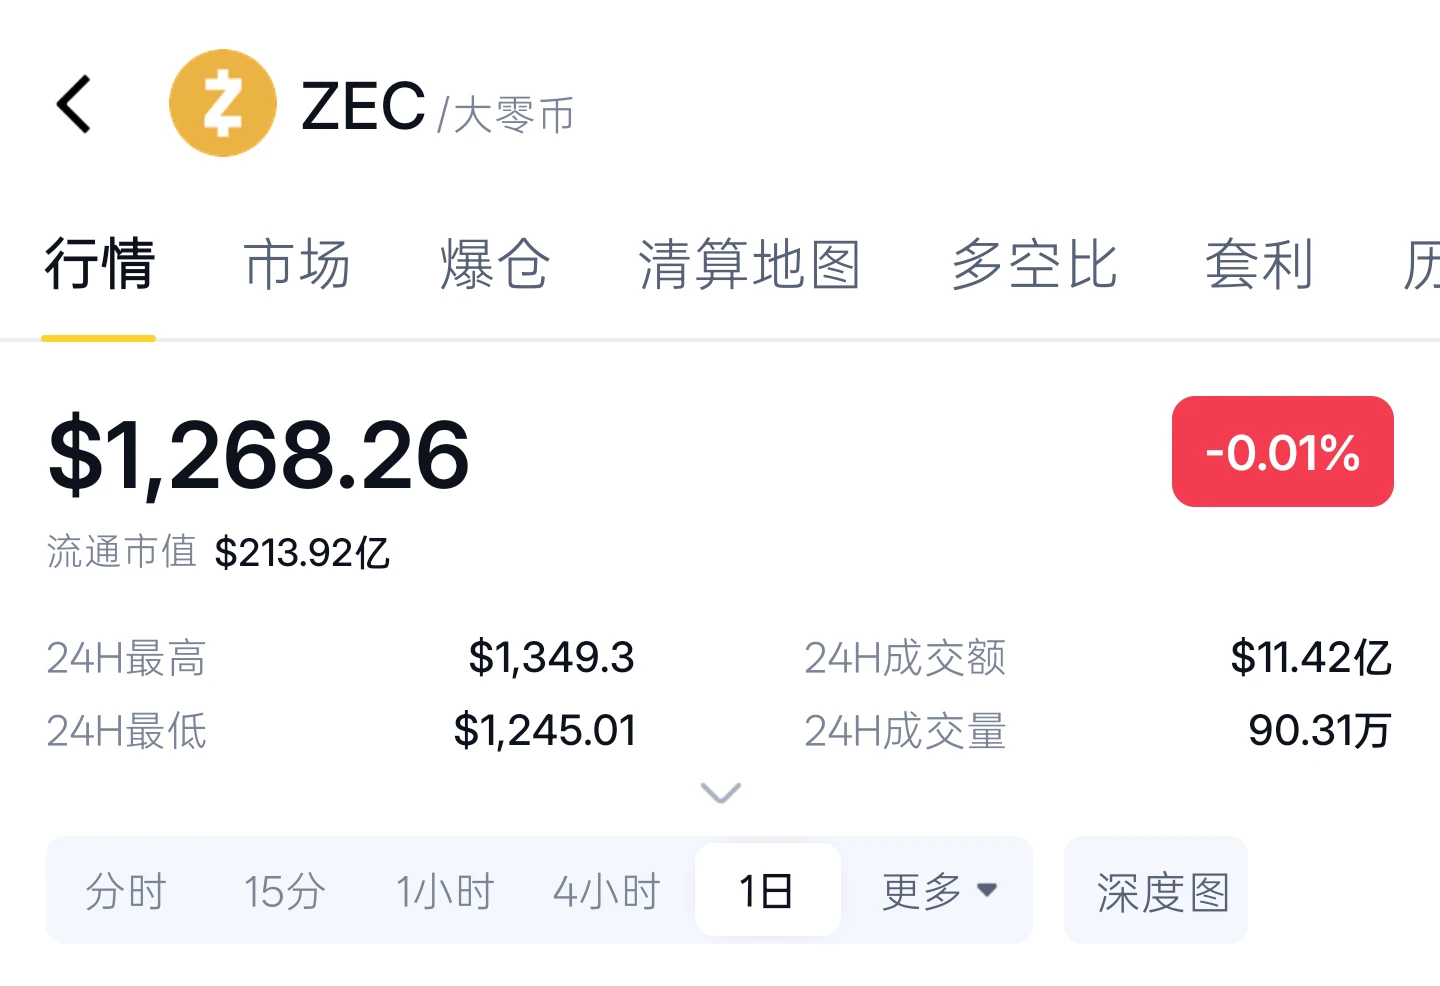
ZEC indeed broke above 1,200, wiping out shorts. Do you think it has topped out or will reach 1,500? $ZEC
post-image
What do you all think about ZEC?
It has topped out.
Keep flying.
2 Participants
Ends In 22 Hour
ZEC+19.08%
  • 1
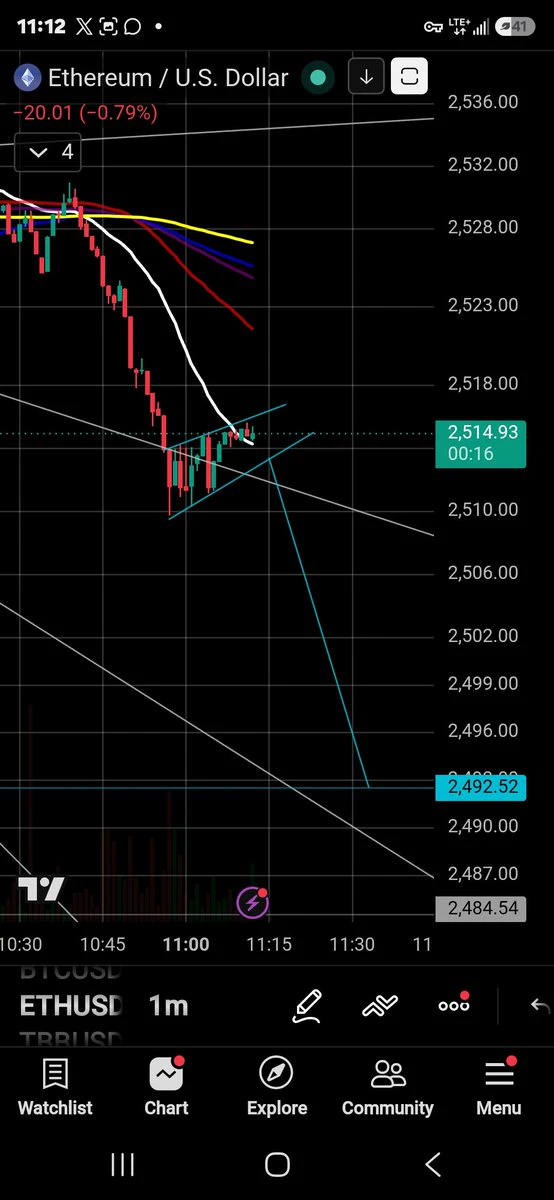
$ETH Signal】Long bias + range-bound consolidation amid order book imbalance
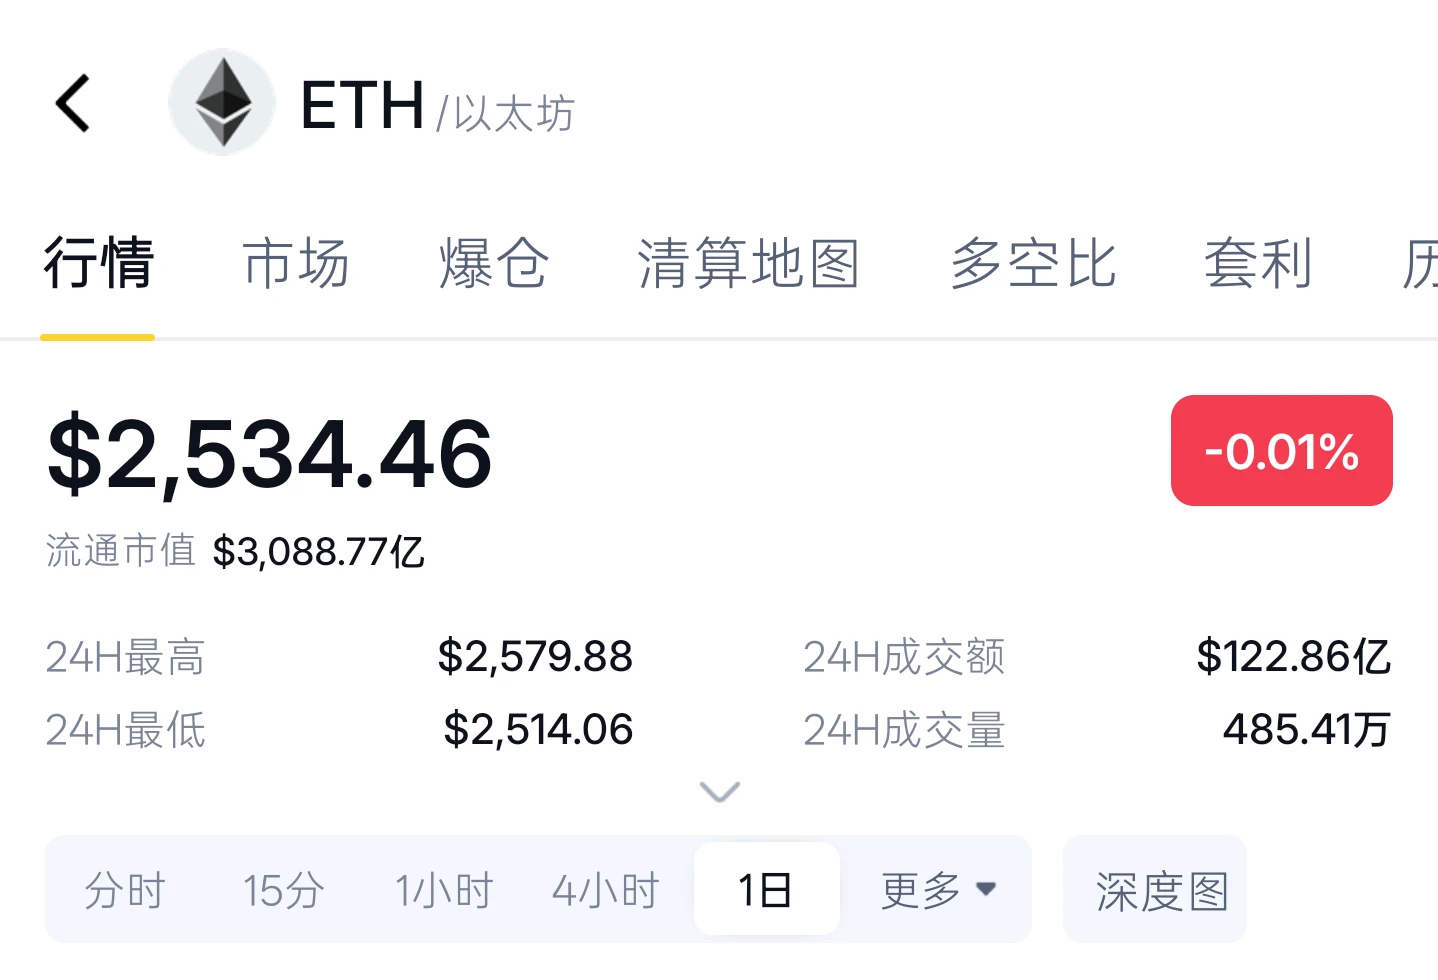
$ETH Order book depth imbalance -74.21%: sell-side depth overwhelms buy-side depth, with price stuck around 2492.
The 4H MACD histogram is positive at 1.7561, with momentum contracting. The 1H MACD histogram is -2.4745, with bearish momentum also contracting. 1H RSI is 53.66, in a neutral-to-strong zone. EMA20 and EMA50 are nearly converged on the 1H timeframe. OI is stable, with a funding rate of 0.0018%.
🎯Direction: Long
⚡Entry/limit order: 2484.9128 - 2492.3900
🛑Stop-loss: 2467.4661
🚀Target 1: 2529.7758
🚀Target
ETH+0.67%
162,000 new jobs, but two-thirds came from waiting tables and teaching kids? This data is seriously inflated
My first reaction when the nonfarm payrolls report came out was, “It’s over, we’re going to drop,” but after calming down and digging into the data, I found that those 162,000 jobs were nowhere near as impressive as they looked.
The new jobs were heavily concentrated in low-wage industries. Of the 162,000 jobs, the hospitality and food services sector jumped by 62,000 in a single month—note that this sector had already declined for two consecutive months, so this was purely a technical
SNDK+11.88%
#BTCReclaims80K
Bitcoin Back Above $80K - What The Chart Is Actually Showing
Bitcoin is trading at $79,933.9 after pushing back above $80,000 for the first time since late August. The daily high printed at $80,198.7 and the low at $79,445.6. That leaves a tight $753 range right around the big round number.
Perps are right with spot at $79,900.1, up 0.42%, while spot is up 0.43%. Volume is light at 2.32K BTC with $184.86M turnover. No blow-off, just steady buying into resistance.
The setup on the chart
On the 1-day view the moving averages are stacked bullish. EMA5 is at $79,573.6, EMA10 at $7
post-image
BTC-0.15%
ETH consolidates at elevated levels as bulls and bears intensify their battle—what comes next?
ETH recently ended its strong rebound and entered a high-level consolidation range, with the price repeatedly fluctuating around $2,400–$2,500. In August, a sharp rally driven by ETF inflows and the unwinding of short leverage attracted institutional funds, while staking lockups reduced the circulating supply, providing fundamental support.
However, short-term upward momentum has weakened somewhat. Large-scale whale selling and continued profit-taking have maintained selling pressure, while macro fac
post-image
ETH+0.63%
$SNDK
Let's see whether there will be a pullback to this FVG next week
Around 1640, I will add to my long position, preparing to target 2000🚀
post-image
SNDK+0.17%
  • 8
  • 1
Charts like this don’t stay suppressed for long
$DOT
post-image
DOT+5.11%
Looking at ETH’s overall weekly structure, the bottom formation in this cycle has been exceptionally solid. It previously followed the broader market through a deep bottoming and shakeout, fully clearing out panic positions at low levels.
The weekly chart has formed a clear bullish uptrend structure with higher lows and higher highs, firmly establishing the medium-term reversal trend. ETH is currently in the high-level consolidation phase of an upward continuation, and every pullback after a rally is a healthy shakeout correction rather than a signal that the trend has topped.
A minor short-te
post-image
ETH+0.67%
BTC-0.12%
SOL+2.21%
  • 1
I didn’t chase $EDGEX when it surged during the day, as a long-term trendline was right above it and it would have been difficult to place a stop-loss after entering. I waited for it to pull back and regain its footing before entering a long position based on the lower-timeframe structure.

After entering, it consolidated for a while. I didn’t rush to trade back and forth; once the price moved a certain distance away from my cost basis, I first closed 80% to lock in the profit on the core position, leaving the remaining 20% to follow the trend.

After the breakout candlestick appeared, I too
post-image
EDGEX-1.84%
XRP-0.60%
LAB-3.18%
A major Bitcoin/Ethereum drop in September is imminent—prepare for short positions
After Bitcoin/Ethereum quickly fell following the previous nonfarm payrolls data, the market rebounded over the weekend. Bitcoin has had little room for a rebound from yesterday to today, basically maintaining sideways volatility. Ethereum, meanwhile, has had relatively more room to rebound and has once again broken above the 2,500 mark. The previous rapid decline was accompanied by increased volume, while the current rebound is clearly occurring on declining volume. This is also a signal that the structure is i
post-image
BTC-0.12%
ETH+0.67%
new market update
live-cover
LIVE336
finished playing GTA 5 for the first time in 7 years
post-image
With just hours remaining until the weekly close, I thought it was worth sharing this fractal from the last time $BTC attempted to break above the 50-week MA, just in case it proves relevant this time around 👀
post-image
BTC-0.15%
Load More

Join 40 M users in our growing community

⚡️ Join 40 M users in the crypto craze discussion

💬 Engage with your favorite top creators

👍 See what interests you

View More