Square
Following
Hot
News
Notifications
Profile
Share your thoughts
placeholder
Article
Apps on Hedera can now offer 46 stock tokens from Robinhood, the broker with 28.7 million funded customers, from Apple and Nvidia to Netflix and Eli Lilly.
SODAX backs them 1:1. HashPack started with 4 in October.
@hedera
post-image
HBAR-1.36%
PACK-0.89%
AAPLG-0.14%
AAPL+0.18%
NVDA+3.04%
A precious historical record: Three Visits to the Thatched Cottage. Surveillance footage from 207 CE was accidentally leaked, finally revealing the truth behind why Liu Bei visited Zhuge Liang three times…
Trenches
ZIG
Z
bade
b
ZIG
0x8c...1145
Market Cap
$.
Change
.
24h Vol
$.
Holders
.
BTC
B
bade
b
BTC
C5xp...pump
Market Cap
$.
Change
.
24h Vol
$.
Holders
.
IDOL
I
bade
b
IDOL
0x3b...ab07
Market Cap
$.
Change
.
24h Vol
$.
Holders
.
scamsem
s
bade
b
scamsem
41Wp...pump
Market Cap
$.
Change
.
24h Vol
$.
Holders
.
DOGE
D
bade
b
DOGE
DoGE...fm7R
Market Cap
$.
Change
.
24h Vol
$.
Holders
.
Ptah Initial Agent Offering (IAO) @Ptahtrade #IAO
1. Free airdrop, 50% of the total supply
Exclusively for Ptah PoA cardholders; each card receives 11,250 IAO.
How to participate: From your linked X account, post one tweet using the official text on the IAO page. The text must include your Agent number
post-image
AIRDROP+0.00%
#USAIStocksHitHard
ETH/USDT Technical Analysis

Ethereum is currently trading around 2,232 on the daily chart. The overall trend remains bearish, as the price is below MA5 2,280, MA10 2,268, and MA30 2,368.

The first support zone is 2,218, followed by 2,173. If these levels break, further downside pressure may develop.

On the upside, 2,253 is the first resistance. A breakout could push ETH toward 2,268–2,281, with 2,410 as a stronger resistance.

For now, ETH remains in a weak consolidation phase. A confirmed breakout is needed before expecting a stronger recovery. Volatility remains high,
ETH-1.26%
  • 6
  • 2
Retail investor: I'm 60 with $250k saved. I know I'm late. What's even the point now.
Me: You planning to die at 65?
Retail investor: ...no.
Me: Then you've got 25+ years of compounding left & $250k to start it with. That's not late.
Retail investor: But I can't afford to lose any of it.
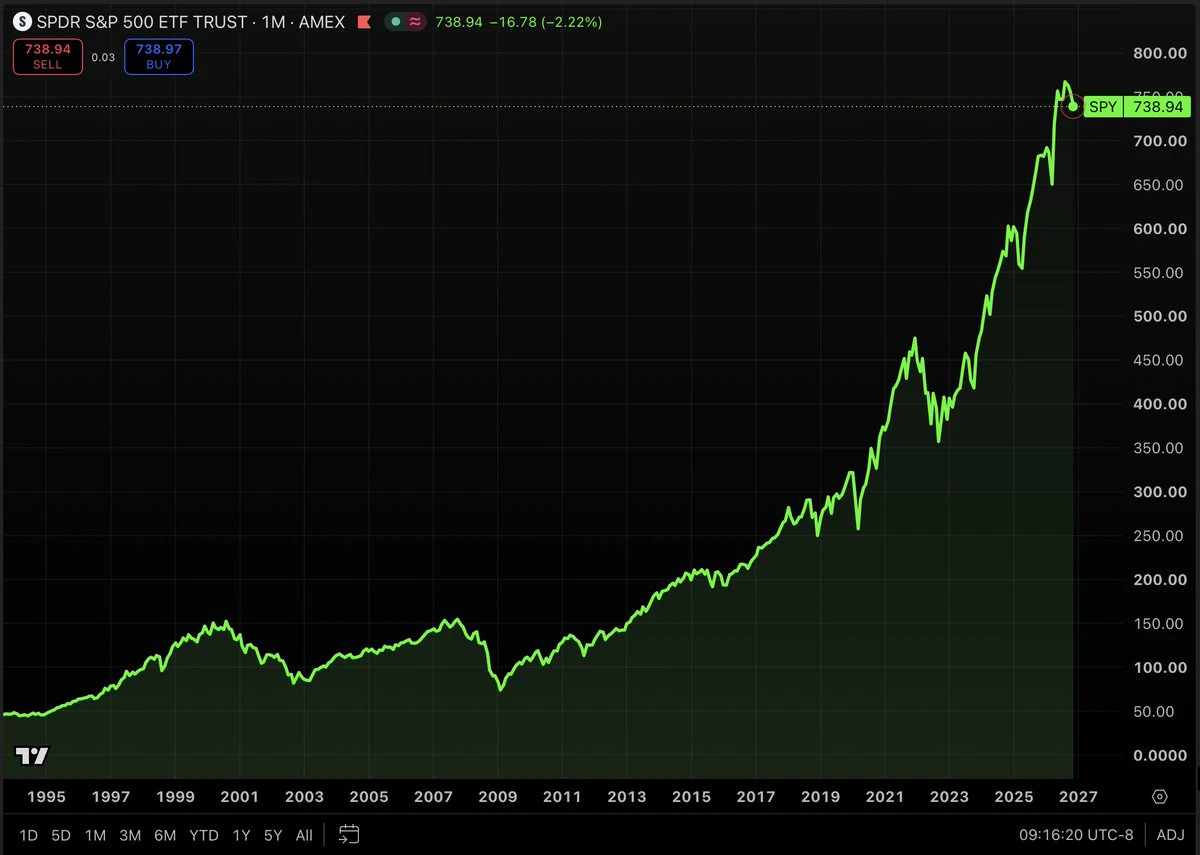
Me: Look at that chart of $SPY. The SP500 has a 50+ year track record of averaging 10% ish per year on average. Yes... Some year will be up more and down more. But in the long run... it's hard to beat.
Retail investor: So just index & hold?
Me: That's step one. Step two is that $250k can secure puts on great c
post-image
🚀 AMD Stock Market Analysis: Strong Rebound Rally & Technical Breakdown! 📈

AMD is showcasing an impressive recovery, surging +11.55% to trade at $449.03 after bouncing sharply from a recent low of $402.10. The tech giant maintains a robust market capitalization of $736.44B, with a TTM P/E ratio of 97.405 and an LFY P/E ratio of 169.449.

📊 Key Session Metrics
Current Price: $449.03 (+46.52 / +11.55%)

Day's Range: $433.30 – $459.78

Previous Close: $402.51

After-Hours: $448.14 (-0.19%)

🔍 Technical & Market Sentiment Overview
The AI Sector Bounce: This recent price action
AMD+11.55%
A 1% annual fee doesn’t sound like much. Over 30 years it can consume more than a third of your ending wealth. The edge of low-cost indexing is mostly just not giving that away.
post-image
Global Economy: Job Growth in US Tops All Forecasts
live-cover
LIVE859
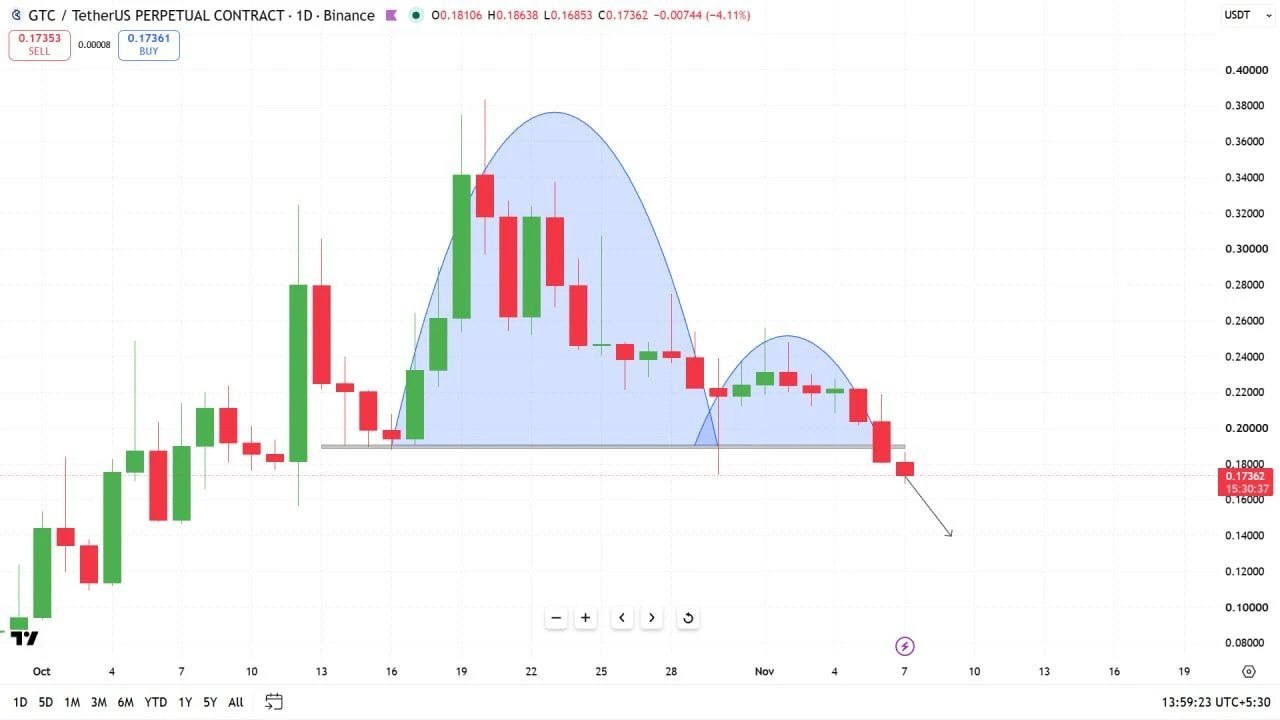
$GTC is showing clear signs of weakness after its recent breakdown.

The previous trading range has collapsed, opening the door for further downside.

Buyers are struggling to defend the price as bearish momentum builds.

Even a small recovery could turn into a trap before another sharp decline.

If demand remains weak, fresh lows could be on the horizon.

$GTC could be heading into a major correction. Stay alert!
post-image
That's why I work
Theses simple moments
No rolex, no cars. Peace and Freedom
post-image
$IDOL — Short entry: 0.04030 Take-profit 1: 0.03820 Take-profit 2: 0.03610 Stop-loss: 0.04320 IDOL is in a tricky price range, and I favor the downside opportunity here. If the rebound fails, sellers may use the opportunity to push the token price lower.
post-image
IDOL-6.71%
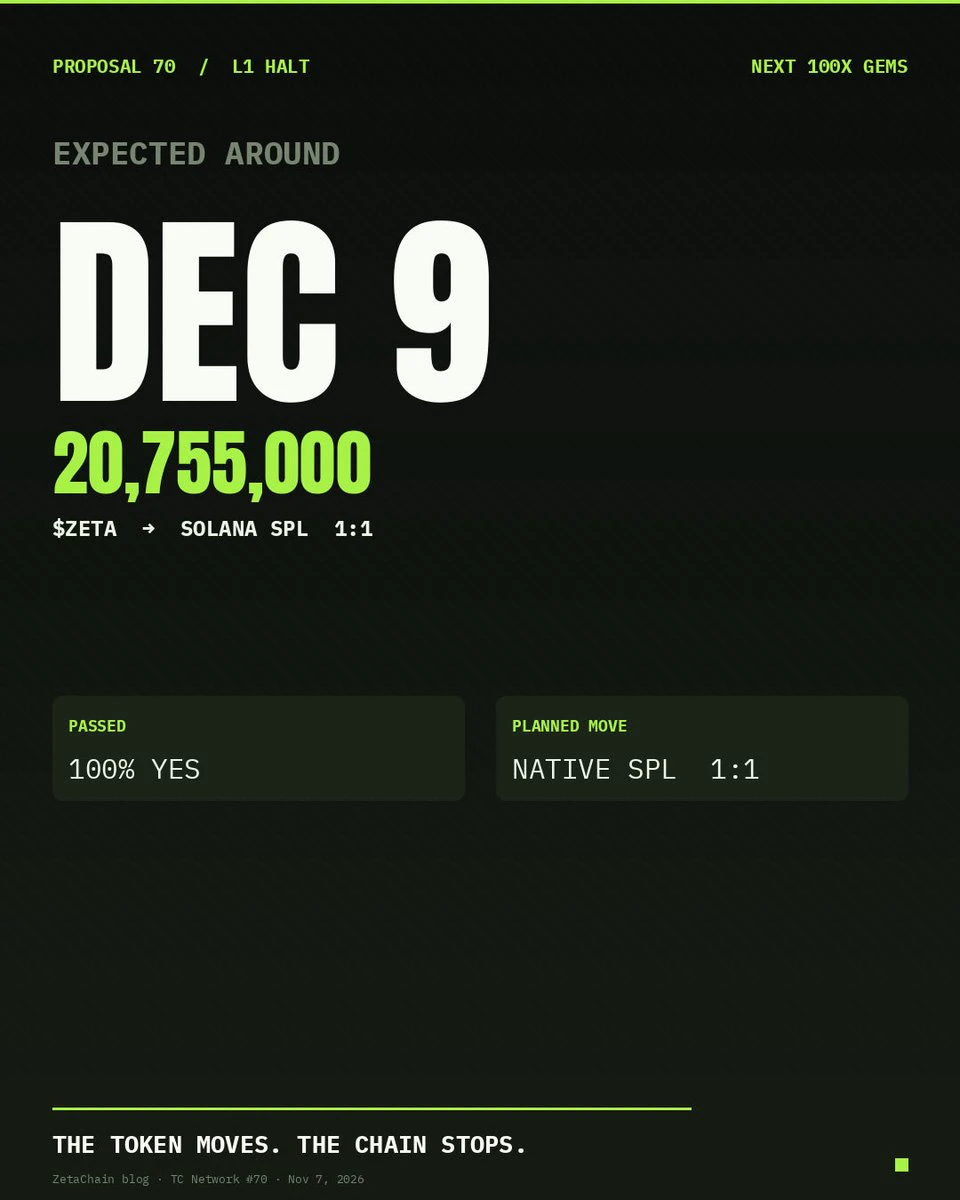
ZetaChain voted to halt its L1.
$ZETA Proposal 70: passed, 100% yes.
Final block 20,755,000, around Dec 9.
1:1 to a Solana SPL. No third-party bridge.
Wrapped or liquid-staked: exit before the snapshot to claim.
The token moves. The chain stops.
post-image
ZETA-1.29%
SOL-0.77%
I've recently been watching The Great Long March
It's so good
So tear-jerking
Compared with the past, life today is so much better
post-image
GPT hasn't seen much of the world
post-image
Trade update $AIOT has performed very well, $IDOL is currently disappointing... If IDOl closes above the previous 1D high (0.043-0.045), we'll manually close the position... Until then, hoping it plunges sharply after the liquidity sweep...
post-image
AIOT-2.28%
IDOL-6.71%
U.S. Stock Market Recap + Key AI Sector Analysis
(Early morning, November 8)
U.S. stocks ended mixed on Friday, with tech stocks staging a technical rebound after the previous day's plunge.
The Nasdaq closed at 24579.43 (+1.09%), the S&P 500 at 7376.86 (+0.31%), and the Dow at 51285.73 (-0.46%). All three major indexes still ended the week lower, with the S&P down 2.7%, the Nasdaq down 3.4%, and the Dow down 0.9%, marking their fourth consecutive weekly decline.
On Thursday, midterm election results (with Democrats winning key seats) sparked concerns about AI regulation and slower data center
#GoldmanSachsRemainsBullishOnDataCentersDespiteTheAISelloff
Goldman Sachs Remains Bullish on Data Centers Despite the AI Selloff
Despite the recent selloff in artificial intelligence (AI) stocks, Goldman Sachs remains optimistic about the long-term future of data centers. This positive outlook highlights the growing importance of digital infrastructure as businesses, technology companies, and cloud service providers continue investing heavily in AI development.
The recent AI market correction has raised concerns among investors about high valuations, excessive spending, and whether AI-related
GS-0.30%
  • 3
OpenAI Keeps Long-Term Infrastructure Spending Intact Amid Political Uncertainty
live-cover
LIVE615
🚨 BREAKING: 🇺🇸 The U.S. Treasury reportedly plans to buy back up to $95 BILLION of its own government debt over the next 3 MONTHS! 💰
The buybacks could improve liquidity in the Treasury market and ease trading conditions.
A potentially BULLISH development for financial markets!
post-image
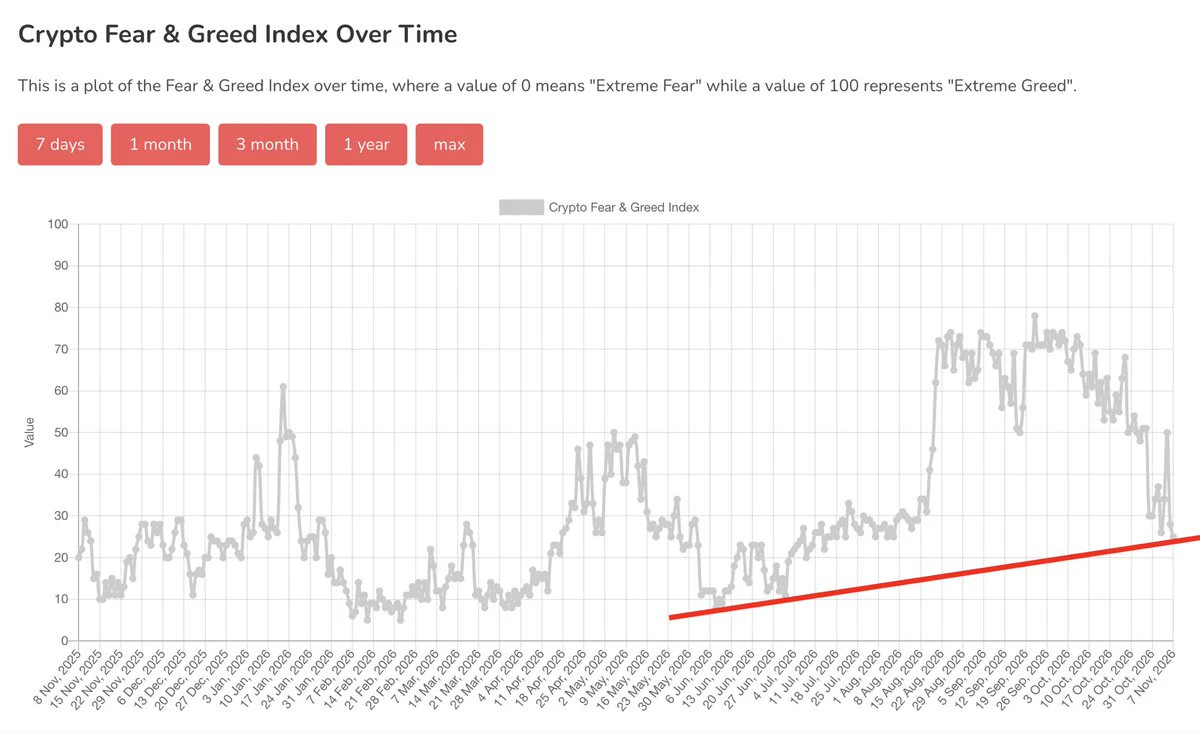
The Crypto Fear and Greed Index is often a solid indicator for spot buying. When everyone is scared, it is usually a good time to buy. Right now, the $BTC Fear and Greed Index is at "EXTREME FEAR". You already know what that means 👀
post-image
BTC-0.67%
  • 1
Load More

Join 40 M users in our growing community

⚡️ Join 40 M users in the crypto craze discussion

💬 Engage with your favorite top creators

👍 See what interests you

Trending Topics

USAIStocksHitHard

20.03k Views3.67k Discussing

U.S. stocks sold off sharply on Thursday, November 5 (UTC). The Nasdaq closed down around 5.5%, entering correction territory, while the Philadelphia Semiconductor Index plunged roughly 12%, with chip stocks including $NVDA and $AMD posting steep losses. Beyond profit-taking, investors are growing concerned about the pace of AI data center construction, capital spending, and future returns on investment. The key question now is whether the AI sector’s lofty growth expectations need to be repriced. Where do you think the next opportunities will emerge: chip stocks, tech giants, or other sectors?

USNonfarmPayrolls

32.83k Views4.33k Discussing

StakeOnLaunchpoolToShare450KVLX

8.87k Views823 Discussing

View More